Ning Li (2023). Construction of commander's visual model under long-term voyage. In: Human Factors and Systems Interaction. AHFE Open Access, vol. 84, pp. 142–149. https://doi.org/10.54941/ahfe1003599
Marine Human Factors Engineering Laboratory, China Institute of Marine Technology, and Economy, 70 Xueyuan South Road, Haidian District, Beijing, China ↗
Long-term voyage ships have the characteristics of isolation and airtightness, 24-hour continuous duty, and being far away from the coastline. The long-term voyage state will have an impact on the visual ability of the commander, which in turn will have an impact on the cognitive performance in the process of human-computer interaction. As a result, the human-computer interaction tasks that can be completed under normal circumstances may not be completed under long-term voyage state. The existing researches have insufficient description of visual model under long-term voyage status. Therefore, based on the original EMMA visual model, this paper designs a visual parameter collection experiment under the 90-day long-term voyage state, selects 8 subjects for data collection of eye movement preparation time and eye movement saccade speed, constructs a commander's visual model under 90-day long-term voyage and analyses the reasons for the changes in the commander's visual parameters.
The eye movements and movement of attention(EMMA) model divides the eye movement behavior into two parts: eye movement preparation and eye movement saccade (Salvucci, 2000). The saccade time of eye movement (Texec) depends on the saccade speed and saccade angle of human eyes. The preparation time (Tprep) and saccade speed (v) of eye movement tend to be fixed for special groups, and they need to be tested in combination with specific people and equipment. If the same parameters are used for diffe- rent people and equipment, it will lead to calculation error (Salvucci, 2000). According to the literature description, the default time of Tprep is 150ms, the saccade default speed of v is 2ms/deg (Salvucci, 2000). Texec is composed of three parts: eye movement saccade programming time 50ms, eye move- ment saccade base time 20ms, eye movement saccade speed v (default 2ms) multiplied by degrees d (Becker & Jürgens, 1979; Fuchs & Luschei, 1971; Li et al., 2020; Salvucci, 2000), see Formula(1).
Construction of Commander’s Visual Model Under Long-Term Voyage 143
Domestic and foreign scholars Twilhaar, Ryan, Deng and so on apply the EMMA model to the visual modeling of teenagers (Twilhaar et al., 2020), pilots (Ryan, 2020) and pilots (Deng, Wu, Cao, & Lyu, 2019). Li has con- structed the visual model of commander in regular state based on EMMA model (Li et al., 2020). However, the warship has a special long-term voyage working state, and the commander’s visual ability will change because the commander’s own ability will change in the long-term voyage state. There- fore, the visual model of the commander in the long-term voyage state should change with the long-term voyage time, but the existing research does not give the law of visual change in the long-term voyage state.
Based on the above background, this paper designs a 90-day long-term voyage vision parameter measurement experiment, collects the experimental data of eye movement preparation time and eye movement scanning speed under long-term voyage, constructs the visual model of a 90-day long-term voyage commander based on EMMA model, and analyzes the reasons for the change of commander’s visual parameters under long-term voyage.
EXPERIMENTAL EQUIPMENT In the experimental environment, the experiment built a cabin with isolated airtight and long-term voyage environment, in which the subjects can achieve independent work, catering, accommodation and so on. After the beginning of the experiment, the cabin was closed for 95 days until the end of the expe- riment. During the period, the subjects could not get out of the cabin, and tried to simulate the isolated airtight and long-term voyage environment. In order to ensure the stability of the objective conditions of the experiment, the light environment, sound environment, temperature and humidity in the experimental cabin all simulate the typical environment of the warship, in which the light environment in the working area is 60lux, the temperature is 23-25
C, and the noise is 55dB. The parameters remain unchanged under the adjustment of the control system of the experimental cabin.
In terms of experimental equipment and environment, experimental equi- pment includes display and control equipment of warship command and control system, display, mouse, keyboard and eye movement measure- ment equipment Li et al., 2021). The size of the screen display area is 52.71 × 29.65cm and the display resolution is 1600 × 1200dpi. The eye movement measurement equipment adopts the TobiiProSpectrum600 eye movement meter and the sampling rate is 600Hz. It has the ability to track the commander’s eye movement data quickly and with high precision.
EXPERIMENTAL SUBJECTS In the aspect of subject selection, the subjects were 20 simulated commanders of the warship command and control system, who had the experience of operating the warship command and control system, signed the informed consent form for the experiment, and all reached the qualified standard after professional training. The 20 subjects included 12 males and 8 females, with
144 Li
an average age of (30.2 ± 4.1) years, an average working life of (5.4 ± 0.8) years, a corrected visual acuity of more than 1.0 and a right-handed.
EXPERIMENT ON MEASUREMENT OF EYE MOVEMENT PARAMETERS UNDER LONG-TERM VOYAGE The actual duration of long-term voyage vision experiment lasted a total of 95 days. According to the arrangement of the experimental task, eight expe- riments were carried out on the 1st, 12th, 27th, 39th, 54th, 66th, 78th and 92nd day after the start of the task. The preparation time of eye movement (Tprep) and the saccade speed of eye movement (v) were collected. The data collection process of each experiment is as follows.
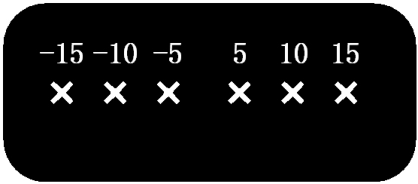
Experiment on the Measurement of Eye Movement Preparation Time Experimental – Process First of all, the subjects kept the sitting position in accordance with the requi- rements of the experiment and kept their head fixed as much as possible. The subjects could not compensate for the angle by turning their head, but could only use eye movement to look at the target. Secondly, the subject carries on the task training to the subject, and the subject carries on the experiment after passing the examination. Third, turn on the eye movement instrument to calibrate the subjects’ eye movement position, and the calibration program will let the subjects check the calibration points in the center of the screen and the four corners of the screen. Finally, load the experimental task, the specific task is to look at the seven “x” icons displayed on the display and control device from left to right (see Figure 1). Subjects need to move to the next icon as quickly as possible on the premise of seeing each icon clearly. The experimental cycle lasted 50 rounds, with a total of 350 stares. The whole experiment lasted 30–45 minutes, and the subjects could rest at any time. During the rapid scanning of the subjects, the eye movement meter measured and recorded the fixation time on each icon “×”.
Experimental – Results The fitting process of the eye movement preparation time change model in the long-term voyage state is as follows: first, the eye movement prepara- tion time is obtained by subtracting the fixed time of 70ms from all the data
Figure 1: Experimental schematic diagram of eye movement preparation time measurement.
Construction of Commander’s Visual Model Under Long-Term Voyage 145
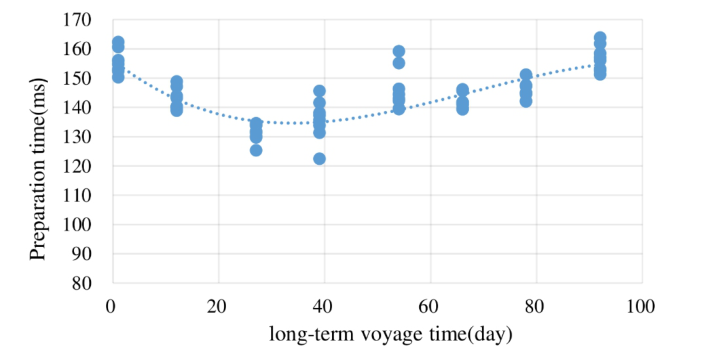
collected in each of the 8 experiments, the mean and standard deviation are calculated, the data more than 3 times of the standard deviation are elimina- ted, and the mean value is used to replace it, so as to reduce the influence of noise data on the subsequent fitting results. The average value (M) and stan- dard deviation (SD) of 8 subjects in each experiment were calculated in turn. Secondly, taking the long-term voyage time as an independent variable and 8 averages of 8 subjects in each experiment as dependent variables (a total of 64 points), polynomial fitting was carried out, taking into account the changing law of the data itself, the interpretability of the fitting results and the fitting coefficient (R2 = 0.63). Finally, cubic polynomial fitting was selected, and the results are shown in Figure 2. The change model of the long-term voyage state commander is shown in the Formula (2). The error between the com- mander and the model prediction is shown in Table 1, the maximum fitting error is -4.81%, and the average absolute error is 1.89%.
Figure 2: The change model of eye movement preparation time under long-term voyage.
146 Li
Among them: ϕvpl(t) is eye movement preparation time for long-term voyage (ms), t is long-term voyage time (days).
Experiment on the Measurement of Eye Movement Saccade Speed Experimental – Process First of all, the subjects kept their sitting posture according to the require- ments of the experiment (consistent with the experiment of measuring the preparation time of eye movement). The subjects were trained in the task, and the subjects carried out the experiment after passing the examination. Secondly, in order to ensure that the initial position of the subjects is exactly in the center of all the target points, during the preparation of the experi- ment, the seats of the commander, the subjects and the display and control equipment screens are aligned. In the experimental data collection program, three groups scanning points are symmetrical on both sides of the vertical and horizontal centerline of the screen. Finally, the specific task of the experiment is to look at the two “×” icons displayed at different angles in the display, as shown in Figure 3. There are 6 icons in the picture, 2 in each group, a total of 3 groups, and the positions of icons in each group are ±5
, ±10
and ±15
, respectively. The subjects were asked to scan the two icons displayed on the screen alternately back and forth. When the subjects determined the correct amplitude, the icons were hidden (no perceptible image was left). The subjects tried to continue to scan from different angles without a target. The essence of eye movement in the dark is obvious saccade, which has a longer duration and a smaller peak velocity than under good lighting conditions. The saccade experiments of ±5
, ±10
and ±15
angles appeared randomly, and each subject needed to carry out 50 groups of experiments under each angle condition, a total of 150 groups. The eye movement meter recorded the time of eye movement under dark conditions after the subjects formed the correct amplitude.
Experimental – Results The fitting process of the change model of saccade speed is as follows: first, calculate the mean and standard deviation of all the data collected in each of the 8 experiments, eliminate the data more than 3 times the standard devi- ation, and use the mean to replace it, in order to reduce the influence of
Figure 3: Experimental schematic diagram of eye movement saccade speed measurement.
Construction of Commander’s Visual Model Under Long-Term Voyage 147
noise data on the subsequent fitting results, and further calculate the ave- rage and standard deviation of each subject on the three saccade gradients of ±5
, ±10
and ±15
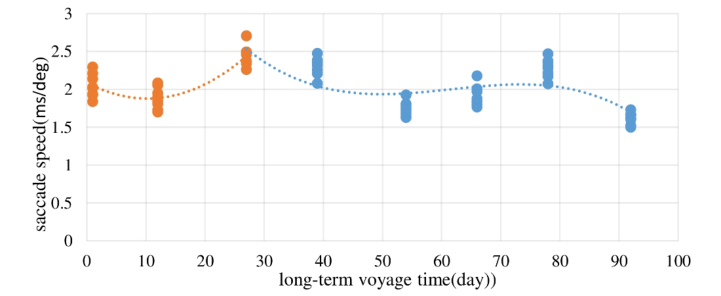
. Secondly, according to the linear fitting method of the conventional state scan speed model, eight saccade speeds of 8 sub- jects per day are obtained, and their mean (M) and standard deviation (SD) are shown in Table 2. Finally, taking the long-term voyage time as the inde- pendent variable and 8 saccade speed of 8 subjects in each experiment as dependent variables (a total of 64 points), polynomial fitting was carried out, comprehensively considering the variation law of the data itself, the interpre- tability of the fitting results, the fitting coefficient and the change law of eye movement preparation time, and considering that the overall fitting coeffi- cient of all data was low (R2 = 0.21) and high power, finally, the piecewise fitting was adopted. Taking the 27th day as the segmentation point, the data were divided into two stages (P < 0.05). Before and after the 27th day, the data were fitted by quadratic and cubic polynomials (R2 = 0.75 and 0.58 respectively). The results are shown in Figure 4. For the change model of saccade speed of long-term voyage, see Formula (3), the absolute maximum error of fitting is 11.67%, and the average absolute error is 5.57%.
Table 2. Eye movement saccade speed of 8 commanders under long-term voyage.
Equations and mathematical formulas are available in the original paper PDF.
(3) Among them: ϕvvl(t) is the saccade speed of eye movement (ms/deg), t is the time of long-term voyage (days).
CONCLUSION
We make a preliminary analysis of the reasons for the change of Tprep (Figure 2) under the condition of long-term voyage, the preparation time of eye movement Tprep decreases at first and then increases, and changes when the time of long-term voyage is about 30 days. The decrease of Tprep may be due to the decrease of external interference to the vision of the subjects after entering the isolation chamber (for example, the subjects are not allowed to use mobile phones, pads and other electronic products in the experimental cabin), and the degree of visual fatigue decreases, which is reflected in the decrease of Tprep. The increase of Tprep may be due to the gradual increase of fatigue and visual fatigue, which is reflected in the increase of Tprep.
We make a preliminary analysis of the reasons for the change law of eye movement saccade speed v(Figure 4): under the condition of long-term voyage, v as a whole shows a trend of rising at first and then decreasing, and changes when the time of long-term voyage is about 30 days, which is basi- cally consistent with the change law of Tprep (because the meaning of y-axis data is different, the change trend of the whole curve is opposite to Tprep). Combined with the change law of Tprep, the increase of v may be due to the decrease of external interference and the decrease of visual fatigue after entering the isolation chamber, and the decrease of v may be due to the incre- ase of body fatigue and visual fatigue with the progress of long-term voyage experiment.
Based on the measurement conclusion of long-term voyage state parame- ters, combined with the EMMA model, the visual model of long-term voyage state commander consists of three parts: the first is the eye movement pre- paration time of long-term voyage state is equal to ϕvpl(t), the second is the saccade speed of long-term voyage state is equal to ϕvvl(t), and the third is the formula of visual saccade time, see Formula 4.
Tv(t) = 50 + 20 + ϕvvl(t) ∗d (4) Among them: Tv(t) is the saccade time (ms), ϕvvl(t) is the saccade speed (ms/deg), d is the saccade angle (deg), t is the time of long-term voyage (days).
ACKNOWLEDGMENT
This work was supported in part by the National Defence Pre-Research Foundation under Grant 50912020105.
(Corresponding author: Ning Li.)
Construction of Commander’s Visual Model Under Long-Term Voyage 149
REFERENCES
Becker, W., & Jürgens, R. (1979). An analysis of the saccadic system by means of double step stimuli. Vision Research, 19(9), 967–983. Deng, C., Wu, C., Cao, S., & Lyu, N. (2019). Modeling the effect of limited sight
distance through fog on car-following performance using QN-ACTR cognitive architecture. Transportation research part F: traffic psychology behaviour, 65, 643–654. Fuchs, A., & Luschei, E. (1971). The activity of single trochlear nerve fibers during eye movements in the alert monkey. Experimental brain research, 13(1), 78–89. Li, N., Chen, X., Feng, Y., & Huan, J. Human-computer Interaction Cognitive
Behavior Modeling of Command and Control Systems. IEEE Internet of Things Journal, 2021, 1–14. Li, N., Zhou, T., Shi, J., Chen, Z., Huang, J., & Feng, Y. (2020). Research on Eye Movement Parameters of Command and Control System Operator Based on Emma Model. Paper presented at the International Conference on Applied Human Factors and Ergonomics. Ryan, A. E. (2020). The interplay of eye movements and attention in a continuous
flight related task. The University of Queensland, Australia. Salvucci, D. D. (2000). A model of eye movements and visual attention. Proceedings of the International Conference on Cognitive Modeling, 252–259. Retrieved from https://www.cs.drexel.edu/∼salvucci/publications/Salvucci-ICCM00. Twilhaar, E. S., Belopolsky, A. V., de Kieviet, J. F., van Elburg, R. M., & Oosterlaan,
J. (2020). Voluntary and involuntary control of attention in adolescents born very preterm: A study of eye movements. Child development, 91(4), 1272–1283.
LISTED IN THE AHFE DIGITAL BOOKSTORE CATALOGUE
Explore the complete digital volume
Human Factors and Systems Interaction
Read this individual research paper free through the original publisher, or explore the full digital proceedings book.
ISBN 978-1-958651-60-5
Explore this ISBN in the AHFE Bookstore ↗Listed in the July 2026 bookstore catalogue; search by ISBN to confirm current availability · Digital book purchase optional