Atsuo MURATA, Tomoya MATSUURA, Makoto MORIWAKA (2022). Nonlinear Dynamical Analysis of Eye Movement Characteristics. In: Advances in Ergonomics In Design, Usability & Special Populations: Part II. AHFE Open Access, vol. 19. https://doi.org/10.54941/ahfe1001239
The purpose of this study was to clarify eye movement characteristics during a visual search using nonlinear dynamics (scaling properties). More concretely, the fractal dimensional analysis by means of the box-counting technique was carried out for the time series data of x- and y-directional gaze-locations. The eye movement characteristics during two types of search tasks were measured and analyzed. It tended that the search time increased with the increase in task difficulty such as the display range and the layout complexity. For both x- and y-directional eye movements, it tended that the scaling property represented by the fractal dimension increased with the increase of difficulty of a search task. The fractal dimension also tended to be smaller for the wide display than for the narrow display. On the basis of the result that the search time and the x- and y-directional fractal dimensions were not so strongly related, we inferred that the search time and the fractal dimension stem from the different mechanism underlying a variety of search activities.
We are looking at some object to obtain information from it, and comprehend the situation around the object. Observation of eye-gaze locations enables us to infer viewer’s internal cognitive state or intention. Although eye gaze is relatively simple as compared with other communication means such as gesture or speech, it can provide us with abundant information on our perception and cognition.
Eye movement is classified into the following four types. Eye gaze is typically directed to one location on a display for about 200-300 ms (this is called fixation), and then moves to another location extremely rapidly (in about 20- 30ms) (this is termed saccade). The angular rotation of saccade is about 600 deg/s. We are momentarily and effectively blind during the saccadic eye movement. Saccade jumps automatically to the location predetermined by the brain’s visual system during the preceding fixations. If the movement is more than 15 deg, our head rotates automatically. Nystagmus is explained by reference to a common experience that of looking out of the window of a moving train and attempting to keep up with the view rather than find out some feature within the view. Nystagmus is a response to rapidly moving objects. The last eye movement is smooth pursuit to smoothly follow an object. However, it must be noted that there is a limit to the speed of such a movement.
The question of how people select fixation point as they move their eyes around a display in front of them might be addressed with reference to specific activities necessary for cognition. In daily life, nothing can be performed without the retrieval of information. The evaluation of eye movement characteristics and performance measures provides us with an important knowledge on the information strategy used in search tasks. Many studies (Nakano et. al., 2013, Spence et. al., 2013, Hung, 2001, Tovée, 2008, Chekaluk and Llewelly, 1992, Land and Tatler, 2009, Underwood, 2005, Findlay et. al., 1995, Hyönä et. al., 2003, Wartburg, 2006 and Wade and Tatler, 2005) on eye movement characteristics are conducted to clarify a variety of cognitive processes.
It has been widely known that nonlinear chaotic dynamics are ubiquitous in many biological systems such as Electroencephalography (EEG), pulsation in capillary vessels, body sway, and hear rate (Murata and Iwase, 1998, Murata and Iwase, 2001, Iwase and Murata, 2002 and Iwase and Murata, 2004). Fairbanks and Taylor, 2011 proposed a method for measuring the scaling properties of temporal and spatial patterns of eye movements. Although eye movements are classified into four types as mentioned above, it is also possible to grossly classify eye movements into saccade, fixation, and micro-saccade. Micro-saccades generally occur over an angular range of typically 0.5 degree called dwell region. The characteristics of saccades are represented by ballistic jumps. It is regarded that saccades and micro-saccades are produced by different physiological mechanisms. Therefore, the nonlinear behaviors (in particular, scaling behaviors expressed by the fractal dimension, or the spectral exponent) of these eye movements are expected to be different.
Although Fairbanks and Taylor (2011) demonstrated how to express scaling behaviors, the scaling behaviors of a variety of visual activities such as a visual search have not systematically explored. It is of interest to examine how the scaling behaviors differ according to the difficulty of search, the type of search, and so on. We must clarify whether the scaling properties are helpful for understanding eye movement further, and provide us with new information which the traditional analysis of eye movements (Nakano et. al., 2013, Spence et. al., 2013, Hung, 2001, Tovée, 2008, Chekaluk and Llewelly, 1992, Land and Tatler, 2009, Underwood, 2005, Findlay et. al., 1995, Hyönä et. al., 2003, Wartburg, 2006 and Wade and Tatler, 2005) cannot provide.
The purpose of this study was to clarify eye movement characteristics during a visual search using nonlinear dynamics (scaling properties). More concretely, the fractal dimension analysis by means of the box-counting technique was carried out for the time series data of x- and y-directional gaze-locations.
METHOD
Participants Ten male undergraduate or graduate students from 22 to 24 years old took part in the experiment. The visual acuity of the participants in both young and older groups was matched and more than 20/20. They had no orthopedic or neurological diseases. All signed the document on informed consent after receiving a brief explanation of the aim and the contents of the experiment.
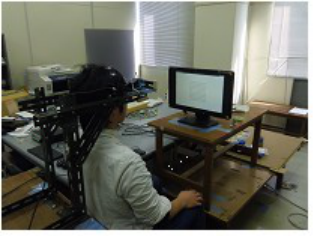
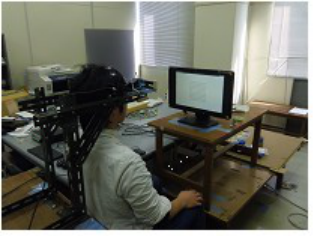
Apparatus The eye movement during a search task was measured using an eye-tracker equipment (ViewTracker, DITECT). This eye-gaze measurement system makes use of infrared and visual camera technologies to determine the eye-gaze locations. The resolution of the computer display was 640 by 480 pixel. The sampling frequency of the eye-tracker equipment was 60Hz. The photos of experiment are shown in Figure 1.
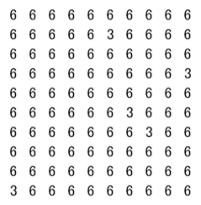
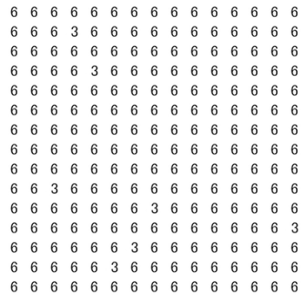
Search Task The following two types of search task (search task 1 and search task 2) were carried out by the participants. The participant was required to search for the pre-specified target stimulus and indicate how many targets were included. The viewing distance was set to 75cm. The first search task was to search for predetermined numbers (3, 7, or 8) from the array of numbers almost all of which consisted of 6 as shown in Figures 2-4. When the matrix consists of 6, the target 7 is expected to be easy to search for, and the targets 3 and 8 are expected to be difficult to search for. The display subtended vertically and horizontally a visual angle of 4.3, 9.3, or 14.2 degrees. The matrices for the small, the medium, and the large display were 5 X 5, 10 X 10, and 15 X 15.
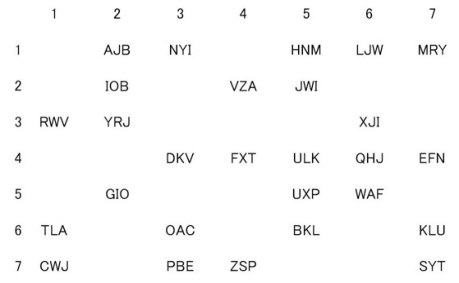
The second search task was to search for a target stimulus that consisted of three random letters. The layout complexity LC (Murata and Furukawa (2005)) was calculated according to Eq.(1)
Figure 1. Photos of experimental scene.Figure 2. Examples of narrow display. 5 X 5 matrix. The display subtended vertically and horizontally a visual angle of 4.3 degrees. Left: two targets(3), Center: one target(7), Right: one target(8).Figure 3. Examples of medium display. 10 X 10 matrix. The display subtended vertically and horizontally a visual angle of 9.3 degrees. Left: five targets(3), Center: five targets(7), Right: four targets(8).
n i i p p N LC [Equation or mathematical symbol available in the original paper PDF] i
1 2 (1) , log
[Equation or mathematical symbol available in the original paper PDF][Equation or mathematical symbol available in the original paper PDF][Equation or mathematical symbol available in the original paper PDF] in which N is the number of objects on the display, n is the number of groups of similar objects, and pi is the probability of selecting an object from group i. LCs for the horizontal and the vertical directions are calculated separately. In this study, four kinds of LCs (50bits, 100bits, 150bits, and 200bits) were used. The displays for LC of 50 bits, 100 bits, 150 bits, and 200 bits are demonstrated in Figure 5(a)-(d), respectively. The display in Figure 5(a)- (d) subtended vertically and horizontally 14.4 degrees and 22.6 degrees, respectively.
Design and Procedure In the first search task, the figure (form) of numbers (3, 7, and 8) and the range of display (narrow, medium, and wide) were all within-subject factors. The order of performance of 9 (= 3 X 3) conditions was randomized across the participants. Eye movements during the search task of each condition were recorded ten times for each participant.
In the second search task, LC was a within-subject factor. The order of performance of four conditions of LC was randomized across the participants. Eye movements during the search task of each condition were recorded ten times for each participant.
Figure 4. Examples of wide display. 15 X 15 matrix. The display subtended vertically and horizontally a visual angle of 14.2 degrees. Left: seven targets(3), Center: eight targets(7), Right: seven targets(8).Equation reproduced from the original PDF.Equation reproduced from the original PDF.Figure 5. Display used in the second search task. Each display (a)-(d) subtended vertically and horizontally 14.4 degrees and 22.6 degrees, respectively.
narrow range of display middle range of display wide range of display
Search time ms
0 2000 4000 6000 8000 10000 12000 14000 16000
7 3 8 Target
Figure 6. Search time as a function of figure (form) of target and display range when the number of search targets is 1 or 2.
Figure available in the original PDF paper.
1.6
middle range wide range
1.2 1.4
1
0.8
0.4 0.6
Fractal dimension
0.2
0
7 3 8 Target
Figure 7. Fractal dimension of x-direction eye movement as a function of figure (form) of target and display range when the number of search targets is 1 or 2.
Figure available in the original PDF paper.
Evaluation Measure The search time for each condition was measured with the accuracy of 10ms. The time series of x- and y-locations were measured for each condition. The fractal dimension of x- and y-directional coordinates was also calculated for each condition.
RESULTS
Search Task 1 The search times for (i) one or two targets, (ii) four or five targets, and (iii) seven or eight targets are plotted as a function of the figure (form) of numbers (3, 7, and 8) and the range of display (narrow, medium, and wide) in Figures 6, 9, and 12, respectively. The fractal dimension of time series of x-directional eye movements for (i) one or two targets, (ii) four or five targets, and (iii) seven or eight targets are plotted as a function of the figure (form) of numbers (3, 7, and 8) and the range of display (narrow, medium, and wide) in Figures 7, 10, and 13, respectively. Similar fractal dimension of time series of y-directional eye movements are shown as a function the figure (form) of numbers (3, 7, and 8) and the range of display (narrow, medium, and wide) in Figures 8, 11, and 14.
1.6
middle range wide range
1.4
1 1.2
0.6 0.8
Fractal dimension
0.2 0.4
0
7 3 8 Target
Figure 8. Fractal dimension of y-direction eye movement as a function of figure (form) of target and display range when the number of search targets is 1 or 2.
Figure available in the original PDF paper.
middle range of display wide range of display
Search time ms
0 2000 4000 6000 8000 10000 12000 14000 16000
7 3 8 Target
Figure 9. Search time as a function of figure (form) of target and display range when the number of search targets is 4 or 5.
Figure available in the original PDF paper.
1.6
1.4
middle range wide range
1 1.2
0.8
0.6
Fractal dimension
0.2 0.4
0
7 3 8 Target
Figure 10. Fractal dimension of x-direction eye movement as a function of figure (form) of target and display range when the number of search targets is 4 or 5.
Figure available in the original PDF paper.
middle range wide range
Fractal dimension
0 0.2 0.4 0.6 0.8 1 1.2 1.4 1.6
7 3 8 Target
Figure 11. Fractal dimension of y-direction eye movement as a function of figure (form) of target and display range when the number of search targets is 4 or 5.
Figure available in the original PDF paper.
middle range of display wide range of display
Search time ms
0 2000 4000 6000 8000 10000 12000 14000 16000
7 3 8 Target
Figure 12. Search time as a function of figure (form) of target and display range when the number of search targets is 7 or 8.
Figure available in the original PDF paper.
middle range wide range
Fractal dimension
0 0.2 0.4 0.6 0.8 1 1.2 1.4 1.6
7 3 8 Target
Figure 13. Fractal dimension of x-direction eye movement as a function of figure (form) of target and display range when the number of search targets is 7 or 8.
Figure available in the original PDF paper.
1.6
middle range wide range
1.2 1.4
1
0.6 0.8
Fractal dimension
0.2 0.4
0
7 3 8 Target
Figure 14. Fractal dimension of y-direction eye movement as a function of figure (form) of target and display range when the number of search targets is 7 or 8.
Figure available in the original PDF paper.
A two-way (figure (form) of numbers by range of display) ANOVA (Analysis of Variance) conducted on the search time for (i) one or two targets revealed a significant main effect of figure (form) (F(2,12)=21.563, p<0.01) and range of display (F(2,12)=18.927, p<0.01). A figure (form) by range of display interaction was also significant (F(4,24)=14.227, p<0.01). A similar two-way ANOVA conducted on the search time for (ii) four or five targets revealed a significant main effect of figure (form) (F(2,12)=17.543, p<0.01) and range of display (F(2,12)=52.888, p<0.01). A figure (form) by range of display interaction was not significant. A similar two-way ANOVA conducted on the search time for (iii) seven or eight targets revealed a significant main effect of figure (form) (F(2,12)=13.953, p<0.01) and range of display (F(2,12)=6.895, p<0.05). A figure (form) by range of display interaction was also significant (F(4,24)=5.001, p<0.05).
A similar two-way ANOVA conducted on the x-directional fractal dimension of time series of eye movements for (i) one or two targets revealed a significant main effect of figure (form) (F(2,12)=45.454, p<0.01) and range of display (F(2,12)=34.509, p<0.01). A figure (form) by range of display was also significant (F(4,24)=4.337, p<0.05). A similar two-way ANOVA conducted on the x-directional fractal dimension of time series of eye movements for (ii) four or five targets detected a significant main effect of figure (form) (F(2,12)= 40.864, p<0.01) and range of display (F(2,12)= 5.069, p<0.01). A figure (form) by range of display interaction was also significant (F(4,24)=3.457, p<0.05). A similar two-way ANOVA conducted on the x-directional fractal dimension of time series of eye movements for (iii) seven or eight targets revealed only a significant main effect of figure (form) (F(2,12)=36.903, p<0.01). A figure (form) by range of display interaction was also significant (F(4,24)=10.583, p<0.01).
A similar two-way ANOVA conducted on the y-directional fractal dimension of time series of eye movements for (i) one or two targets revealed only a significant main effect of figure (form) (F(2,12)=25.584, p<0.01). A figure (form) by range of display interaction was not significant. A similar two-way ANOVA conducted on the y-directional fractal dimension of time series of eye movements for (ii) four or five targets revealed only a significant main effect of figure (form) (F(2,12)=11.129, p<0.01). A figure (form) by range of display interaction was not significant. A similar two-way ANOVA conducted on the y-directional fractal dimension of time series of eye movements for (iii) seven or eight targets detected only a significant main effect of figure (form) (F(2,12)=20.504, p<0.01). A figure (form) by range of display interaction was also significant (F(4,24)=4.024, p<0.05).
Search Task 2 The search time is plotted as a function of LC (50, 100, 150, and 200bits) in Figure 15. The fractal dimension of time series of x-directional eye movement is compared among LC (50, 100, 150, and 200bits) in Figure 16. The fractal dimension of time series of y-directional eye movement is compared among LC in Figure 17.
10000
8000
6000
4000
Search time ms
2000
0
50 100 150 200 LC bit
Figure 15. Search time as a function of LC.
Figure available in the original PDF paper.
1.25
1.2
1.15
1.1
1.05
Fractal dimension
1
0.95
50 100 150 200 LC bit
Figure 16. Fractal dimension of x-direction eye movement as a function of LC.
Figure available in the original PDF paper.
1.25
1.2
1.15
1.1
1.05
Fractal dimension
1
0.95
50 100 150 200 LC bit
Figure 17. Fractal dimension of y-direction eye movement as a function of LC.
Figure available in the original PDF paper.
A one-way (LC) ANOVA conducted on the search time revealed a significant main effect of LC (F(3,21)=23.177, p<0.01). As a result of a similar one-way ANOVA carried out on the x-directional fractal dimension of time series of eye movements, a significant main effect of LC was detected (F(3,21)=12.441, p<0.01). A similar one-way ANOVA carried out on the y-directional fractal dimension of time series of eye movements detected a significant main effect of LC (F(3,21)=28.284, p<0.01).
DISCUSSION
Search Task 1 As shown in Figures 6, 9, and 12, the search time, as a whole, increased from the target 7 to the target 3, and from the target 3 to the target 8. The visual angle also affected the search time, and the search time tended to increase with the increase of the visual angle subtended by the display. It must be noted that the search time of the target 7 did not differ between the middle range and the wide range of visual angle when the number of targets was 7 or 8. Both the ease of discrimination and the number of targets must relax the effect of display range on the search time. The result must mean that the difficulty of search (detection) of the target increased according to the following order: 7, 3, and 8.
As shown in Figures 7, 10, and 13, the fractal dimension of time series of x-directional eye movements tended to be lower when the target 7 was used, and when the middle-range display was used. With the increase of search difficulty, the eye movements for the search activities must get more complicated, and led to the higher x-directional fractal dimension. The fractal dimension of time series of y-directional eye movements in Figures 8, 11, and 14 showed similar tendencies. Although Fairbanks and Taylor (2011) proposed a method for measuring the scaling properties of temporal and spatial patterns of eye movements, and calculated the fractal dimension for eye movements when viewing a variety of images, they did not systematically show how the search difficulty affected the fractal dimension like the experiment (search task 1, and search task 2) in this study.
For both x- and y-directional eye movements, it tended that the scaling property represented by the fractal dimension increased with the increase of difficulty of a search task. In such a way, it has been demonstrated that the fractal dimension provided us with some useful information and insight into human’s eye movement characteristics.
Search Task 2 As shown in Figure 15, the search time increased with the increase of task difficulty expressed by layout complexity LC. In accordance with this tendency, the x- and y-directional fractal dimensions increased with the increase of LC. As a result of exploring the relationship between the search time and the fractal dimension, it was also clarified that these two indices were not so strongly related. This result further supports the findings in the search task1.
General Discussion As mentioned above, it was clarified that the search time, the x-directional fractal dimension, and the y-directional fractal dimension tended to increase with the increase of search task difficulty such as the figure (form) of number to be searched for and the display range of a whole search matrix. Therefore, it was investigated how the search time was related to the x- and y-directional fractal dimension. An example of the results (relationship between search time and x-directional fractal dimension for (i) one or two targets) is shown in Figure 18. The result that the search time and the fractal dimension were not so strongly correlated (r2=0.404) must mean that the fractal dimension is variable based on different mechanism from the search time. The two fractal dimensions were strongly correlated (see Figure 18(b) (r2=0.789)). The variation behind the fractal dimension must be different from that of the search time. Therefore, the fractal dimension must be one of the important indices to get further insight into human’s eye movement.
Future research should examine the scaling properties of more practical visual activities such as Web search and conjunction search in order to generalize the scaling properties in eye movements. Future research should also apply chaotic analysis (Murata and Iwase, 1998, Murata and Iwase, 2001, Iwase and Murata, 2002 and Iwase and Murata, 2004) to a variety of eye movement data, and explore how chaotic properties change with the change of parameters related to search difficulty.
Fractal dimension (x -axis)
1
0 5000 10000 15000 20000 Search time ms
Fractal dimension (y -axis)
1
Fractal dimension (x -axis)
Figure 18. Relationships (a) between the search time and the x-directional fractal dimension, and relationship (b) between the x-directional and the y-directional fractal dimensions when the number of search targets is 1 or 2.
Figure available in the original PDF paper.
CONCLUSIONS
In both search tasks, it tended that the search time increased with the increase in task difficulty such as the display range, the form (figure) of numbers to be searched for, and the layout complexity. As a result of calculating the x- and y-directional fractal dimension for the time series of eye movement coordinates, for both x- and y-directional eye movements, it tended that the scaling property represented by the fractal dimension increased with the increase of the difficulty of a search task. The fractal dimension also tended to be smaller for the narrow display than for the wide display. As the search time and the x- and y-directional fractal dimensions were not so strongly related, the search time and the fractal dimension must be independently contributing to the variation of search time and the mechanism underlying a variety of search activities.
REFERENCES
Chekaluk, E. and Llewelly, K. R. (1992), “The Role of Eye Movements in Perceptual Process”, North-Holland. Fairbanks, M. S. and Taylor, R. P. (2011), “Measuring the Scaling Properties of Temporal and Spatial Patterns: From the Human Eye to Foraging Albatross”, in: Nonlinear Dynamical Systems Analysis for the Behavioral Science Using Real Data, Guastello, S. J. and Gregson, R. A. M (Ed.), pp.341-366. Findlay, J. M., Walker, R. and Kentridge, R.W. (1995), “Eye movement research: Mechanisms, processes and applications.
Studies in visual information processing”, Vol.6, Elsivier. Hung, G. K. (2001), “Models of Oculomotor Control”, World Scientific. Hyönä, J. Radach, R. and Deubel, H. (2003), “The Mind’s Eye: Cognitive and Applied Aspects of Eye Movement research”, North-Holland. Iwase, H. and Murata, A. (2002), “Chaotic Features of Rhythmic Joint Movement”, IEICE Transactions on Information and
Systems, Vol.E85-D, No.7, pp.1175-1179. Iwase, H. and Murata, A. (2004), “Chaotic analysis of focal accommodation and pupil area during the VDT work”, IEICE Transactions on Information and Systems, Vol.E87-D, No.9, pp.2258-2261. Land, M.F. and Tatler, B.W. (2009), “Looking and Acting -Vision and Eye Movements in Natural Behavior-”, Oxford University
Press. Murata, A. and Iwase, H. (1998), “Chaotic Analysis of Body Sway”, Proc. of 20th Annual International Conference -IEEE/EMBS, pp.1557-1560. Murata, A. and Iwase, H. (2001), “Application of Chaotic Dynamics in EEG to Assessment of Mental Workload”, IEICE Trans.
Inf. & Sys., Vol.84-D, No.8, pp.1112-1119. Murata, A. and Furukawa,N. (2005), “Relationship between Display Features, Eye Movement Characteristics, and Reaction Time in Visual Search”, Human Factors, Vol.47, No.3, pp.598-612. Nakano, Y. I., Conati, C. and Bader, T. (2013), “Eye Gaze in Intelligent User Interfaces”, Springer. Spence, R. and Witkowski, M. (2013), “Rapid Serial Visual Presentation -Design for Cognition-“, Springer. Tovée, M. J. (2008), “An Introduction to the Visual System”, Cambridge University Press. Underwood, G. (2005), “Cognitive Processes in Eye Guidance”, Oxford University Press. Wade, N. J. and Tatler, B. W. (2005), “The Moving Tablet of the Eye -The origins of modern eye movement research-“, Oxford
University Press. Wartburg, R.V. (2006), ”Eye Movements and Scene Perception -An Investigation of Basic Effects-“, Südwesteutscher Verlag für Hochschulschriften.
LISTED IN THE AHFE DIGITAL BOOKSTORE CATALOGUE
Explore the complete digital volume
Advances in Ergonomics In Design, Usability & Special Populations: Part II
Read this individual research paper free through the original publisher, or explore the full digital proceedings book.
ISBN 978-1-4951-2107-4
Explore this ISBN in the AHFE Bookstore ↗Listed in the July 2026 bookstore catalogue; search by ISBN to confirm current availability · Digital book purchase optional