Atsuo MURATA, Takashi KURODA, Michihiro KANBAYASHI (2022). Effectiveness of Auditory and Vibrotactile Cuing for Driver’s Enhanced Attention under Noisy Environment. In: Advances in Ergonomics In Design, Usability & Special Populations: Part II. AHFE Open Access, vol. 19. https://doi.org/10.54941/ahfe1001230
If the warning signal is presented via visual or auditory stimulus, the auditory or visual interference with other information might arise. On the other hand, if vibrotactile cue is used, such interference would be surely reduced. Therefore, it is expected that a vibrotactile signal would be very promising as a warning signal especially under noisy environment. In order to clarify the most suitable modality of cue (warning) to a visual hazard under noisy environment, the following two cues were used in the experiment: (1) auditory cue and (2) vibrotactile cue. The condition of SOA (Stimulus Onset Asynchrony) was set to 0s, 0.5s, and 1s. The noose level inside the experimental chamber was 60dB(A), 70dB(A), 80dB(A), and 90dB(A). It was hypothesized that vibrotactile cue under noisy environment is more effective for quickening the reaction to a hazard than auditory cue. As a result, it was verified that the vibrotactile warning got more and more effective with the increase of noise level. The reaction time to the auditory warning was remarkably affected by the noise level, while the reaction time to the vibrotactile warning was not affected by the noise level at all. Moreover, the SOA condition did not remarkably affect the reaction time to the auditory or the vibrotactile warnings.
As much of the information provided contains texts and images, drivers are apt to become distracted and inattentive. Driving a car places a characteristically heavy workload on visual perception, cognitive information processing, and manual responses. Drivers often simultaneously perform two or more tasks; for example, they adjust the volume of a radio or CD player and control the air conditioner to adjust the temperature while driving. Such sharing of attention may lead to dangerous situations. With the progress of by-wire and information technology, the visual and cognitive driving workload increases, and the driver-vehicle interaction is getting more and more complicated (Gkikas, 2013 and Castro, 2009). Consequently, drivers tend to be distracted by a variety of secondary task such as the operation of switches for CD or air conditioner other than driving (Regan et al., 2009), which increases the risk of inattentive driving.
The potential application of vibrotactile sense to the automotive warning system is paid more and more attention for enhancing driving safety (Jones and Sarter, 2008). Jones and Sarter (2008) reviewed the utilization of sense of touch as a medium for information representation. They concluded that sense of touch represents a promising means for communication in human-vehicle system.
Recently, the tendencies of cross-modal information processing and design (Spence and Driver, 2004 and Driver and Spence, 1998) have emerged as major research topics in the design of automotive warning system. Presenting information via multiple modalities such as vision, audition, and touch has been expected to be a promising means to reduce transmission errors and enhance safety. A better understanding of cross-modal spatial and temporal links is essential to ensure a better application of this property to the automotive warning design.
Ho et al. (2005), Ho and Spence (2008), Ho et al. (2006a), Ho et al. (2006b), Ho and Spence (2005) and Ho et al. (2006c), Murata et al. (2012a), Murata et al. (2012b), Murata et al. (2012c), Murata et al. (2013a) and Murata et al. (2013b) showed the effectiveness of vibrotactile warning presentation in driving environment. In driving situations, hazards exist ubiquitously. Ho et al. (2005), Ho and Spence (2008), Ho et al. (2006a), Ho et al. (2006b), Ho and Spence (2005) and Ho et al. (2006c) explored the effectiveness of vibrotactile warning for front and rear locations. Murata et al. (2012a) and Murata et al. (2012c) examined how the vibrotactile warning is effective for left and right locations. Moreover, Murata et al. (2012b) and Murata et al. (2013b) investigated the effectiveness of vibrotactile warning by apparent movement. They found that vibrotactile warning by apparent movement can more quickly transmit the directional cues than the simultaneous stimulation of two vibrotransducers or the single-point stimulation for some directions.
If the warning signal is presented via visual or auditory stimulus, the auditory or visual interference with other information might arise. On the other hand, if vibtotactile cue is used, such interference would be surely reduced. Therefore, it is expected that a vibrotactile signal would be very promising as a warning signal especially under noisy environment. However, the studies on the effectiveness of vibrotactile warning systems above (Ho et al., 2005, Ho and Spence, 2008, Ho et al., 2006a, Ho et al., 2006b, Ho and Spence, 2005, Ho et al., 2006c, Murata et al., 2012a, Murata et al., 2012b, Murata et al., 2012c, Murata et al., 2013a and Murata et al., 2013b) did not verify the effectiveness of vibrotactile cues under a high level of background auditory noise.
It was hypothesized that vibrotactile cue under noisy environment is more effective for quickening the reaction to a hazard than that of auditory warning. In other words, we assumed as follows. The auditory cue is affected by the background noise level, while the vibrotactile cue is not affected by the background noise level. In order to clarify the most suitable modality of cue (warning) to a visual hazard under noisy environment (high level of background auditory noise), the following two cues were used in the experiment: (1) auditory cue and (2) vibrotactile cue. The background noise level was changed from 60dB(A) to 90dB(A) every 10dB(A). The SOA (Stimulus Onset Asynchrony) was set to 0s, 0.5s, or 1s.
METHOD
Participants Ten healthy male aged from 21 to 24 years took part in the experiment. All had held a driver’s license for 3-4 years. The visual acuity of the participants in both young and older groups was matched and more than 20/20. They had no orthopedic or neurological diseases. All signed the informed consent after receiving a brief explanation on the aim and the contents of the experiment.
Apparatus The outline of experimental system is depicted in Figure 1. The vibrotactile stimulus and auditory stimulus were presented to the participant via a vibrotranceducer (Vp216) and a speaker shown in Figure 2. As shown in Figure 3, the cue was presented either tactically or via audition, and it was explored how the noise level affected the reaction to a visual target. In Figure 3, an example of driving simulator is also represented.
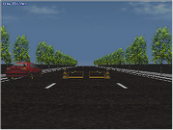
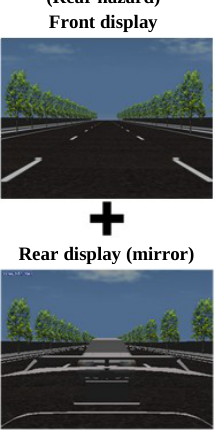
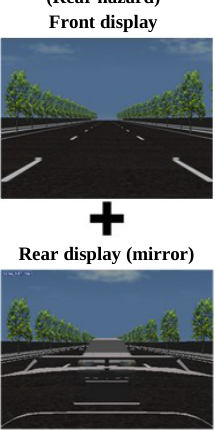
Task, Design, and Procedure Using a driving simulator system (Murata et al., 2012a, Murata et al., 2012b, Murata et al., 2012c, Murata et al., 2013a and Murata et al., 2013b), the participants were required to simultaneously carry out a simulated driving task (main task), maintain the velocity to 60km/h as possible as they can, and react to a hazard randomly presented on one of the two locations (front, or back mirror). In Figure 4, examples of the rear hazard (target that must be
4260mm
Four vibrotactile transduers are attached on the seat.
3060mm
Projector
465mm 325mm 1510mm 870mm Speaker for cue presentation
Back mirror
Projector 1180mm Screen Screen Monitor (Left side mirror) Speaker for cue presentation
Figure 1. Outline of experimental system.
Figure available in the original PDF paper.
Pure tone Vibration auditory vibroactile
Figure 2. Apparatus for auditory and tactile stimulus.
Figure available in the original PDF paper.
cue Noise auditory auditory
Visual target: hazard
Tactile Tactile Tactile
How does noise level affect the effectiveness of warning ?
Figure 3. Purpose of this study, cue type, and visual target.
responded by the participant) are shown. In the main driving simulator task, the participant was required to minimize the deviation from the predetermined line and keep the lane location using a steering wheel. In the reaction task to a hazard, the participant was required to react to a visual hazard using an accelerator or a steering switch as quickly and accurately as possible, and the reaction time was the measure for evaluating the effectiveness of cue modality under noisy environment.
In this task, the warning was presented to the participant 0s, 0.5s, or 1s before a visual hazard appeared to the front or the rear mirror using the following warning presentation method: (1) auditory cue and (2) vibrotactile cue. The auditory cue was presented to the participant via two speakers placed (70cm away from the participant) in front of and behind the participant. The vibrotactile cue was transmitted to the participant via four tactors (vibrotransducers) placed on the sitting surface so that these tactors contacted the left and the right thigh. The cue to the front target was
(Rear hazard) Front display
Rear display (mirror)
Figure 4. An example of the rear hazard.
Cue (warning): visual, auditory, or tactile
t Target (hazard)
Figure 5. Flow from the cue presentation to reaction to the target.
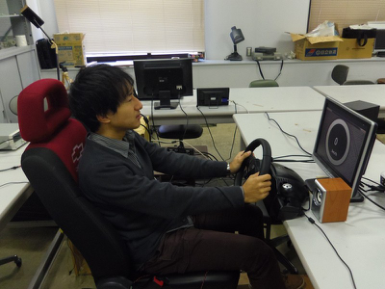
presented via two tactors placed on the front part (one was on the left thigh, and another was on the right thigh). The cue to the rear target was presented via two tactors placed on the rear part (one was on the left thigh, and another was on the right thigh). The flow from the cue presentation to the reaction is summarized in Figure 5. The noise was presented to the participant with a pure tone of 4 kHz, the sound pressure level of which changed from 60dB(A) to 90 dB (A) every 10dB(A). An experimental scene and overviews of laboratory are shown in Figure 6(a)-(c).
The experimental conditions included the modality of cue ((1)-(2)) and the noise level (60dB(A), 70dB(A), 80 dB(A), and 90dB(A)). The SOA was also an experimental variable (0s, 0.5s, and 1s). All of these three experimental variables were within-subject factors.
RESULTS
For each SOA condition, a two-way (modality of warning by noise level) ANOVA (Analysis of Variance) was carried out for the reaction time. When SOA equaled 0s, the following main effect and interaction were found to be statistically significant: modality of warning (F(1,9)=19.290, p<0.01), noise level (F(3,27)=11.885, p<0.01), and modality of warning by noise level interaction (F(3,27)=14.715, p<0.01). The following significant differences were obtained in case of SOA of 0.5s: modality of warning (F(1, 9)=17.066, p<0.01), noise level (F(3,27)=7.023, p<0.01), and modality of warning by noise level interaction (F(3,27)=10.665, p<0.01). For SOA of 1s, the following significant differences were detected: modality of warning (F(1,9)=22.235, p<0.01), noise level (F(3,27)=6.503, p<0.01), and modality of warning by noise level interaction (F(3,27)=11.034, p<0.01). Fisher’s PLSD (Protected
(a)
(b)
(c)
Figure 6. Photo of experimental setup (a)-(b) and experiment.
Least Significant Difference) test revealed the following significant differences. SOA(0s): (60dB(A), 80dB(A)), (60dB(A), 90dB(A)), (70dB(A), 80dB(A)), (70dB(A), 90dB(A)). SOA(0.5s): (60dB(A), 80dB(A)), (60dB(A), 90dB(A)), (70dB(A), 90dB(A)). SOA(1s): (60dB(A), 80dB(A)), (60dB(A), 90dB(A)), (70dB(A), 90dB(A)).
Figure 7 shows the reaction time to the target as a function of noise level and SOA for the auditory warning (cue). In Figure 8, the reaction time to the target for the vibrotactile warning (cue) is plotted as a function of noise level and SOA. In Figure 9, the reaction to the target is plotted as a function of noise level and warning modality when SOA equals 0s. Figure 10 shows the reaction to the target as a function of noise level and warning modality when SOA equals 0.5s. Figure 11 compares the reaction time to the target among noise levels and between cue (warning) modalities for SOA of 1s.
1400
1200
1000
800
600
400
Reaction time ms
SOA: 0s SOA: 0.5s SOA: 1s
200
0
60 70 80 90 Noise level dB(A)
Figure 7. Reaction time as a function of SOA and noise level (auditory cue).
Figure available in the original PDF paper.
1400
1200
1000
800
600
400
Reaction time ms
SOA: 0s SOA: 0.5s SOA: 1s
200
0
60 70 80 90 Noise level dB(A)
Figure 8. Reaction time as a function of SOA and noise level (vibrotactile cue).
Figure available in the original PDF paper.
1400
1200
1000
800
600
SOA: 0s
400
Auditory Tactile
Reaction time ms
200
0
60 70 80 90 Noise level dB(A)
Figure 9. Reaction time as a function of noise level and cue (warning) modality (SOA:0s).
Figure available in the original PDF paper.
1400
1200
1000
800
600
SOA: 0.5s
400
Auditory Tactile
Reaction time ms
200
0
60 70 80 90 Noise level dB(A)
Figure 10. Reaction time as a function of noise level and cue (warning) modality (SOA:0.5s).
Figure available in the original PDF paper.
1200 1400
800 1000
400 600
SOA: 1s
Auditory Tactile
Reaction time ms
0 200
60 70 80 90 Noise level dB(A)
Figure 11. Reaction time as a function of noise level and cue (warning) modality (SOA:1s).
Figure available in the original PDF paper.
DISCUSSION
As for the auditory modality, the reaction time to the target was clearly affected by the noise level (see Figure 7). For all of three SOA conditions, the reaction time tended to increase with the increase of noise level. The SOA condition of 0s led to prolonged reaction to the target as compared with the SOA conditions of 0.5s and 1s.
On the other hand, as shown in Figure 8, the vibrotactile cue was not affected by the noise level. This must indicate that the vibrotactile cue is effective even under very noisy environment equal to or more than 70dB(A). As well as the results of the auditory cue, the SOA of 0s tended to be longer than those of SOAs of 0.5s and 1s. As shown in Figures 7 and 8, the reaction time did not differ between SOA conditions of 0.5 s and 1s. These common results for both auditory and vibrotactile cues suggest that SOA of 0s is not proper as a condition of warning presentation. The presentation of cue in advance until the vehicle encounters the hazard or danger must be more desirable.
The reaction to the hazard via auditory or vibrotactile cue was faster than that via a visual cue (Ho et al., 2005, Ho and Spence, 2008, Ho et al., 2006a, Ho et al., 2006b, Ho and Spence, 2005 and Ho et al., 2006c) . Moreover, as pointed out by Ho et al. (2005), Ho and Spence (2008), Ho et al. (2006a), Ho et al. (2006b), Ho and Spence (2005) and Ho et al. (2006c), the reaction to the hazard via auditory cue was faster than that via vibrotactile cue. They suggested that drivers can respond more rapidly to visual targets following the presentation of an auditory warning signal than following the presentation of a vibrotactile warning signal. In these experiment, the cue that indicates the
75
(A) real-world running
70
65
60
Frequency Hz
55
Ascending Descending Mean
50
Front left Front right Rear left Rear right Front (2 tactors)
Left (2 tactors)
Right (2 tactors)
Rear (2 tactors)
Location of tactor
75
(B) laboratory
70
65
60
Frequency Hz
Ascending Descending Mean
55
50
Front left Front right Rear left Rear right Front (2 tactors)
Left (2 tactors)
Right (2 tactors)
Rear (2 tactors)
Location of tactor
Figure 12. Sensitivity of tactor at eight sites compared between (A)real-world running and
Figure available in the original PDF paper.
(B)laboratory.
appearance of the target was not necessarily valid. When the cue was completely valid, Ho et al. (2005) showed that the vibrotactile warning signal promoted a rapid response to the target. However, Ho et al. (2005), Ho and Spence (2008), Ho et al. (2006a), Ho et al. (2006b), Ho and Spence (2005) and Ho et al. (2006c) and Murata et al. (2012a), Murata et al. (2012b), Murata et al. (2012c), Murata et al. (2013a) and Murata et al. (2013b) did not examine the effect of surrounding noise level on the reaction to the target cued by auditory modality. Under the nosy surrounding condition equal to or more than 70dB(A), the vibrotactile cue is more effective than the auditory cue. In such a way, we showed the advantage of vibrotactile cues that vibrotactile cues are not affected by the level of background auditory noise in driving environment.
As shown in Figures 9-11, the reaction time of both auditory and vibrotactile modalities was nearly the same when the noise level was 60dB(A). The vibrotactile cue was more effective with the increase of noise level. Future research should explore the effectiveness of multisensory cuing (warning), or examine the effect of time interval between a cue and a target (hazard) appearance on the effectiveness of cue modality.
When the visual workload during driving is overloaded and the background auditory noise level is high, the use of non-visual or non-auditory warning, that is, vibrotactile warning makes driver to respond to the target (hazard or danger) more quickly. Physiological studies clarify that we can accurately localize vibrotactile stimuli presented at up to twelve different sites on our abdomen, and that vibrotactile stimulation is by far more effective than auditory directional cues. Fitch et al. (2007) have shown that drivers can rapidly discriminate up to eight directions by vibrotactile stimulation. These past studies are also indicative of the promising and practical use of vibrotactile warning as a warning presentation.
It is not certain whether the vibrotactile warning is effective under the real-world running environment. Therefore, the sensitivity to the vibrotactile warning (cue) was investigated, and compared between the real-world running and the laboratory experiment. A part of the results is shown in Figure 12(a) and (b). The sensitivity of the tactor did not change even under the real-world running environment, which means that the vibrotactile warning is usable under a real-world running environment.
The nature of cross-modal links in spatial attention demonstrates that responses to a target presented in one sensory modality can be facilitated by the prior presentation of a cue (warning) by another sensory modality (Spence and Driver, 2004). On the basis of the results, it is expected that a vibrotactile warning would be very promising as a warning signal especially under noisy environment.
Finally, we discuss the risk compensation phenomenon that appears with the development of such a preventive safety system. The preventive safety by means of an automotive warning system is desirable under a condition where the driver’s workload is high, thus having limited resources left to analyze the situation before reacting to it. However, it must be noted that such a system is not necessarily beneficial and may have negative effects if risk is undermined. We must give plenty of thoughts whether drivers really drive safely when safety warning systems are equipped with a vehicle. As a result of analyzing the behavior of drivers of a vehicle with safety features such as seat belts and air bags, these drivers tended to drive more aggressively (Wilde, 1982, Evans, 1982 and Evans, 1991). Such behaviors can be explained by the theory of risk homeostasis (Wilde, 1982). Such an adverse effect to new preventive safety technologies must be borne in mind.
CONCLUSIONS
In order to clarify the most suitable modality of cue (warning) to a visual hazard under noisy environment, the effects of the following three conditions on the reaction to the target (hazard) were examined: (1) cue modality (auditory or vibrotactile cue), (2) SOA (0s, 0.5s, and 1s), and (3) noose level inside the experimental chamber (60dB(A), 70dB(A), 80dB(A), and 90dB(A)). We hypothesized that vibrotactile cue under noisy environment is more effective for quickening the reaction to a hazard than that of auditory warning.
It was verified that the vibrotactile warning got more and more effective with the increase of noise level. The reaction time to the auditory warning was remarkably affected by the noise level, while the reaction time to the vibrotactile warning was not affected by the noise level at all. The SOA condition did not remarkably affect the reaction time to the auditory or the vibrotactile warnings. On the basis of the results, it is expected that a vibrotactile warning would be very promising as a warning signal especially under noisy environment.
Future research should explore the effectiveness of vibrotactile warning under the real-world running environment. The effectiveness of simultaneous presentation of both auditory and vibrotactile cues is suggested in recent studies (for example, Ho et al. (2005)). Future research should carry out a comparative study of effectiveness between vibrotactile warning and auditory-vibrotactile warning. Although the warning to the front or rear hazard was treated in this study, future research should explore the effectiveness of non-visual cues when drivers are provided with not less that four directions.
REFERENCES
Castro, C. (2009), “Human Factors of Visual and Cognitive Performance in Driving”, CRC Press. Driver, J. and Spence, C. (1998), “Attention and the cross-modal construction of space”, Trends in Cognitive Science, Vol.2, pp.254-262. Evans, L. and Graham, J. D. (1991), “Risk reduction or risk compensation? The case of mandatory safety-belt use law”, Journal
of Risk and Uncertainty, Vol.4, pp.61-73. Evans, L., Wasielewski, P. and von Buseck, C. R. (1982), “Compulsory seat belt usage and driver risk-taking behavior”, Human Factors, Vol.24, pp.41-48. Fitch, G., Kiefer, R. J., Hankey, J. M., and Kleiner, B. M. (2007), “Toward developing an approach for alerting drivers to the
direction of a crash threat”, Human Factors, Vol.49, pp.710-720. Gkikas, N. (2013), “Automotive Ergonomics-Driver-Vehicle Interaction”, CRC Press. Ho, C., Reed, N. and Spence, C. (2006a), “Assessing the effectiveness of “intuitive” vibrotactile warning signals in preventing front-to-rear collisions in a driving simulator”, Accident Analysis and Prevention, Vol.38, pp.989-996. Ho, C., Reed, N. and Spence, C. (2006b), “Multisensory in-car warning signals for collision avoidance”, Human Factors, Vol.49,
pp.1107-1114. Ho, C. and Spence, C. (2005), “Assessing the effectiveness of various auditory cues in capturing a driver’s visual attention”, Journal of Experimental Psychology: Applied, Vol.11, pp.157-174. Ho, C. and Spence, C. (2008), “The Multisensory Driver-Implications for Ergonomic Car Interface Design-“, Ashgate. Ho, C., Tan, H. Z. and Spence, C. (2005), “Using spatial vibrotactile cues to direct visual attention in driving scenes”,
Transportation Research, Part F, Vol.8, pp.397-412. Ho, C., Tan, H. Z. and Spence, C. (2006c), “The differential effect of vibrotactile and auditory cues on visual spatial attention”, Ergonomics, Vol.49, pp.724-738. Jones, L.A. and Sarter, N.B. (2008), “Tactile displays:Guidance for their design and application”, Human Factors, Vol.50,
pp.90-111. Murata, A., Kanbayashi, M., and Hayami, T. (2012a), “Effectiveness of Automotive Warning System presented with Multiple Sensory Modalities”, Proceedings of SICE2012, pp.920-925. Murata, A., Kanbayashi, M. and Hayami, T. (2013a), “Effectiveness of Automotive Warning System Presented with Multiple
Sensory Modalities”, Proceedings of HCI2013, Vol.22, pp.I88-I97. Murata, A., Kemori, S., Hayami, T. and Moriwaka, M. (2012b), “Basic Study on Automotive Warning Presentation to Front/Rear Hazard by Vibrotactile Stimulation”, Proceedings of AHFE2012, pp.421-430. Murata, A., Kemori, S., Moriwaka, M. and Hayami, T. (2013b), “Proposal of Automotive 8-directional Warning System That
Makes Use of Tactile Apparent Movement”, Proceedings of HCI2013, Vol.22, pp.I98-I107. Murata, A., Nakagawa, Y., and Hayami, T. (2012c), “Effectiveness of Warning Presentation with Directional Cue that Makes Use of Cross-Modal Link”, Proceedings of SICE2012, pp.1379-1384. Regan, M.A., Lee, J.D. and Young, K.L. (2009), “Driver Distraction-Theory, Effects, and Mitigation-“, CRC Press. Spence, C. and Driver, J. (2004), “Crossmodal space and crossmodal attention”, Oxford University Press. Wilde, G. J. S. (1982), “The theory of risk homeostasis: Implications for safety and health”, Risk Analysis, Vol.2, pp.209-225.
LISTED IN THE AHFE DIGITAL BOOKSTORE CATALOGUE
Explore the complete digital volume
Advances in Ergonomics In Design, Usability & Special Populations: Part II
Read this individual research paper free through the original publisher, or explore the full digital proceedings book.
ISBN 978-1-4951-2107-4
Explore this ISBN in the AHFE Bookstore ↗Listed in the July 2026 bookstore catalogue; search by ISBN to confirm current availability · Digital book purchase optional