Atsuo MURATA, Kohei FUKUDA, Taiga KORIYAMA (2019). An Attempt to Predict Point in Time with High Risk of Accident by Trend Analysis-Method for Detecting Significant Trend of Change of Behavioral Measures-. In: Advances in Safety Management and Human Factors. AHFE Open Access, vol. 5. https://doi.org/10.54941/ahfe100153
Publisher statistics will load when you open Metrics.
AHFE OPEN ACCESS OPEN ACCESS CONFERENCE PROCEEDINGS PAPER
An Attempt to Predict Point in Time with High Risk of Accident by Trend Analysis-Method for Detecting Significant Trend of Change of Behavioral Measures-
From the practical viewpoint, only behavioral measures (in this study, eight behavioral measures) were used for drowsiness prediction. A variety of baseline of drowsiness (arousal state) was used in this study. More concretely, each behavioral measure was used as the base line of drowsiness (arousal state) as well as the self-reported evaluation of drowsiness, and thus we made an attempt to predict the participant’s drowsiness for each base line. Trend analysis of each evaluation measure was carried out by using a single regression model where time and base line of drowsiness (one of evaluation measures) corresponded to an independent variable and a dependent variable, respectively. Using the result of trend analysis, we proposed a new approach to predict the point in time (we call this the point in time of virtual accident) when the participant would have encountered a crucial accident if he was driving a car. On the basis of results of all participants, the proposed approach could identify the point in time of virtual accident, and was promising for identifying and predicting the time zone with potentially high risk (probability) of inducing an accident due to drowsy driving in advance, and for warning drivers of such a state.
To prevent drivers from driving under drowsy state and causing a disastrous traffic accident, not the gross tendency of reduced arousal level but the more accurate identification of timing when the drowsy state occurs is necessary. It is not until such accurate measures to predict the timing of occurrence of drowsy driving is established that we apply this to the development of ITS (Intelligent Transportation System) which can surely and reliably avoid unsafe and unintentional driving under drowsy and low arousal state.
Many studies used psychophysiological measures such as blink, EEG, saccade, and heart rate to assess fatigue (Brookhuis and Waard, 1993, Kecklund and Akersted, 1993 and Skipper and Wierwillie, 1986). Kecklund and Akersted (1993) recorded EEG continuously during a night or evening drive for eighteen truck drivers. They showed that during a night drive a significant intra-individual correlation was observed between subjective sleepiness and the EEG alpha burst activity. As a result of a regression analysis, total work hours and total break time predicted about 66% of the variance of EEG alpha burst activity during the end of drive. Skipper and Wierwillie (1986) made an attempt to detect drowsiness of driver using discrimination analysis, and showed that the false alarm or miss would occur frequently in such an attempt.
Murata and Hiramatsu (2008), Murata and Nishijima (2008), Murata et al. (2011a), Murata et al. (2011b), Murata et al. (2012), Murata et al. (2013a), Murata et al. (2013b) and Murata et al. (2013c) made an attempt to predict drivers’ drowsiness using physiological (EEG, heart rate variability (RRV3), and blink frequency) and behavioral (neck vending angle (horizontal and vertical), back pressure, foot pressure, COP on sitting surface, frequency of body movement, tracking error in driving simulator task, and standard deviation of quantity of pedal operation) evaluation measures. Here, the drowsiness is represented by the psychological evaluation of drowsiness using a 3-point scale (arousal, 2: a little drowsy, 3: very drowsy). In other words, an attempt was made to predict the drowsiness on the basis of the relationship between subjective drowsiness (sleepiness) and the physiological or behavioral evaluation measures.
There exist two problems in such an approach. One is that using physiological measures is not practical due to expensive price of their measurement apparatus. Another problem is related to the validity and rationale of using the self-reported (psychological) evaluation of arousal level as a base line of arousal level. Moreover, using the self- reported (psychological) evaluation of arousal level as a base line is also not desirable from the practical viewpoint.
Therefore, from the practical viewpoint, only behavioral measures (in this study, eight behavioral measures) were used for the drowsiness prediction. A variety of baselines of drowsiness (arousal state) were used in this study. More concretely, each behavioral measure was used as the base line of drowsiness (arousal state). Different from Murata et al. (2011b), Murata et al. (2012), Murata et al. (2013a), Murata et al. (2013b) and Murata et al. (2013c), the self- reported evaluation of drowsiness was not used as a baseline of drowsiness in our proposed approach for predicting drowsiness, although the self-reported evaluation of drowsiness was also used as a reference for evaluating drowsiness.
We made an attempt to predict the participant’s drowsiness for each base line. The trend analysis of each evaluation measure (tracking error in simulated driving task, foot pressure, back pressure, neck bending angle (horizontal), neck bending angle (vertical), and COP (Center of Pressure) on sitting surface) was carried out by using a single regression model where time and base line of drowsiness (one of evaluation) corresponded to an independent variable and a dependent variable, respectively. Using the result of trend analysis, we proposed a new approach to predict the point in time (we call this the point in time of virtual accident) when the participant would have encountered a crucial accident if he was driving a car. Finally, analyzing the process until we judged that it is not valid (proper) to keep the participant continuing the simulated driving task, the effectiveness of the proposed method was verified.
METHOD
Participant Eight healthy male students from 21 to 23 years old participated in the experiment. All signed the document on informed consent after receiving a brief explanation on the experiment. The visual acuity of the participants in both young and older groups was matched and more than 20/20. They had no orthopedic or neurological diseases. They were required to stay up all night and visit the laboratory. Under such a physical condition of the participant, the following experiment was carried out.
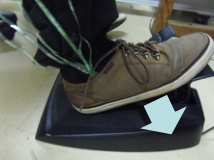
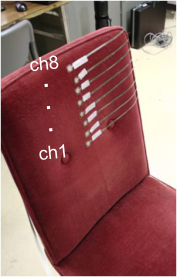
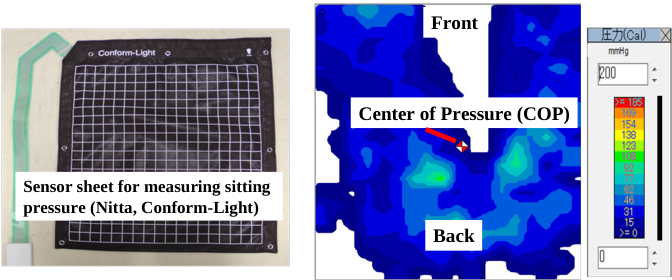
Apparatus The outline of experimental system is summarized in Figure 1. Pressure sensors (OctSense, Nitta) were attached to the shoes insole for measuring foot pressure. Pressure sensor (OctSense, Nitta) was attached to the backrest of the driving seat for measuring back pressure (see Figures 2 and 3). Goniometers (DKH) were attached to the back of neck to measure the bend angle of neck. A measurement system of sitting pressure distribution (Nitta, Conform- Light) was placed on a driver’s seat (see Figure 4).
PC for sitting pressure measurement (Comfolight)
Neck bending angle
PC Participant PC for back and foot Pressure measurement (Octsense)
PC PC
Power Lab Bioamp
PC for tracking task
PC PC Steering
Switch PC
PC for biological measurement Projector for simulated driving task
Figure 1. Outline of experimental system.
Figure available in the original PDF paper.
Back pressure
Foot pressure induced during pedal operation Examination of relationship between drowsiness and behavioral characteristics of driver judged from foot pressure and back pressure.
Practically usable for predicting drowsiness of drivers ?
Figure 2. Foot (left) and back (right) pressure measurement.
ch8 ・
・ ・
・ ch1
Measurement of back pressure Measurement of foot pressure
Figure 3. Setup for back (left) and foot (right) pressure measurement.
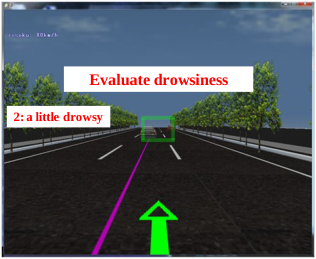
Task The participants sat on a seat, and were required to carry out a simulated driving task. For both conditions (high and low arousal conditions), the participants were required to carry out a simulated driving task. The display of the driving simulator is depicted in Figure 5. The participants were required to steer a steering wheel and keep their
Front
High pressure
Center of Pressure (COP)
Sensor sheet for measuring sitting pressure (Nitta, Conform-Light)
Back
Low pressure Pressure distribution on sensor sheet
Figure 4. Apparatus for sitting pressure and COP measurements.
1:arousal 2:a little drowsy 3:very drowsy
Evaluate drowsiness 2: a little drowsy
1 2
3
Button to be used for drowsiness evaluation
Figure 5. Display for simulated driving task and switches around steering wheel for evaluating subjective drowsiness.
vehicle to the center line (purple color) as much as they can. The psychological rating included the following three categories: 1: arousal, 2: a little drowsy, 3: very drowsy. The participant was required to evaluate his drowsiness using the switches 1-3 in Figure 3 every one minute.
Procedure As for behavioral measures, neck vending angle (horizontal and vertical), back pressure, foot pressure, COP on sitting surface, frequency of body movement, and tracking error in driving simulator task were measured. The neck bending angle was sampled with the sampling frequency of 1kHz. The foot pressure, the back pressure, and COP on sitting surface were sampled with the sampling frequency of 2Hz. The quantity of pedal operation and the tracking error were measured every one second (sampling frequency of 1Hz).
Behavioral measures above were recorded while performing a simulated driving task for (at most) one hour. Applying these measures to the trend analysis model below, it was explored if we can predict accurately and properly the point in time when the participant would have encountered a crucial accident if he was driving a car. By analyzing the process until we judged that it is not proper to keep the participant continuing the simulated driving task, we made an attempt to verify the effectiveness of the proposed method (trend analysis approach).
RESULTS
In Figure 6, time series of tracking error and subjective rating on drowsiness are plotted. Figure 7 plotted time series of difference of foot pressure. In Figure 8, time series of vertical bending angle is shown. Time series of COP movement is demonstrated in Figure 9. Figure 10 shows time series of difference of back pressure. Figure 11 plots time series of horizontal bending angle.
Virtual accident: Point in time with high probability of potential danger of accident
4
6
5
Participant: YU
3
4
3
2
2
Tracking error m
Subjective rating
1
0
1
10 510 1010 1510 2010 2510 3010 3510
Time s
Figure 6. Time series of tracking error and subjective rating on drowsiness (Participant: YU). Downward arrow shows the point in time with high probability of potential danger of accident.
Figure available in the original PDF paper.
Virtual accident: Point in time with high probability of potential danger of accident
2.5
Participant: YU
2
1.5
1
pressure kPa
Different of foot
0.5
0
10 510 1010 1510 2010 2510 3010 3510
Time s
Figure 7. Time series of difference of foot pressure (Participant: YU). Downward arrow shows the point in time with high probability of potential danger of accident.
Figure available in the original PDF paper.
Here, downward arrow in Figures 6-11 shows the point in time with high probability of potential danger of accident. We will call this point in time of virtual accident. From Figure 6, it is clear that tracking error increased with the elapse of time. The change of subjective rating on drowsiness is also plotted in Figure 6. The rating 4 corresponds to the case where no switch was pressed. Towards the point in time of virtual accident, the tracking error gradually increased. Similarly, the difference of back pressure (Figure 10), the vertical neck bending angle (Figure 8), and the horizontal neck bending angle (Figure 11) tended to increase towards the point in time of virtual accident. The difference of foot pressure (Figure 7) tended to decrease towards the point in time of virtual accident. As for the COP movement (Figure 9), no definite tendency was observed.
Although the tendencies of change of the behavioral measures over time were approximately identified like Figures 6-11, these are not enough to identify the symptoms of drowsy and dangerous driving situation and predict the point in time of virtual accident. Some systematic method for identifying the symptoms of drowsy and dangerous driving situation more clearly and automatically is necessary. Therefore, the trend analysis method (for example, Montgomery, 2005) to predict the point in time of virtual accident is discussed below.
TREND ANALYSIS In Figure 12, the approach for detecting significant trends (increase or decrease) and warning drowsy driving is summarized. In Figure 12, the original time series are entered into a 5-point moving average algorithm. The interval
Virtual accident: Point in time with high probability of potential danger of accident
70
Participant: YU
60
50
40
30
20
10
Vertical neck bending angle deg
0
10 510 1010 1510 2010 2510 3010 3510
Time s
Figure 8. Time series of vertical bending angle (Participant: YU). Downward arrow shows the point in time with high probability of potential danger of accident.
Figure available in the original PDF paper.
Virtual accident: Point in time with high probability of potential danger of accident
120
100
Participant: YU
80
60
40
COP movement cm
20
0
10 510 1010 1510 2010 2510 3010 3510
Time s
Figure 9. Time series of COP movement (Participant: YU). Downward arrow shows the point in time with high probability of potential danger of accident.
Figure available in the original PDF paper.
Virtual accident: Point in time with high probability of potential danger of accident
0.9
0.8
Participant: YU
0.7
0.6
0.5
0.4
0.3
pressure kPa
Defference of back
0.2
0.1
0
10 510 1010 1510 2010 2510 3010 3510
Time s
Figure 10. Time series of difference of back pressure (Participant: YU). Downward arrow shows the point in time with high probability of potential danger of accident.
Figure available in the original PDF paper.
Virtual accident: Point in time with high probability of potential danger of accident
70
60
Participant: YU
50
40
30
20
10
Horizontal neck bending angle deg
0
10 510 1010 1510 2010 2510 3010 3510
Time s
Figure 11. Time series of horizontal bending angle (Participant: YU). Downward arrow shows the point in time with high probability of potential danger of accident.
Figure available in the original PDF paper.
T54 T54
Participant: TE ................. ................. T53 T1 T53 T1
T0 T0
Tracking error
Tracking error
0 0.1 0.2 0.3 0.4 0.5 0.6 0.7 0.8
0 0.1 0.2 0.3 0.4 0.5 0.6 0.7 0.8
60 120 180 240 300 360 420 480 540 600 660 720 780 time s
60 120 180 240 300 360 420 480 540 600 660 720 780 time s
Similar analysis for other evaluation measure Trend analysis for each interval T0, T1, ………. , T53, T54
Careful observation of significant increase or decrease trend
Warning of dangerous and drowsy driving
Figure 12. Proposed approach for detecting significant trends (increase or decrease) and warning drowsy driving.
Figure available in the original PDF paper.
for the trend analysis is fixed to 4 minutes. The behavioral measures were calculated every 10s. A total of 24 data were used for the trend analysis per one interval. The interval was moved forward by 10s like Figure 12. In this figure, a total of 55 intervals (T0, T1,….., T53, T54) were used for trend analysis, and the judgment of trend was conducted for each interval. Careful observation of trend (increase or decrease) of each evaluation measure must be continued until the symptom of virtual accident is certainly extracted.
Figure 13 is an example of such a trend analysis of tracking error for the predetermined interval. Downward arrow shows the point in time with high probability of potential danger of accident. Significant trends of increase were detected for the intervals ① and ②. As for the intervals ③ and ④, no significant trend of increase or decrease was detected. A significant trend of increase was again detected for the interval ⑤. In such a way, the trend analysis is conducted for all intervals and for all measures.
Figure 14 shows an example of trend analysis of COP movement, and resulting graphic summary of significant or non-significant trends for the whole analysis interval T0, T1,….., T214, T215 (Participant: MK). Downward arrow shows the point in time with high probability of potential danger of accident. Until the point in time of virtual accident, there existed a lot of significant increasing trends of COP movement. Such a trend can be used for the synthetic judgment of drowsiness.
Interval ④ Interval ③
Tracking error
60 120 180 240 300 360 420 480 540 600 660 720 780 time s
0.5
0.5
0.4
0.4
Interval ③ Interval ④
0.3
0.3
0.2
0.2
(No trend) (No trend)
Tracking error
Tracking error
0.1
0.1
0
0
240 300 360 420 480
300 360 420 480 540
time s time s
Figure 13. An example of trend analysis of tracking error for the predetermined interval. Significant trend of increase were detected for intervals ① and ②. Significant trend of increase were detected for intervals ③ and ④. Downward arrow shows the point in time with high probability of potential danger of accident.
Figure available in the original PDF paper.
DISCUSSION
Figure 15 shows the result of trend analysis of tracking error, and resulting graphic summary of significant or non- significant trends for the whole analysis interval (Participant: YT). Figure 16 shows the trend analysis of horizontal bending angle, and resulting graphic summary of significant or non-significant trends for the whole analysis interval (Participant: YU). Figure 19 shows the trend analysis of vertical bending angle and resulting graphic summary of significant or non-significant trends for the whole analysis interval (Participant: YU). Figure 18 shows the trend
Interval ⑤
Interval ⑤
Tracking
Tracking error
0 0.1 0.2 0.3 0.4 0.5 0.6 0.7 0.8
0 0.1 0.2 0.3 0.4 0.5 0.6 0.7 0.8
60 120 180 240 300 360 420 480 540 600 660 720 780 time s
60 120 180 240 300 360 420 480 540 600 660 720 780 time s
0.5
0.4
Interval ⑤ (Significant increase)
0.3
0.2
Tracking error
0.1
0
time s
Figure 13. An example of trend analysis of tracking error for the predetermined interval. Significant trend of increase were detected for interval ⑤ (continued-1-).
Figure available in the original PDF paper.
Figure 14. An example of trend analysis of COP movement, and resulting graphic summary of significant or non-significant trends for the whole analysis interval (Participant: MK). Downward arrow shows the point in time with high probability of potential danger of accident.
Figure available in the original PDF paper.
analysis of back pressure and resulting graphic summary of significant or non-significant trends for the whole analysis interval (Participant: YU). These figures show that the significant increase trend occurs in a row before the point in time of virtual accident for the tracking error, the horizontal and the vertical neck bending angles, and the back pressure. Such a trend analysis makes us easier to understand the trend of change of these evaluation measures than time series shown in Figures 6-11, which means that the point in time of virtual accident can be predicted by making use of the lower graphs in Figures 15-19.
Figure 15. Trend analysis of tracking error, and resulting graphic summary of significant or non- significant trends for the whole analysis interval (Participant: YT). Downward arrow shows the point in time with high probability of potential danger of accident.
Figure available in the original PDF paper.
40
Participant: YU
30
20
10
Horizontal neck vending angle deg
0
60 240 420 600 780 960 1140 1320 1500 1680 time s
1
0
0 20 40 60 80 100 120 140
T40 T0 T20 T60 T80 T100 T120 T140 -1
Figure 16. Trend analysis of horizontal bending angle, and resulting graphic summary of significant or non-significant trends for the whole analysis interval (Participant: YU). Downward arrow shows the point in time with high probability of potential danger of accident.
Figure available in the original PDF paper.
Figure 17. Trend analysis of foot pressure, and resulting graphic summary of significant or non- significant trends for the whole analysis interval (Participant: TE). Downward arrow shows the point in time with high probability of potential danger of accident.
Figure available in the original PDF paper.
Figure 18. Trend analysis of back pressure, and resulting graphic summary of significant or non- significant trends for the whole analysis interval (Participant: YU). Downward arrow shows the point in time with high probability of potential danger of accident.
Figure available in the original PDF paper.
40
Participant: TK
30
20
10
Vertical neck bending angle deg
0
60 120 180 240 300 360 420 480 540 600 660 720 780 840 time s
1
0
0 10 20 30 40 50
T40 T0 T20 T30 T10 T50 -1
Figure 19. Trend analysis of vertical bending angle and resulting graphic summary of significant or
Figure available in the original PDF paper.
non-significant trends for the whole analysis interval (Participant: YU). Downward arrow shows the point in time with high probability of potential danger of accident.
Figure 17 shows the trend analysis of foot pressure and resulting graphic summary of significant or non-significant trends for the whole analysis interval (Participant: TE). The result that the significant decrease trend occurred in a row before the point in time of virtual accident suggests that such a trend analysis is effectively used for the identification of the point in time when it is definitely and firmly judged that the participant is about to reach inactive driving state and under a high risk of crucial traffic accident.
The following judgment of occurrence of virtual accident would be recommended. (i) Assume that x is the number that significant increase or decrease continues consecutively. (ii) Also assume that y is the number of evaluation measure for predicting the point in time the participant is about to reach inactive driving state and under a high risk of crucial traffic accident. (iii) By setting a value to x, and determining the number of evaluation measures y, we judge that the warning should be provided with the driver, and the warning by dint of noisy sound, strong vibration, intense flash light, or intense odor (smell) is actually represented to the driver. (iv) If such a situation continues z times in a row, or v times out of w, the vehicle should be forced to stop running.
The numbers x, y, z, v, and w must be determined empirically. Future research should explore how these parameters x, y, z, v, and w should be.
In this study, the interval used for identifying the trend was fixed to 4 minute (one data/10s). Future research should explore how the interval of trend analysis and the duration of one data (in this study, the duration of one data corresponded to 10s) affect the result of trend analysis.
CONCLUSIONS
As shown in Figures 12-14, we proposed the method for the trend analysis that adopted a single regression model where time and base line of drowsiness (one of evaluation) corresponded to an independent variable and a dependent variable, respectively. We carried out the proposed trend analysis. Using the result of trend analysis, we proposed a new approach to predict the point in time (we call this the point in time of virtual accident) when the participant would have encountered a crucial accident if he continued driving a vehicle. On the basis of results of all participants, the proposed approach could identify the point in time of virtual accident, and was promising for identifying and predicting in advance the time zone with potentially high risk (probability) of inducing an accident due to drowsy driving, and for warning drivers of such a state.
Future research should make an attempt to make use of the proposed method, predict the time in point with considerably high probability of potential danger of accident in real-world driving environment, and further verify the effectiveness of the proposed method.
REFERENCES
Brookhuis, K. A. and D.Waard, D. (1993), “The use of psychophysiology to assess driver status”, Ergonomics, Vol.36, pp.1099-
1110. Kecklund, G. and Akersted, T. (1993), “Sleepiness in long distance truck driving: An ambulatory EEG study of night driving”, Ergonomics, Vol.36, pp.1007-1017. Montgomery, D. C. (2005), “Design and Analysis of Experiments”, 6t-edotion, John Wiley & Sons. Murata, A. and Hiramatsu, Y. (2008), “Evaluation of drowsiness by HRV measures -Basic study for drowsy driver detection-“,
Proc. of IWCIA2008, pp.99-102. Murata, A., Koriyama, T. and Hayami, T. (2012), “Basic Study on the Prevention of Drowsy Driving using the Change of Neck
Bending Angle and the Sitting Pressure Distribution”, Proc. of SICE2012, pp.274-279. Murata, A., Koriyama, T., Ohkubo, Y., Moriwaka, M. and Hayamai, T. (2013a), “Verification of Physiological or Behavioral Evaluation Measures Suitable for Predicting Drivers’ Drowsiness”, Proceedings of SICE2013, pp.1766-1771. Murata, A., Matsuda, Y., Moriwaka, M. and Hayami, T. (2011a), “An Attempt to predict drowsiness by Bayesian estimation”,
Proc. of SICE2011, pp.58-63. Murata, A., Nakatsuka, A. and Moriwaka, M. (2013b), “Effectiveness of Back and Foot Pressures for Assessing Drowsiness of Drivers”, Proceedings of SICE2013, pp.1754-1759. Murata, A. and Nishijima, K. (2008), “Evaluation of Drowsiness by EEG analysis -Basic Study on ITS Development for the
Prevention of Drowsy Driving-“, Proc. of IWCIA2008, pp.95-98. Murata, A., Ohkubo, Y., Moriwaka, M. and Hayami, T. (2011b), “Prediction of drowsiness using multivariate analysis of biological information and driving performance”, Proc. of SICE2011, pp.52-57. Murata, A., Urakami, Y., Koriyama, T., Ikeda, M and Hayami, T. (2013c), “Evaluation of Drowsiness of Driver Based on
Change of Sitting Pressure Center”, Proceedings of SICE2013, pp.1760-1765. Skipper, J. H. and Wierwillie, W. (1986), “Drowsy driver detection using discrimination analysis”, Human Factors, Vol.28, pp.527-540.
LISTED IN THE AHFE DIGITAL BOOKSTORE CATALOGUE
Explore the complete digital volume
Advances in Safety Management and Human Factors
Read this individual research paper free through the original publisher, or explore the full digital proceedings book.
ISBN 978-1-4951-2100-5
Explore this ISBN in the AHFE Bookstore ↗Listed in the July 2026 bookstore catalogue; search by ISBN to confirm current availability · Digital book purchase optional