Jie Gu, Yanfei Zhu, Chengqi Xue (2021). Design Strategy for Data News Visualization Structure Sequence based on User Cognition. In: Human Systems Engineering and Design (IHSED2021): Future Trends and Applications. AHFE Open Access, vol. 21. https://doi.org/10.54941/ahfe1001096
In interactive visual data news, to help users better understand the page and information, designers need to organize the information level of the visual page more reasonably. This study compares the two representative data attributes of time data and spatial data in data news. We compared two visualization sequences representing different structures: "temporal data" and "spatial data" were used as a combination of "global" and "local" visualization designs as exploration clues. The experimental task is to score the dual-task recognition performance and subjective evaluation of correlation and data trend judgment. This intended to explore the different effects of two visualization structures on user information recognition and understanding. The results show that the exploration structure of "spatial" data as global exploration cues and "time" data as local exploration cues performs better in terms of user preferences and understanding performance. This study provides a reference for the design of interactive data news.
We live in an era full of data. Many companies are busy developing data visualization in order to display data more intuitively to users. Many well-known news publishing companies and organizations, such as The Guardian and The New York Times, have a huge influence on the visualization of data news reporting. At the same time, more and more researchers are beginning to pay attention to the "narrative" of data visualization. The "Narrative Visualization" proposed by Segel and Heer has received a lot of attention in recent years. Their work shows that Ordering is a part of the visual narrative structure, which means the exploration path set by the creator for the viewer. (Segel, 2010)But in the context of visualization, we don't know much about the user's data exploration path. According to the existing research of Hullman, it has been proved that in the visualization sequence, users have obvious data type preference for the jump between views. (Hullman, 2013) However, there is still a lot of room for research on how users perceive the comparison of visual data attributes from local to global. For example, in the scenario of visual design, how do designers set user exploration paths in data news visualization based on data attributes.
In this paper, we use a controlled study to study users' cognition of local to global data attributes in a visualization sequence, and then study users' cognition and performance of visualization structures based on data attributes. In the research, we designed two sets of visualization chart sequences based on user preferences obtained by previous scholars. The two sets of sequences use different data attributes (time and space) at the "global" and "local" levels, and we want to explore the impact of data news visualization structure composed of different data attributes on users' reading and cognition.
RELATED WORK OF VISUALIZATION STRUCTURE DESIGN Visualization is widely used, and previous studies have also greatly improved the data computing capabilities and graphic display capabilities of data visualization. There are related researches on the structural strategy of visual sequences, but the research on this part is not perfect.
Our work is inspired by many related studies in the field. Perry W Thorndyke(Thorndyke,
Human Systems Engineering and Design (IHSED 2021) https://openaccess.cms-conferences.org/#/publications/book/978-1-7923-8987-0
1977) studied the influence of structure and content variables on the memory and understanding of prose paragraphs through two experiments, and discussed the meaning of the narrative memory structure model. Black et al (Black, 1979) studied the impact of story sentences on user memory, and studied user memories from the perspective of story plots. Cohn (Cohn, 2013) studied the structure and understanding of narrative images by introducing the theory of narrative grammar, and proposed research methods for testing narrative categories and constituencies.
Segel & Heer (Segel, 2010) once put forward the concept of "Narrative Visualization" in the paper. The design space described in the paper includes Genre, visual narrative tactics, and narrative structure tactics. Narrative Structure is divided into three parts: ordering, interactivity, and messaging. Ordering refers to the exploration path set by the creator for the viewer. This path may be pre-specified by the visualization author, or it may be the viewer's own choice or even no obvious rule path at all. Interactivity means different ways for the viewer to operate the visualization, for example, through filtering, selection, search and navigation, the user learns the visualization operation method. Messaging refers to the exchange of information between visualization and viewers. For example, the annotations, notes and instructions on the visualization page belong to this category.
In the preliminary research on visual sequence, the current research direction is more extensive. There are many studies based on data journalism, which study the user's operation and cognition in news visualization. There are also many studies aimed at the education industry, especially the visualization of schoolwork information between teachers and students.(Chen, 2019) Hullman et al (Hullman, 2011) proposed that there are four editing layers in the visualization presentation: data, visual representation, textual annotations, and interactivity. This idea inspired us to analyze and study visualization cases from different levels. Visual representation is understood as the presentation sequence in visualization, especially in data journalism applications. The presentation of data and information needs to be conveyed to readers through structured and orderly design, which also inspired us to apply the form of visualization sequence in the research.
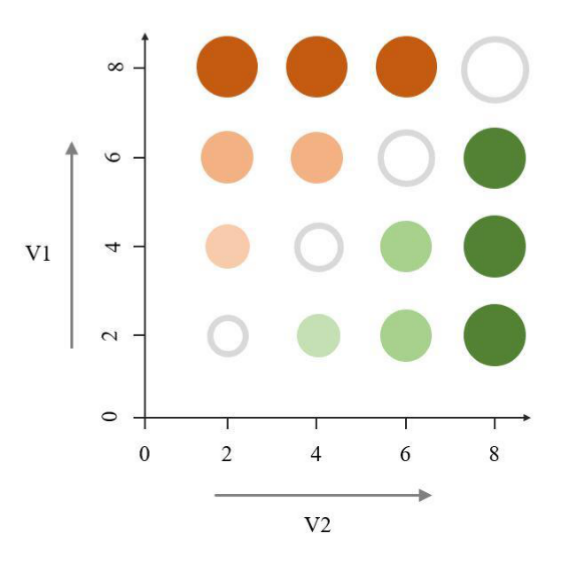
In data journalism, there are many ways to present data charts. According to the statistics of the content published by several large-scale data news websites by Stalph(Stalphy, 2018), the map is the most interactive visualization type in daily data news reports. Overlay graphic symbols on basic geographic charts, a strategy that is now widely used to visually encode data on the map. As Elmer (Elmer, 2013) put forward, compared with univariate maps, bivariate maps have more design possibilities. Nusrat (Nusrat, 2018)summarized several common bivariate coding graphs in the research, for example, the geographic mapping of data represented by color, graph size and continuity between graphs.
Human Systems Engineering and Design (IHSED 2021) https://openaccess.cms-conferences.org/#/publications/book/978-1-7923-8987-0
Figure 1. A kind of legend for bivariate encoding: color and scale
STUDY RATIONAL AND HYPOTHESIS In order to create a more objective and reliable experimental visualization sequence, we chose datasets in which the subjects are not familiar with the data changes but understand the meaning of the data, the purpose is to reduce the influence of the subjects' prior knowledge on the experiment.
Regarding the setting of time granularity, we set the overall time span to 4 years, including four-time nodes and the interval between each node is the same, so as to prevent users from preferring one of the time nodes.
Regarding the selection and processing of the map, we have chosen the map of the United States. From the perspective of density and distribution, the map of the United States has great advantages suitable for research; except for Alaska and Hawaii, the distribution of the remaining 48 states is relatively even. In the area division angle of the map, we did not adopt
Human Systems Engineering and Design (IHSED 2021) https://openaccess.cms-conferences.org/#/publications/book/978-1-7923-8987-0 the official area division, because the official area division does not guarantee that the number of states in each area is the same; therefore, we use the imaginary X and Y division lines to divide the United States' mainland map for four regions and keep each region 12 states.
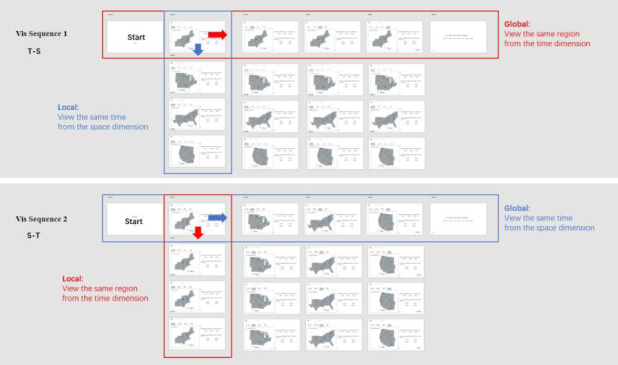
Figure 2. Sequence structure of the experiment
As shown in the figure, it is the data sequence of the two architectures used in this research. The "T-S" sequence refers to the exploration architecture that uses Time as the global exploration layer and Space as the local exploration layer; the "S-T" sequence refers to the exploration architecture that uses Space as the global exploration layer and Time as the local exploration layer.
The two variables of each data set are displayed by a bivariate Dorling chart, which are the two sets of data: "number of shooting cases" and "unemployment rate", "incidence of cardiovascular disease" and "distribution of obesity population" set. Regarding data processing and scaling methods, we extracted the relationship between data and graphics processing from Rosling's GapMinder case.
STUDY DESIGN We used a within-subjects design where all participants were exposed to both visualization sequences. For each visualization sequence, participants need to complete 3 training trials,
Human Systems Engineering and Design (IHSED 2021) https://openaccess.cms-conferences.org/#/publications/book/978-1-7923-8987-0 and 2 visualizations ×2 datasets × 3 trials × 2 tasks = 24 main trials, is each user needs to complete 27 trials.
The presentation of the visual sequence and the presentation of the variables of the data set both use Latin squares to achieve a balance. We set the order of each task question to appear randomly; in the 24 trials conducted by each participant, the 3- repetition order was also processed randomly.
We conducted our experiment by using an offline web platform to perform experimental operations. The user interface of the web page is coded by WebStorm software and generated by D3(Petroleuml, 2013) and Protovis(Bostack, 2013). When distributing experiment links to the subjects through online channels, the matching and screen compatibility of the experiment page and the tested device were ensured. We recruited 30 subjects, 18 of whom were studying for a master's degree and 12 were undergraduates, all of whom had their eyesight tested before the experiment. Their age distribution is 23-28 years old, their subject backgrounds are design-related majors, and they have experience in visual interface operation.
In this experiment, we set up several training pages in the early stage to guide the subjects on how to operate and complete the experimental tasks.
(1) Introduction and training We introduced the web page interface and operation process to be used in the experiment to the subjects through the pdf file, and how to judge the correlation between the two variables. After reading the instructions, the subjects will be tested on 4 questions, 2 questions for each task to test that the subjects really understand the content and process of this experiment.
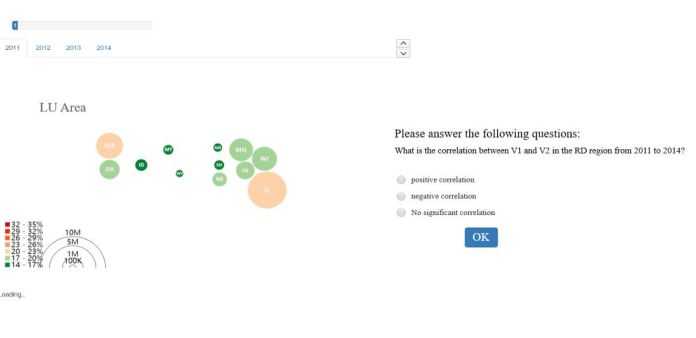
(2) The main part of the experiment the following figure shows a screenshot of the experiment screen, and the progress bar of this experiment is shown above. On the left side of the screen is the visual display area. Participants explored the visual sequence by switching the four global tabs above and the two toggle buttons below. Questions will always be displayed in the question area on the right. Participants can answer the questions at any time during the exploration process on the left and click the "Confirm Selection" button to submit the answer; after completing a single experiment, they can click "Next" to proceed to Likert Fill in the special scale.
Human Systems Engineering and Design (IHSED 2021) https://openaccess.cms-conferences.org/#/publications/book/978-1-7923-8987-0
Figure 3. Web interface used to conduct the experiment
RESULTS AND DATA ANALYSIS We use graphical point estimation and interval estimation to analyze, report and explain all our inferences and statistical results. (Cumming, 2005) In the analysis of this part, we report the task completion time and error rate as well as the sample mean of the 95% confidence interval to show the reasonable range of the overall mean. (Peña-Araya, 2020) We analyzed a total of 720 trials (30 participants × 24 trials).
Completion time: The figure shows the average completion time of each sequence. It can be seen that in terms of the average response time, the "S-T" sequence is faster than the "T-S" sequence.
Table 1. Completion time statistics.
Table available in the original PDF paper.
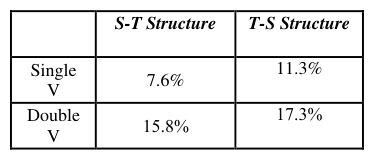
Error rate: The figure shows the average error rate of each sequence. We can see that in the task of single variable trend judgment, the error rate of the "T-S" sequence (11.3%) is higher than the error rate of the "S-T" sequence (7.6%). But in the task of bivariate trend judgment, the gap between the two is not obvious, and the "T-S" sequence is only 1.5% higher than the "S-T" sequence.
Human Systems Engineering and Design (IHSED 2021) https://openaccess.cms-conferences.org/#/publications/book/978-1-7923-8987-0
Table 2. Error rate statistics.
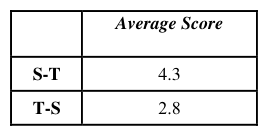
Likert scale: From the table, we can see that the subjects’ subjective perception scores for the two exploratory structures are different. The subjective score of the "S-T" sequence (4.3) is 1.5 higher than the subjective score of the "T-S" sequence (2.8). To a certain extent, this shows how difficult it is to understand the sequence. Users think that the "S-T" sequence is better than the "T-S" sequence.
Table 3. Likert average score.
Here we use the paired sample T test to analyze the significance of the difference in the response of the two sequences. As shown in the table,
Table 4. Paired samples test.
Table available in the original PDF paper.
Obviously, the t-test result is significant, and the response time of the "TS" sequence and the "ST sequence" is significantly different, t = -2.285, p = 0.030; compared with the "S-T sequence", the subjects have a longer response time to the "T-S sequence".
According to the experimental data, we can observe that the H1 hypothesis is more in line with the actual experimental observation results. Participants did have significant differences in response time results. The "S-T" sequence was indeed significantly better than the "T-S" sequence in terms of response time and task accuracy.
Human Systems Engineering and Design (IHSED 2021) https://openaccess.cms-conferences.org/#/publications/book/978-1-7923-8987-0
CONCLUSION
Our findings generally follow our previous assumptions, so we believe that this research truly demonstrates to a certain extent the influence of "temporal data" and "spatial data" on users' understanding of the exploration structure of the visualization sequence.(Hullman, 2017) In this paper, we focus on the structure of the visualization sequence on the data attributes, and at the same time try to find the user's exploration path strategy in combination with an appropriate interaction space. As mentioned above, we have obtained certain credible conclusions.
In previous studies, time is usually considered as a commonly used change measurement path (Kessel, 2011). However, with the development of visualization research and technology, more and more visualization data type has been introduced into the field (such as measure, space, time, granularity). In this process, data news creators are faced with the problem of how to organize the data hierarchy. In this study, from the perspective of data journalism, it is very interesting to try to observe the influence of two different structures of time and space series from the perspective of data.
Graph., vol. 16, no. 6, pp. 1139–1148, (2010). Hullman, Drucker, Henry Riche, B. Lee, D. Fisher, E. Adar, “A deeper understanding of sequence in narrative visualization,” IEEE Trans. Vis. Comput. Graph., vol. 19, no. 12, pp. 2406–2415, (2013). Thorndyke, “Cognitive structures in comprehension and memory of narrative discourse,”
Cogn. Psychol., vol. 9, no. 1, pp. 77–110, (1977). Black , G. H. Bower, “Episodes as chunks in narrative memory,” J. Verbal Learning Verbal Behav., vol. 18, no. 3, pp. 309–318, (1979). Cohn, “Visual Narrative Structure,” Cogn. Sci., vol. 37, no. 3, pp. 413–452, (2013). Chen, Li, Pong, Qu, “Designing narrative slideshows for learning analytics,” IEEE Pacific
Vis. Symp., vol. 2019-April, pp. 237–246, (2019). Hullman, N. Diakopoulos, “Visualization rhetoric: Framing effects in narrative visualization,” IEEE Trans. Vis. Comput. Graph., vol. 17, no. 12, pp. 2231–2240, (2011). Stalph, “Classifying Data Journalism: A content analysis of daily data-driven stories,”
Journal. Pract., vol. 12, no. 10, pp. 1332–1350, (2018). Elmer, “Symbol Considerations for Bivariate Thematic Mapping,” Proc. 26th Int. Cartogr.
Human Systems Engineering and Design (IHSED 2021) https://openaccess.cms-conferences.org/#/publications/book/978-1-7923-8987-0
Amar, Eagan, J. Stasko, “Low-level components of analytic activity in information visualization,” Proc. - IEEE Symp. Inf. Vis. INFO VIS, pp. 111–117, (2005). Petroleum, T. Conference, I. Petroleum, and T. Conference, “Data-Driven Documents,” vol.
7, no. 12, pp. 2–3, (2011). Bostock and Heer, “Protovis: A graphical toolkit for visualization,” IEEE Trans. Vis.
Comput. Graph., vol. 15, no. 6, pp. 1121–1128, (2009). Cumming and S. Finch, “Inference by eye confidence intervals and how to read pictures of data,” Am. Psychol., vol. 60, no. 2, pp. 170–180, (2005). Dragicevic, F. Statistical, H. C. I. Modern, and S. Methods, Fair Statistical Communication
in HCI Pierre Dragicevic To cite this version : Fair Statistical Communication in HCI. (2016). Peña-Araya, E. Pietriga, A. Bezerianos, “A Comparison of Visualizations for Identifying Correlation over Space and Time,” IEEE Trans. Vis. Comput. Graph., vol. 26, no. 1, pp. 375–385, (2020). Hullman, R. Kosara, and H. Lam, “Finding a Clear Path: Structuring Strategies for
Visualization Sequences,” Comput. Graph. Forum, vol. 36, no. 3, pp. 365–375, (2017). Kessell, B. Tversky, “Visualizing space, time, and agents: Production, performance, and preference,” Cogn. Process., vol. 12, no. 1, pp. 43–52, (2011).
Human Systems Engineering and Design (IHSED 2021) https://openaccess.cms-conferences.org/#/publications/book/978-1-7923-8987-0
LISTED IN THE AHFE DIGITAL BOOKSTORE CATALOGUE
Explore the complete digital volume
Human Systems Engineering and Design (IHSED2021): Future Trends and Applications
Read this individual research paper free through the original publisher, or explore the full digital proceedings book.
ISBN 978-1-7923-8987-0
Explore this ISBN in the AHFE Bookstore ↗Listed in the July 2026 bookstore catalogue; search by ISBN to confirm current availability · Digital book purchase optional