Huang Shan, Haiyan Wang, Chengqi Xue, Xia Shuang (2022). Icon Similarity Algorithm Based on Skeleton Comparison. In: Intelligent Human Systems Integration (IHSI 2022): Integrating People and Intelligent Systems. AHFE Open Access, vol. 22. https://doi.org/10.54941/ahfe100963
Icon plays an crucial role in infographics, which additionally carries essential functions in the human-computer graphical user interface (GUI). However, too similar icon is easy to trigger confusion in the process of using. In this paper, we explored the use of the cognitive rules from global to local based on the theory of topological perception, and built a computational discrimination tool from the human perception to describe similarity. Screening out icons that are too similar is the primary purpose of this research to avoid errors in use. We utilized skeleton algorithm to extract the global features of icons. The optimal subsequence bijection and Hungarian algorithm were used to compare the global skeleton of the icon. Accordingly, the similarity between the icons was calculated. To verify the proposed algorithm, we conducted a subjective cognitive experiment. Participants were asked to rank the similarity of the experimental materials and compare the results with the calculation outcomes. Results demonstrate that the proposed calculation methodology based on skeleton comparison is close to the subjective cognition, which can effectively describe the human perception of icon similarity.
Intelligent Human Systems Integration (IHSI 2022): Integrating People and Intelligent Systems https://openaccess.cms-conferences.org/#/publications/book/978-1-7923-8988-7
INTRODUCTION
With the development of computer technology, the graphical user interface (GUI) has become more and more widely used in various fields. Icons play a vital role in GUI as an important form of information graphical representation. Clear and precise icons with a high degree of recognition can help users to understand and interact with information more efficiently. In order to increase the cognitive capacity of icons on an interface, designers often use similarity to encode icons. However, if the degree of similarity between icons is not appropriate, it can lead to cognitive confusion in the process of use. To avoid such errors, it is necessary to construct an algorithmic tool that describes the human perception of the degree of similarity of icons. It can help designers to use scientific computational tools to measure the likelihood of confusion between similar icons.
With the advancement of artificial intelligence technology, the calculation of the similarity of graphic images has also been studied in depth. Zauner [1] proposed a perceptual hash algorithm that relatively obtain the Hamming distance between two images to determine the degree of similarity between them. Serge Belongie [2] in 2002 proposed a method for shape matching and object recognition through the shape context method, which solves the problems of point set recording and shapes recognition considerably. Since the features of shapes can be extracted and recognized, there is a basis for determining whether two shapes are similar, and their similarity can be calculated quantitatively. Li Longlong et al.[3] proposed a leaf feature extraction algorithm based on an improved Sobel operator, which uses a fuzzy semi-supervised weighted clustering algorithm to cluster different feature matrices. In turn, the leaf feature correlation was derived. Otherwise, graphical similarity classification and computation by machine learning has been gradually developed. For example, Lagunas et al.[4] achieved an appearance similarity match of 75.25% by training twin neural networks (SNN).
However, most of the existing research is based on the numerical information of the image itself to calculate the similarity. The similarity results could not describe the human perception of similar shapes well. This paper proposes an algorithmic tool to discriminate the similarity between icons based on the topological perceptual organization theory proposed by Chen Lin [5], which states that the process of human perception of graphics is "from large scale to local" and topological invariance is the basis of perception. The skeleton algorithm is used to extract topological properties and global features of icons. Comparisons are then made through the distribution of different skeleton nodes and their branches, thus achieving similarity comparison results from global to local. Further to this, a subjective questionnaire was administered to the icon material in the calculation. The results of the participants' supervisor similarity ranking were compared with the results of the calculations proposed in this paper as a way to verify the approximation of this paper's algorithm to subjective perceptions. The results show that the computational tool proposed in this paper can effectively describe the human perception of icon similarity.
Intelligent Human Systems Integration (IHSI 2022): Integrating People and Intelligent Systems https://openaccess.cms-conferences.org/#/publications/book/978-1-7923-8988-7
ALGORITHM CONSTRUCTION The field of visual perceptual organizational psychology has two main directions for the perception of object patterns at present. One is the Feature Analysis theory that assumes that visual perception is from local to global. The object is composed of separated basic shape primitives. The other is the global priority theory, such as the topological perceptual organization theory proposed by Chen Lin and the Gestalt psychology theory. Topological perceptual organization theory assumes that global features take precedence over local features. The human visual process begins with the large-scale nature of perception, and the large-scale nature of perceptual organization can be described by topological invariance.
For graphics such as icons or logos, the global priority of perceptual properties is more suitable for practical applications. Therefore, in this paper, the similarity of icons is calculated based on the law of large-scale precedence. In other words, the global features of icons are extracted first. The global information is then compared and matched to obtain the similarity degree.
Skeleton Algorithm Blum [6] proposed the skeleton algorithm in 1973. The skeleton can be understood as the central axis of the graph, which can describe the global structure of the object well. Skeleton can reflect the topological properties of objects well.
The Zhang-Suen refinement algorithm is chosen for the extraction of the icon skeleton in this paper. This algorithm is usually an iterative process. It considers the connectivity of the image skeleton sufficiently. It is also able to extract curves with curvature, inflection points, and intersection points more accurately. The skeleton is kept relatively consistent with the original image. It meets the ideal requirements for extracting the skeleton of an icon, and can better match the global abstraction of human perception of graphic icons. The Zhang-Suen refinement algorithm is usually an iterative process. Each iteration step is an erosion of the target pixels that meet certain conditions. The effect is that the target becomes finer and finer. When no new pixels of the target after the previous erosion have been eroded in the current operation, the iteration is stopped and the algorithm ends. The discriminant conditions are: 2 ≤. B ( P1 ) ≤ 6 (1) A ( P1 ) = 1 . (2) P2 * P4* P6 = 0 (3) P4 * P6* P8 = 0 (4) P1 is defined as the central pixel, P2-P8 are defined as the domain pixels. Skeleton algorithms are now commonly used for shape classification and dynamic recognition with good invariance. This is consistent with the concept of topological invariance in topological perceptual organization theory which is suitable for the extraction of global features structure. This paper innovatively extends this algorithm to the quantification of icons.
Intelligent Human Systems Integration (IHSI 2022): Integrating People and Intelligent Systems https://openaccess.cms-conferences.org/#/publications/book/978-1-7923-8988-7
Path similarity Skeletons are generally used in object matching, where the most important information is the distribution of skeletal branches. The idea of path similarity allows the information about skeleton branches to be processed well. Path similarity algorithms are used to match objects by calculating the distance between skeleton branches. In this paper, the optimal subsequence bijection method is used to match the end nodes of the skeleton branches. The Hungarian algorithm is also used to calculate the matching cost of the branch nodes, which results in the calculation of the similarity between two icons.
Icon similarity algorithm The process of the similarity comparison tool is as follows:
Step1. Extract the skeleton of the two icons being compared. Get the information of the end nodes and the connected nodes.
Step2. Use the skeleton information to match the end nodes extracted from the icons. The end nodes of the skeleton need to be sorted before matching.
Step3. Use the OSB algorithm on the path distance matrix of the end nodes to calculate the matching cost between the end nodes of different skeletons.
Step4. Use the OSB algorithm for the matching cost between the end nodes. The optimal correspondence between the end nodes of different skeletons can be calculated and stored in the matrix.
Step5. Use the end-node pairing information in the previous step to calculate the matching cost between branch nodes of different skeletons.
Step6. Construct the matching cost matrix between branch nodes. Use the Hungarian algorithm to find the best match. Use this matching cost as the similarity distance between the two icons.
Step7. If there are still icons to be compared, repeat steps 1-6 until all icons are compared
EXPERIMENTAL VALIDATION In this study, a questionnaire survey and expert review were used to verify the validity of the proposed icon similarity calculation model.
Path similarity The purpose of this study is to collect people's subjective perception ranking of the similarity degree of icons. The investigation results are used to verify the calculation results of similarity degree by the algorithm proposed in this paper. The content of the survey was a graphic similarity ranking questionnaire. Participants were undergraduate or master's students between the ages of 18 and 26, regardless of gender and major.
Intelligent Human Systems Integration (IHSI 2022): Integrating People and Intelligent Systems https://openaccess.cms-conferences.org/#/publications/book/978-1-7923-8988-7
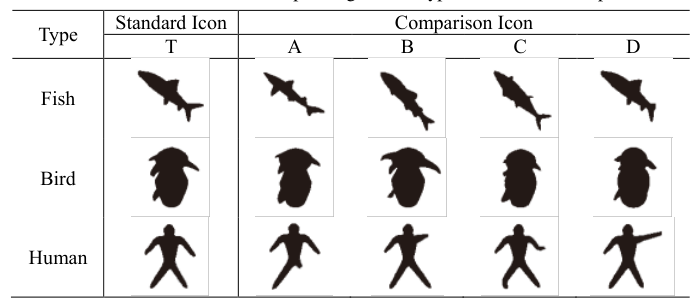
The questionnaire is divided into two parts. The first part is basic information registration. The second part is the ranking of similarity of multiple groups of similar icons. To make the sorting difficulty moderate, no more than 4 experimental icons were set for each group to be judged. Four experimental icons were compared with one standard icon in the similarity ranking questionnaire. Three different types of icons in the Kimia 99 database are selected. The standard icons are shown in Table 1 below. All icons are presented as binary images. The standard icon in each group of similar icons is named "T". Other experimental icons in the same group were randomly shuffled and named "A", "B", "C", and "D" respectively. The four levels of least similar, generally similar, very similar, and most similar are set on the judgment level. When processing the questionnaire results, the four grades correspond to 1 point, 2 points, 3 points, and 4 points respectively, to quantify the ranking results of subjective similarity.
Table 1: The serial number corresponding to three types of icons in the experiment Type Standard Icon Comparison Icon T A B C D
There were 45 questionnaires returned. 45 of them were validly completed, with a male to female ratio of 4:5. The data collected showed that the number of people working in iconographic design-related disciplines was 23:22 in relation to other unrelated disciplines. The impact of this situation on the results of the experiment will be considered later.
Expert Review An experiment called 'brand in memory' was conducted by signs.com [7], in which 156 participants of all ages were recruited to draw logos of common logos currently on the market based on their memories only. The results were ranked according to their accuracy by five experienced logo designers and marketing experts.
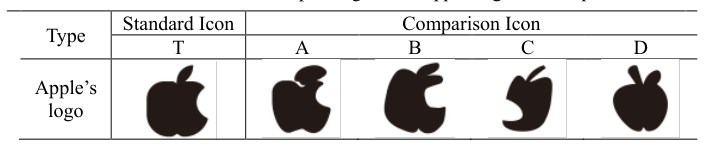
The participants were asked to recall and draw famous American logos such as Apple, Starbucks, 711, and Target. The Apple logo was chosen to validate the algorithm because of its global recognition.
This research did not consider the influence of color on icons, only explores the
Intelligent Human Systems Integration (IHSI 2022): Integrating People and Intelligent Systems https://openaccess.cms-conferences.org/#/publications/book/978-1-7923-8988-7 visual cognition of shape aesthetic. Therefore, the icons used for validation need to be binarized before similarity calculations. In addition, in order to exclude individual differences in icon structure among the subjects, this paper selects five icons from different accuracy gradients in all hand-drawn icons for algorithm validation. The icons used for calculation are shown in Table 2 (binarized).
Table 2: The serial number corresponding to the ‘Apple’ logo in the experiment Type Standard Icon Comparison Icon T A B C D
RESULT AND ANALYSIS Questionnaire Results and Algorithm Validations
The questionnaire result is the subjective score of the similarity of each icon in the same group. The higher the score, the more similar it is to the standard icon in people's cognition. The value obtained by the icon similarity algorithm proposed in this paper is the similarity distance between two icons. The higher the value, therefore, the greater the shape similarity distance and the lower the similarity degree. The subjective cognitive results and calculation results are sorted respectively. The final similarity ranking is used for the verification of the algorithm.
The subjective evaluation scores and similarity calculation results of icons from Kimia 99 database are shown in Table 3 to Table 5. The two results have been sorted separately in each table. The ranked results will be used as a basis for analyzing the effectiveness of the calculation.
Table 3. The serial number corresponding to ‘Fish’ shape Icon in the experiment Serial number A B C D RankingTable 4. The serial number corresponding to ‘Bird’ shape Icon in the experiment Serial number A B C D Ranking
Intelligent Human Systems Integration (IHSI 2022): Integrating People and Intelligent Systems https://openaccess.cms-conferences.org/#/publications/book/978-1-7923-8988-7
Table 5. The serial number corresponding to ‘Human’ shape Icon in the experiment Serial number A B C D Ranking
According to the ranking results, it can be seen that the subjects' judgment on the similarity degree of ‘Fish’ and ‘Bird’ shape icons is completely consistent with the calculation results of the algorithm. In the validation process for the ‘Human’ icons, icons B, C, and D were calculated to match the subjective ranking results. Icon A, on the other hand, showed exactly the opposite finding. It was considered the least similar in the subjective ranking, but the most similar in the calculated results.
For the ‘Apple’ logo, the standard icon is the most similar to the real icon. Other icons are arranged as A, B, C, and D according to the restoration accuracy reviewed by experts from high accuracy to low accuracy.The four icons to be compared in Table 2 (A, B, C, and D) are arranged according to the evaluation results of experts on their restoration accuracy. The accuracy of A, B, C, and D decreases in turn. The calculation results of this paper (shown in Table 6) can be seen to be in full accordance with the expert review results.
In summary, the above finding provides a certain degree of validation that our proposed calculation tools can effectively describe cognitive consequences
Table 6. The serial number corresponding to the Apple logo in the experiment Serial number A B C D Ranking
Similarity 0.2945 0.3208 0.3528 0.5190 ABCD DISCUSSION As can be seen from the previous comparison results, the calculation tool proposed in this paper is well validated for the Bird, Fish, and Apple logos. The relative similarity of the No. B, C, and D among the human icons are consistent with the subjective perception results, while the No. An icon appears to be the complete opposite. This is probably caused by that although all parts of A and T are identical in human visual perception except for the right leg, the right leg accounts for a larger proportion of the whole, and thus is less similar than the other complete figures from an overall perspective. The right leg part of the human icon is considered a detailed feature of the whole figure, whereas the algorithm in this paper is based mainly on global features for comparison. Thus, it leads to completely opposite results. Further introduction of local features will be considered in future research to complete the idea of the algorithm from global to local.
In addition, the icons used in this paper are all single connectivity icons. Further
Intelligent Human Systems Integration (IHSI 2022): Integrating People and Intelligent Systems https://openaccess.cms-conferences.org/#/publications/book/978-1-7923-8988-7 research will consider how to extract the global features of multi-part constituent icons.
CONCLUSIONS
In this study, different kinds of natural graphics in Kimia99 database and the logo of the famous trademark "Apple" were used as research materials, and the validity of the proposed algorithm was verified by questionnaires and expert evaluation methods. The comparison results show that the calculation tool of icon similarity based on the skeleton algorithm can describe the subjective cognitive results of similar icons. It shows that the basic idea of constructing the algorithm based on the perception law of topological invariant graph with "large scope first" is feasible. However, the proposed algorithm is limited to computing the similarity of icons with connectivity. In the future, we can further explore the similarity calculation method of non- connectivity icons with higher complexity.
ACKNOWLEDGMENTS
The authors would like to gratefully acknowledge the reviewers’ comments. This work was supported jointly by National Natural Science Foundation of China (No. 71871056, 71801037) and Science and Technology on Avionics Integration Laboratory and Aeronautical Science Fund (No. 20185569008).
REFERENCES
Zauner, C. (2010). Implementation and benchmarking of perceptual image hash functions. Belongie, S., Malik, J., & Puzicha, J. (2002). Shape matching and object recognition
using shape contexts. IEEE transactions on pattern analysis and machine intelligence, 24(4), 509-522. Longlong, L., Dongjian, H., Meili, W. (2016). Leaf feature relevance for recognition rate based on Image analysis algorithm. Computer Engineering and Design. 37(8). 2259-2263. Lagunas, M., Garces, E., & Gutierrez, D. (2019). Learning icons appearance
similarity. Multimedia tools and applications, 78(8), 10733-10751. Blum, H. (1973). Biological shape and visual science (Part I). Journal of theoretical Biology, 38(2), 205-287. Zhang, T. Y., & Suen, C. Y. (1984). A fast parallel algorithm for thinning digital
patterns. Communications of the ACM, 27(3), 236-239. Brand in Memory, https://www.signs.com/branded-in-memory
Intelligent Human Systems Integration (IHSI 2022): Integrating People and Intelligent Systems https://openaccess.cms-conferences.org/#/publications/book/978-1-7923-8988-7
LISTED IN THE AHFE DIGITAL BOOKSTORE CATALOGUE
Explore the complete digital volume
Intelligent Human Systems Integration (IHSI 2022): Integrating People and Intelligent Systems
Read this individual research paper free through the original publisher, or explore the full digital proceedings book.
ISBN 978-1-7923-8988-7
Explore this ISBN in the AHFE Bookstore ↗Listed in the July 2026 bookstore catalogue; search by ISBN to confirm current availability · Digital book purchase optional