Bettina Harriehausen-Mühlbauer (2022). Enhancing the Computation of Barrier-free Routes via Crowdsourcing. In: Intelligent Human Systems Integration (IHSI 2022): Integrating People and Intelligent Systems. AHFE Open Access, vol. 22. https://doi.org/10.54941/ahfe1001031
Navigation systems rely on a large amount of geodata for their route com-putations. Depending on the used map material and application, this geo-data includes barrier information, such as staircases or steep inclines, which is helpful for mobility impaired people when looking for a barrier-free route. On the basis of OpenStreetMap (OSM), which is included in the GraphHopper routing engine, we have developed the mobility app WheelScout , which computes barrier-free routes using the users’ individu-al mobility profile as well as barrier information which is extracted from OSM but also included by our users – both manually and automatically via data which the sensors in the mobile devices gather via crowdsourcing. Us-ing the example of inclines, we will demonstrate how we automatically compute the information of this barrier by gathering information on baro-metric altitude data and using those to compute the degree of the incline and therefore the barrier.
Intelligent Human Systems Integration (IHSI 2022): Integrating People and Intelligent Systems https://openaccess.cms-conferences.org/#/publications/book/978-1-7923-8988-7
INTRODUCTION
Large amounts of geodata is needed to compute ideal routes in navigation systems. The more detailed the data is, the more exact or better matching the route is that the user is looking for.
In the case of mobility impaired users, this data has to include information on barriers, such as staircases, narrow passages, surface conditions, degrees of incline and also temporary obstructions, such as road constructions or fallen trees.
During our research and development we found that existing systems varied a lot with regard to the amount of included barrier information and we found none of the existing systems to have a sufficiently high coverage of all main barriers, so we included means to add barrier data to our app manually, by asking our users to enhance the app by adding barrier information, but also automatically, as manual work is not only prone to errors, it is also extremely time consuming. Automating the detection of errors is based on data that the users’ mobile devices gather via their built-in sensors and sending this information to our server and then transforming this information into barrier data which is eventually kept in our barrier database, which is consulted by our routing algorithm when a user is looking for a barrier-free route.
Without this large amount of automatically gathered information on the mobile devices of our users we would not be able to compute reliable barrier-free routes, as certain barriers, such as inclines, are not only mapped very incompletely in existing systems, it is also hard for users to include information on inclines manually, as the exact degree of the incline may be hard to judge.
This paper will use the barrier type of steep inclines to describe how we automatically determine and compute incline data from gathering barometric elevation data that we receive from barometric sensors in the mobile devices of our users, how we integrate it into our routing engine GraphHopper and how it is then used for barrier-free navigation. This process therefore exemplifies how crowdsourcing can be used to enhance the quality of our application.
Related Work
Vertical position determination using a barometer sensor The idea of vertical position determination using a barometer is not new. For example, (Wang et al., 2014) have developed a system for precise positioning of vehicles in urban areas, in which the horizontal localization using GPS is "very accurate", but there are gradients or height differences which lead to inaccuracies in the navigation instructions. Despite taking weather data into account, different sensors result in differences with regard to the absolute height. (Ye et al. 2018) come to a similar
Intelligent Human Systems Integration (IHSI 2022): Integrating People and Intelligent Systems https://openaccess.cms-conferences.org/#/publications/book/978-1-7923-8988-7 conclusion. In their work they state that the relative height, based on the ground, would usually have a higher significance than the absolute altitude, based on sea level.
Here, too, the authors point out measurement inaccuracies within 10 meters outdoors and 5 meters indoors.
Data evaluation of altitude data determined by sensors of mobile devices In a Master Thesis related to the WheelScout project (Bialas, 2021), a student worked on the task to determine, whether built-in barometer sensors can be used to determine altitude data for certain geolocations. Like the previous authors, (Wang et.al. 2014) & (Ye et.al. 2018), he came up with the conclusion that the barometer sensor built into smartphones is not suitable for the measurement of absolute heights. The comparison of height profiles computed by data from different smartphones, however, showed that relative height differences can be measured precisely, with an accuracy of ±1 meter. Besides determining the location-related altitude data, the student collected other parameters, such as air-pressure or humidity, in his AltSys.AltiApp, which then transferred all this data to a SQLite database.
GraphHopper with location-based altitudes using SRTM data The routing engine GraphHopper, which we use in our app, is an open source routing engine which uses the map material of OpenStreetMap (GraphHopper, 2021). Although GraphHopper cannot be used directly to determine slope data, different providers of elevation data are however supported to include elevations in the calculation of routes (Karich, 2015).
The SRTM (Shuttle Radar Topography Mission) Data from the provider CGIAR (formerly the Consultative Group for International Agricultural Research) are remote sensing data from NASA, that were determined in 2000 and made available in GeoTIFF and ASCII format. They are used by default in GraphHopper (Karich , 2015), but only offer a relative vertical accuracy of about 5 meters, which can still be falsified by bushes or trees (Rexer & Hirt 2014). Various field tests have also shown that structural modifications, such as bridges or underpasses, are not recorded by the SRTM data. Therefore, for the use case of inclines as barriers, this data can only be used to a limited extent.
Methodology
In this chapter, we will look at how the data for the absolute altitude, which is recorded by current smartphones using their barometer sensors, can be used to identify barriers for wheelchair users.
Intelligent Human Systems Integration (IHSI 2022): Integrating People and Intelligent Systems https://openaccess.cms-conferences.org/#/publications/book/978-1-7923-8988-7
Requirements The system should be able to automatically determine inclines as barriers so that further interactions by the user are avoided as far as possible. As soon as new altitude data are determined, they should be able to be taken into account as barriers for future routing inquiries, provided that an incline has been determined.
Data Collection in Field Tests After checking whether freely available data existed, we started focusing on and comparing the two data sources that have been described before, namely using the barometric sensors to compute altitude information using our own AltSys.AltiApp, and comparing it to the altitude data provided by CGIAR, which is already used by GraphHopper. For the collection of the barometric data, we consistently walked in one direction. Between each measuring point, the measuring interval was 0.5 seconds. Three field tests showed that the results of both data sources were comparable in open terrain (Figures 1 & 2) but deviated when structural modifications were part of the route (Figure 3), which supports the claim, that structural modifications, such as the bridge in field test 3, negatively influence the visualization of the altitude profile as they are not recorded by the SRTM data.
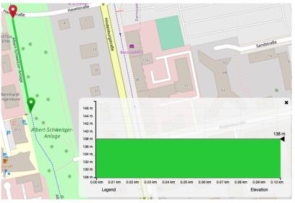
Figure 1. Flat, unobstructed footpath in Darmstadt. GraphHopper CGIAR altitude profile (left), barometric altitude profile computed by AltSys.AltiApp (right) A comparison of the two altitude profiles in Figure 1 shows that the flat route visualized by the CGIAR data is stable at 138 meters and the barometric altitude data is stable at 140.5 meters with slight fluctuations of up to 0.5 meters.
Intelligent Human Systems Integration (IHSI 2022): Integrating People and Intelligent Systems https://openaccess.cms-conferences.org/#/publications/book/978-1-7923-8988-7
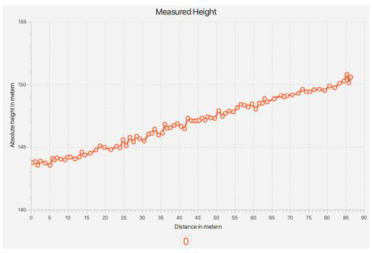
Figure 2. Mild incline of a street in Darmstadt. GraphHopper CGIAR altitude profile (left), barometric altitude profile computed by AltSys.AltiApp (right) The purpose of the second field test was to examine whether a constant incline is recorded accurately. A relative altitude difference of 7 meters is shown in both altitude profiles (Figure 2), where the CGIAR height profile starts at 148 meters and ends at 155 meters and the barometric altitude profile starts at 144 meters and ends at 151 meters.
In a third field test, the altitude profiles of the CGIAR data and the barometric data were compared along a route that included structural changes (here: a bridge surpassing a railway). The altitude profile of the CGIAR data shown in Figure 3 (left) differs significantly from the altitude profile of the barometric data (Figure 3 right). While the ascent and descent of the bridge can be clearly seen in the barometric altitude profile on the right, it is not available in the CGIAR profile on the left. The CGIAR height profile starts at an absolute height of 102 meters and ends at around 98.5 meters, which corresponds to a difference of 3.5 meters. Comparing it to the barometric altitude profile (Figure 3 right) that starts at an absolute altitude of approximately 96.5 meters and ends at an altitude of approximately 93 meters, it is noticeable that the difference in altitude in both profiles is identical. In conjunction with the previous altitude profiles (Figures 1 & 2), this supports the assumption previously made, that the CGIAR elevation profile is not faulty in general, but only in the case when structural changes, such as bridges, are part of the route, as their data is inadequately recorded.
Figure 3. Route including a railway overpath. GraphHopper CGIAR altitude profile (left), barometric altitude profile computed by AltSys.AltiApp (right)
Figure available in the original PDF paper.
Intelligent Human Systems Integration (IHSI 2022): Integrating People and Intelligent Systems https://openaccess.cms-conferences.org/#/publications/book/978-1-7923-8988-7
The field tests have shown that both the CGIAR data as well as the barometric data can reliably be used to compute correct altitude profiles.
Design & Implementation Based on the given results, two alternative solutions were considered, which we eventually combined.
Entering slope information calculated from barometric altitude data into GraphHopper The calculated absolute altitude data can be used to determine inclines along a route. The problem of the inaccuracy of the absolute slope values can be neglected here, since we are not interested in using altitude data in our route computation, but only slopes in percent.
GraphHopper enables user-defined values to be saved in the map material or the graph, so that a later routing with this data is possible (GraphHopper Forum, 2020), (Karich, 2020). After the computation of the incline along a walked route, each measured value will be associated with the respective edge in the generated graph of the map material, so that the corresponding slope value, associated with the respective edge, can be saved in the map material.
But we couldn’t follow this idea alone, as GraphHopper cannot compute an incline from absolute altitude data during runtime. Therefore, we combined it with the second approach.
Adaptation of the existing CGIAR altitude data in GraphHopper using calculated barometric altitude data This approach substitutes the existing CGIAR altitude information for those routes for which barometric altitude data have been calculated. GraphHopper allows this adaptation of altitude data for already rendered map material through its API. Since absolute altitude data are stored in this approach (unlike in the first approach), they have to be adapted to already existing altitude data. The convincing strength of this approach is the complete altitude profile which can be computed. In the combination of both approaches, we first compute an altitude profile according to the 2nd approach and then we initiate the computation of the incline in percent, according to the first approach (see previous chapter), which can then be added to the graph and, respectively, into the map material.
Intelligent Human Systems Integration (IHSI 2022): Integrating People and Intelligent Systems https://openaccess.cms-conferences.org/#/publications/book/978-1-7923-8988-7
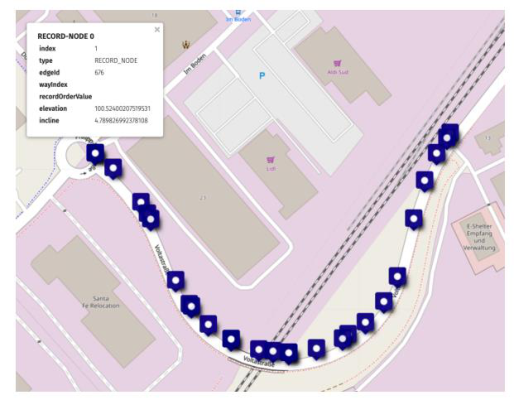
Eventually, all nodes along our route have elevation and incline data attached, as is shown in Figure 4.
Figure 4. Visualization of the final computation and storage of altitude and incline data Results With regard to the research question on the automated determination and integration of slope data in GraphHopper for barrier-free navigation, several field tests have shown that barometric data can well be used for the calculation of inclines as well as for the adaptation of an existing altitude profile from CGIAR altitude data.
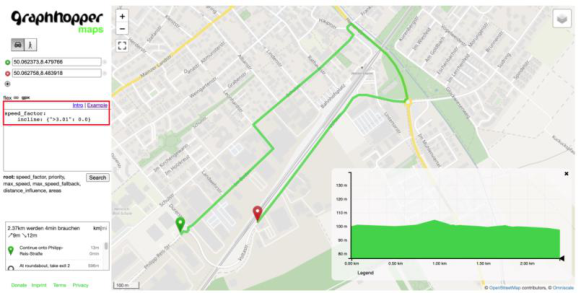
The routing engine GraphHopper has proven to be suitable for adding the calculated altitude data into the map material or the rendered graph, so that barrier-free routes can be computed on the basis of the maximally possible incline, which is defined in the individual profile of each user, which is shown in Figures 5 & 6.
The more data is automatically gathered via the built-in sensors in our users’ mobile devices, the more (incline) data can automatically be added to our map material, and the more accurate the computed routes will be for our mobility impaired users.
The overall approach, to design the data collection as an automated process via crowd sourcing has shown to be a promising direction to go to with regard to the accuracy of our map material, the barrier information and the correctly proposed routes.
Intelligent Human Systems Integration (IHSI 2022): Integrating People and Intelligent Systems https://openaccess.cms-conferences.org/#/publications/book/978-1-7923-8988-7
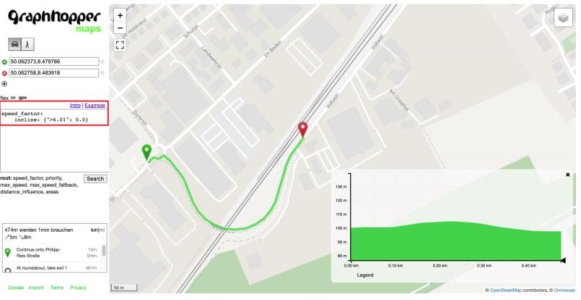
Figure 5. Proposed route in field test 3 when the user has defined a maximally possible incline of 6.01%Figure 6. Proposed route in field test 3 when the user has defined a maximally possible incline of 3% On the basis of automatically collected data, a maximal incline of 6% has been computed for the railway overpath in our 3rd field test scenario. During the computation of the route, the individual parameters in the users’ profile is matched against the map information. As the user in Figure 5 has defined the individual maximal incline to be 6.01%, he is shown a route across the bridge. In Figure 6, where the user has define a lower maximum of 3% incline, a detour is being computed.
Acknowledgments I would like to thank our project partner LAPIC, the association for invalids in Southern Tyrol, for the many years of constructive and friendly cooperation as well as support. It is a pleasure working with you. I would also like to thank my students who have worked on this project with great motivation and commitment. Without their hard work and their conviction that this
Intelligent Human Systems Integration (IHSI 2022): Integrating People and Intelligent Systems https://openaccess.cms-conferences.org/#/publications/book/978-1-7923-8988-7 project is making a significant contribution to improving the quality of life of many people, the app would not be where we are today. References Bialas, Thomas (2021). Datenevaluation der mit Sensoren von mobilen Geräten
ermittelten standortbezogenen Höhen: Master Thesis, May 2021. GraphHopper Forum (2020). Change speed for certain vehicle profile. Eds.
GraphHopper Forum. https://discuss.graphhopper.com/t/change- speed- for certain-vehicle-profile/6108/10 GraphHopper (2021). https://www.graphhopper.com/ Karich, Peter (2015). Elevation data and OpenStreetMap. Hrsg. von GraphHopper Blog. https://www.graphhopper.com/blog/2015/04/21/elevation- data- and openstreetmap/ Karich, Peter. Profiles. Ed. of GraphHopper. (2020). graphhopper/profiles.md at 2.x
· graphhopper/graphhopper · GitHub Rexer, M. and Hirt, C. (2014). “Comparison of free high resolution digital elevation data sets (ASTER GDEM2, SRTM v2.1/v4.1) and validation against accurate heights from the Australian National Gravity Database”. in: Australian Journal of Earth Sciences 61.2 (2014), pp. 213–226. Wang , Xiong et.al. (2020). “VLD: Smartphone-assisted vertical Location Detection
for Vehicles in Urban Environments”, in: 19th ACM/IEEE International Conference on Information Processin Tao g in Sensor Networks (IPSN). IEEE, 42020, pp. 25–36 Ye, Haibo Dong, Kai and Gu. Tao (2018). “HiMeter: Telling You the Height Rather than the Altitude”, in: Sensors (Basel, Switzerland) 18.6
Intelligent Human Systems Integration (IHSI 2022): Integrating People and Intelligent Systems https://openaccess.cms-conferences.org/#/publications/book/978-1-7923-8988-7
LISTED IN THE AHFE DIGITAL BOOKSTORE CATALOGUE
Explore the complete digital volume
Intelligent Human Systems Integration (IHSI 2022): Integrating People and Intelligent Systems
Read this individual research paper free through the original publisher, or explore the full digital proceedings book.
ISBN 978-1-7923-8988-7
Explore this ISBN in the AHFE Bookstore ↗Listed in the July 2026 bookstore catalogue; search by ISBN to confirm current availability · Digital book purchase optional