Amir Behzadan, Renooh Sivakumar (2025). User-Centered Design and Usability Evaluation of a Floodwater Depth Estimation Mobile Application. In: Human Interaction and Emerging Technologies (IHIET 2025). AHFE Open Access, vol. 197, pp. 35–46. https://doi.org/10.54941/ahfe1006697
This study presents the user-centered design (UCD) and evaluation of a mobile application prototype, named Blupix mobile, which uses artificial intelligence (AI) and crowdsourcing to estimate the depth of floodwater in a user’s surroundings. Through a three-phase mixed methods technique based on UCD principles, the functionality, design, and usability of the app prototype are tested with a sample pool of U.S. participants. Results indicate a strong demand for location-specific, real-time alerts as well as community-generated content. The findings of this study aim to contribute to the expanding body of research on mobile disaster risk communication tools that incorporate community participation and engagement.
Floods are the most common type of natural hazards globally, and their impact is expected to grow as a result of climate change, urbanization, and alterations in land use (Hirabayashi et al., 2013; Hu et al., 2018). As population and economic growth continue, flood impacts on the built environment are expected to intensify, especially in densely populated areas (United Nations Environment Programme, 2024; World Meteorological Organization, 2021). With millions of people living in high flood risk areas, there is an urgent need for effective flood risk management and mitigation strategies to protect communities and infrastructure, as well as new approaches to convey timely information about flood risk to affected populations.
Traditional flood monitoring techniques (e.g., in-situ sensor networks, flood gauges, satellite imagery) retrieve data that is too restrictive or vague for local-scale decision-making. These systems face several implementation and operational challenges. Firstly, they can be very expensive to deploy over large geographical areas, thus limiting their application to high spatiotemporal resolution (USGAO, 2020; Lang et al., 2024). Secondly, existing remote sensing systems may lack the temporal and spatial resolution needed to track rapidly evolving flood events. While some provide frequent observations,
their low resolution can limit detail; others offer higher resolution but with infrequent revisit cycles, making them less effective for timely flood monitoring. Additionally, in-situ flood monitoring faces key limitations, as it primarily covers lakes and rivers, while urban areas, where most flood- impacted populations live, often lack sufficient measurement infrastructure (Tellman et al., 2021; Rentschler et al., 2023).
To address these gaps, real-time, location-specific flood data solutions are essential. Advances in AI and user-generated data offer promising options, particularly in urban areas where dense populations and communication networks can compensate for limited hazard monitoring infrastructure. Effective systems must efficiently process large data volumes and adapt to changing conditions. Integrating community-driven data collection enables real-time, crowdsourced updates during flood events. In recent years, social media and smartphones have enhanced access to real-time disaster information, enabling rapid sharing of alerts and updates. However, this accessibility also raises concerns about misinformation and potential privacy risks (Houston et al., 2014; Fraustino et al., 2012).
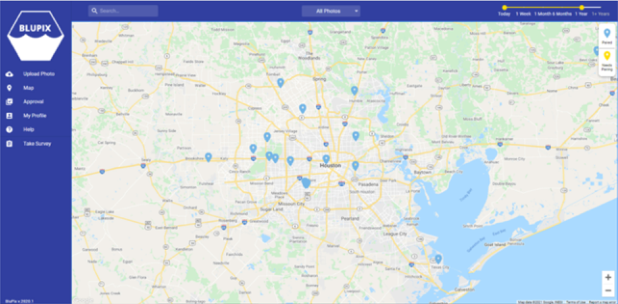
RESEARCH MOTIVATION AND OBJECTIVES In a previous project, researchers in the Connected Informatics and Built Environment Research (CIBER) Lab successfully developed and tested a technique for estimating the depth of floodwater in geo-tagged photos of submerged stop signs (Alizadeh et al., 2022). In essence, this approach leverages AI to estimate water depth by comparing pre- and post-flood images of submerged stop signs (Alizadeh and Behzadan, 2023). This work was later developed into a web application, called Blupix, which allows users to access a growing database of flood photos and AI-generated floodwater depth information (Figure 1).
Figure 1: Users of the Blupix web application can click on pins to view historical flood photos and AI-estimated floodwater depth information.
The current web interface, however, does not provide on-demand floodwater depth data for real-time decision-making. Therefore, the
User-Centered Design and Usability Evaluation of a Floodwater Depth Estimation 37
motivation behind this study is to enable flood-affected communities and first responders to receive and exchange information about street-level floodwater depth and water movement in real-time, report incidents, and share relevant resources. We envision this implementation to be in the form of a computationally-light, mobile application, named ‘Blupix mobile’. The primary objective of the research presented in this paper is to apply the principles of user-centered design (UCD) to evaluate the functionality, design, and usability of the Blupix mobile prototype, focusing on ease of use and user expectations. To achieve this, usability testing and interviews were conducted to understand user interactions and reactions to app features and functions. The research also identifies trust-related factors (e.g., data transparency, validation). Findings will guide improvements to Blupix and contribute to broader flood monitoring and decision support research.
BACKGROUND AND LITERATURE REVIEW User-Centered Design (UCD) Principles
UCD prioritizes end users to ensure the final product meets their needs (Baxter et al., 2015). Gould and Lewis (1985) outline three core UCD principles, namely early focus on users and tasks, empirical evaluation of usage, and iterative design. The process starts with understanding user traits, experiences, and expectations, then involves users early in testing prototypes. User interactions are then analyzed using metrics such as task completion time, errors, and assistance required (Baxter et al., 2015; Rubin and Chisnell, 2008). The outcome of this step helps designers assess usability and uncover underlying issues. Collected metrics then inform iterative design improvements, allowing for early, cost-effective adjustments. Past research shows that applying UCD principles leads to higher customer satisfaction, greater product acceptance, and more efficient cross-functional teams (Chochoiek, 2017; Dopp et al., 2020).
Usability Testing in Mobile App Development Usability is the measure of the ease with which a system can be learned and used, including its effectiveness, efficiency, and safety (Preece et al., 1994). In this study, usability testing is conducted with a sample of future users to validate two initial prototypes of Blupix mobile. We are particularly interested in the systematic observation of end users attempting to complete a task or set of tasks in the mobile app based on representative scenarios. During each interview session, users interact with the prototype using a “think-aloud” protocol (Nielsen, 2012; Güss, 2018) by verbally expressing their thoughts as they complete tasks. This includes both positive and negative comments about the product, providing insight into their decision- making process, and helping the interviewer understand the reasons behind their actions.
Integration of Crowdsourced Data Crowdsourcing is the practice of involving volunteers from the general public to collect specific data about a phenomenon or monitor an event in
38 Behzadan and Sivakumar
collaboration with researchers, organizations, or authorities (Montargil and Santos, 2017; Hossain and Kauranen, 2015). Research involving community science and crowdsourced data has grown in recent years. For example, Mayes (2023) examined how credible crowdsourced media can validate or challenge ideas, serving as a proxy for nonprofessional health expertise. In the disaster management domain, a study by Corcuera et al. (2022) found that many mobile applications focus on only one aspect of disaster management or a single type of hazard. However, relying on a single approach to address the various phases of risk management does not align with the complex and multifaceted nature of real-world risks. The study also found that only about one-third of these applications support communication through social networks or SMS. This limitation can hinder efficient communication and coordination, especially in high-risk scenarios where timely, widespread information sharing is critical. Blupix mobile aims to fill these gaps by acting as an integrated platform to provide information in all phases of disaster management.
METHODOLOGY
Research Design This study consists of three interconnected phases: (1) Desk research, which involves a review of existing methods of flood monitoring, analysis of existing tools, understanding design decisions, and gauging user expectations. This helps create a benchmark for initial prototype design; (2) Semi- structured interviews, that entail usability testing with a sample pool of participants who are asked to perform specific tasks on Blupix mobile prototype to gather feedback on core functionalities; and (3) Design iterations, where the outcome of the previous two phases is used to make improvements to the app prototype. The study design and data collection instruments are approved by the Institutional Review Board (IRB).
Phase 1: Desk Research This phase was instrumental in guiding the design of Blupix mobile. It involved a comprehensive review of existing flood monitoring tools, their features, limitations, and underlying technologies, along with crowdsourcing methods and UCD principles applicable to high-risk environments. The review also covered traditional flood detection systems (e.g., in-situ gauges, radar, satellite), advances in computer vision and mobile AI, and prior work on community-based risk communication platforms.
Key findings revealed persistent challenges related to cost effectiveness, low spatial resolution, and infrequent or delayed data sharing. While technologies such as Synthetic Aperture Radar (SAR) provide large-scale flood mapping, they often lack the necessary granularity for street-level detail and are not always available in real time (Lang et al., 2024). In contrast, traditional sensor networks, though reliable, are sparsely deployed across the built environment and require continuous calibration, maintenance, or interpolation, leaving many areas vulnerable (USGS, 2024; FEMA, 2025). These findings highlight
User-Centered Design and Usability Evaluation of a Floodwater Depth Estimation 39
the urgent need for more accessible, decentralized, and real-time solutions to support local flood awareness.
Insights from this phase also reinforced our choice to adopt a UCD framework, and helped in framing our approach to selecting a functional feature set for Blupix mobile. For example, the app’s Forum feature was informed by crowdsourcing applications built for fire and earthquake events, such as Lastquake (Bossu et al., 2018) and MyShake (Kong et al., 2019), that have demonstrated the value of community forums and shared reporting in enhancing local situation awareness and trust. In summary, the outcome of this phase informed Blupix’s blended development strategy, combining crowdsourcing with UCD principles to better understanding end-user needs in flood events and lead to operational effectiveness.
Phase 2: Semi-Structured Interviews In this phase, 15 semi-structured interviews were conducted to understand and document participants’ experiences, expectations, and awareness of floods and flood monitoring technologies, while also providing context for their actions and opinions during usability testing. Participant selection and recruitment were conducted in UserInterviews, an online user research platform to ensure a diverse sample considering gender, age, race/ethnicity, geographical location, education level, and household income. The sample group consists of 15 participants, with an even gender distribution of 7 males, 7 females, and 1 non-binary individual. Age distribution ranges from 25 to 64 years, with the largest group (5 participants) in the 25–34 age range, followed by 4 participants aged 45–54. Ethnically, the group is predominantly White or Caucasian (7 participants), with other ethnicities represented by 4 Hispanic/Latino individuals, 2 of mixed White and Latino heritage, and 1 each of Black/African American and Asian descent. Geographically, participants are spread across the United States, with individuals residing in Florida, Georgia, California, Louisiana, Texas, Idaho, South Carolina, Washington, New York, and North Carolina. Regarding education, the majority hold a Bachelor’s Degree (10 participants), followed by 3 with postgraduate degrees, 1 with an associate degree, and 1 with some college experience. Income levels vary, with 5 participants earning between $100,000 and $149,999, followed by 3 earning between $80,000 and $99,999, and smaller numbers in the other income brackets.
Interviews took place via Zoom between January and March 2025, and session audios were recorded for detailed transcription and analysis. Each interview was based on several themes, and included open-ended questions to capture interviewee’s prior experience with flooding, flood awareness, application use cases, wants, and level of frustration with existing technologies. Example questions that were asked in the interview session were, (1) Have you ever experienced a flood or been in a flood-prone area? (2) How do you typically learn about or stay informed about floods in your area? (3) Do you use specific applications or tools to monitor flood conditions? If so, how effective do you find them? (4) Have you ever been frustrated by technology during an emergency or flood? and (5) Would
40 Behzadan and Sivakumar
you find it helpful to receive notifications or alerts about changing flood conditions in your area? with a follow-up question about the kind of alerts deemed to be the most useful to the interviewee.
A two-step usability testing was implemented by dividing participants into two groups. The first version of the Blupix mobile prototype (a.k.a., ver.1) was tested by the initial 60% of the sample group (9 interviewees). Based on their feedback, improvements were made to create a second version (a.k.a., ver.2), which was then tested by the remaining 40% of the sample (6 interviewees). This non-overlapping sample split ensured that two independent groups of participants could give unbiased feedback, which aided us to quickly identify and resolve any major usability errors. Regardless of the group, each participant was given a set of predefined tasks to gauge the intuitiveness and clarity of the prototype. A “think-aloud” protocol (Baxter et al., 2015) was employed; participants verbalized their first impressions and opinions enabling us to document heuristic factors such as cognitive barriers and user reactions, and record decision-making patterns in each task. Interviewee data and session transcripts were further mapped to thematic clusters of awareness, frustrations, wants, and habits to add context to feedback received from participants. Findings were also assessed against heuristic principles such as information hierarchy, ease of use, navigation flow, functionality, and aesthetic clarity (Djamasbi et al., 2011; Lin et al., 1997; Richardson et al., 2021; Lima and von Wangenheim, 2021) to guide design iterations.
Phase 3: Design Iterations Drawing from insights and common themes identified in the previous phase, “how might we” questions were developed to inspire creative solutions, guide design decisions, and navigate errors and conflicts (Rosala, 2021). For instance, it became clear that Blupix mobile should provide real-time floodwater depth data tailored to a user’s location. In addition, crowdsourced updates must be included to report incidents such as roadblocks, fallen trees, and share information about nearby shelters, supply centers, and emergency services. Finally, the app should motivate users to share flood images, helping to grow and engage the community. Guided by these, specific changes were made to the user interface design and functionality of Blupix mobile to reduce cognitive load, enhance user engagement, and increase trust. Examples include introducing clear navigation flows, integrating community-based features, and improving the flood image submission process.
KEY FINDINGS Interview Findings
After analyzing responses from 15 interviews, several recurring themes emerged around personal flood experiences, shortcomings of existing monitoring tools, and desired app features. Participants emphasized the need for real-time updates, precise geolocation, community-based information sharing, and customizable alerts to bridge data gaps and build user trust. Over
User-Centered Design and Usability Evaluation of a Floodwater Depth Estimation 41
half (53%) reported feeling anxious due to vague alerts, while 47% cited frustration with outdated or delayed information during rapidly changing flood events. A notable edge case involved a rural resident near Charlotte, North Carolina, who relies on a community-run YouTube channel for flood updates, due to unreliable official alerts and a lack of local infrastructure. Others expressed frustration with having to consult multiple platforms (e.g., Facebook, Nextdoor) for localized information on roadblocks or shelters, further underscoring the need for integrated, moderated community features in Blupix mobile. Concerns also arose about intrusive monetization strategies in some commercial apps, which can fragment data or overwhelm users. All participants supported push and SMS notifications but stressed the importance of customizing their frequency and geographic range. One interviewee described receiving several alerts during a flood, including irrelevant alerts for neighboring counties, which led them to ignore future messages. Another recounted a false evacuation alert during the 2025 Los Angeles wildfires, which triggered panic before being retracted. This incident illustrates how miscommunication can severely damage public trust, especially when systems meant to ensure safety instead provoke confusion and distress.
Insights From Usability Testing Each interviewee was given a set of usability tasks to understand their first impressions as well as likes and dislikes about the app. A key objective of usability testing was to understand the prototype’s ease of use and intuitiveness. Tasks given to the interviewees were: (1) Show me how you would find out what this mobile app does? (2) Show me how you would find information about flooding near you? and (3) Show me how you would contribute to the community? (this task was given to the second group who interacted with Blupix mobile ver.2). Usability testing results for both versions of the Blupix mobile prototype were categorized using heuristics from the literature, including, (a) information hierarchy, emphasizing the placement of critical data (e.g., floodwater depth) at the top with visual cues, while deprioritizing less urgent information (e.g., weather forecasts), as poor hierarchy can hinder usability (Djamasbi et al., 2011); (b) ease of use, assessed via task completion rates, time on task, and error rates, highlighting the impact of cluttered designs on cognitive load (Alqahtani and Kavakli, 2020); (c) flow and functionality, evaluating whether user interactions are seamless and features perform as intended (Richardson et al., 2021); and (d) aesthetics, which includes visual appeal through color, font choices, white space, and icons to enhance readability and navigation (Lima and von Wangenheim, 2021). In evaluating Blupix mobile ver.1, participants reported confusion about its functionality and underlying algorithm. Poor color contrast limited the ability of some participants to comprehend floodwater depth filters, and the image submission process was seen as unintuitive. While the “depth of water” reference was well-received, the newsfeed search filter was viewed as largely redundant. To address these issues and reduce users’ cognitive
42 Behzadan and Sivakumar
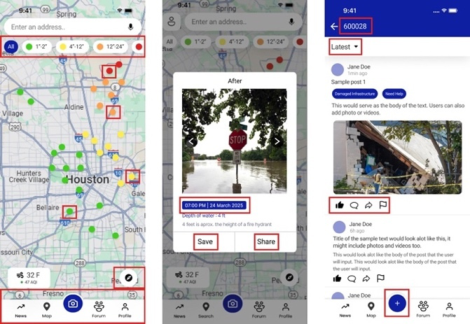
load, several modifications were made to Blupix mobile leading to ver.2 of the app. Further usability testing revealed that almost all interviewees preferred this version due to minimal visual complexity and clear visual hierarchy (Figure 2). The modified version of the app featured the design and placement of the functional elements (e.g., color-coded depth indicators, familiar height benchmarks) and consistently received positive feedback for aiding rapid comprehension and decreased mental blocks, supporting previous research on the importance of minimal cognitive load in user performance during emergencies (Wogalter et al., 1999; Norman, 2013). The first screen in Figure 2 shows the updated map page, which features high-contrast color-coded filters (green, yellow, orange, red) representing increasing floodwater depths ranging from 1 to 24+ inches. The bottom navigation bar has been expanded to include new features such as Profile and Forum, alongside existing functionalities. This screen also highlights that the data points are interactive; selecting one leads to the second screen, which presents an enhanced submission process that includes timestamps and location details. The final screen introduces the new Forum feature, showcasing newly added interactive components, such as share, flag, and comment buttons, implemented in response to user feedback.
Figure 2: The three main user interfaces of Blupix mobile ver.2 include a modified map page (left), submission page (middle), and forum page (right).
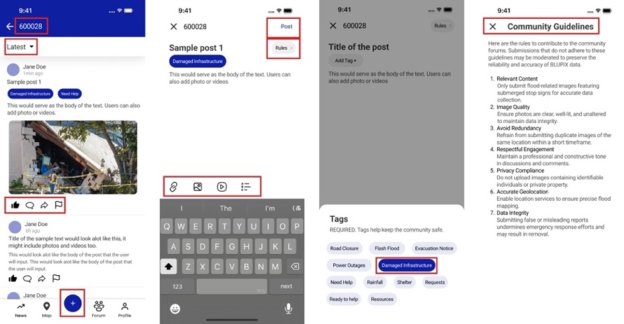
Figure 3 illustrates the user workflow for completing the third task, i.e., contributing to the community, with red boxes highlighting interactive elements. The first screen organizes information by zip code and includes filters for relevance and upload time, while the bottom navigation bar directs users to the contribution feature. The second screen allows users to read guidelines, add tags, write content or upload images, and submit their post. The third screen displays available tags, which are required for each submission to ensure relevance. The final screen summarizes community guidelines on data quality, respectful engagement, and privacy. Interviewees also expressed the need for an in-app tutorial. In response, a five-screen walkthrough was created to explain key features such as image
User-Centered Design and Usability Evaluation of a Floodwater Depth Estimation 43
sharing, underlying AI algorithm, and the use of Forum to enhance situation awareness.
Figure 3: The forum feature of Blupix mobile allows users to contribute to the community.
DISCUSSION AND CONCLUSION This study integrated UCD principles with a mixed-methods approach to develop an intuitive and responsive mobile disaster risk communication tool. By focusing on end users’ needs and behaviors, the Blupix mobile app prototype was refined through iterative design and usability testing to improve both functional performance and trustworthiness. Key improvements, leading to reduced cognitive load and supporting informed decision-making, included restructuring the information hierarchy, enhancing visual clarity, and tailoring content to street-level relevance to address users’ desire for localized and actionable flood data. Participants emphasized the importance of knowing not just what the app does, but how and why, a factor critical to promoting trust in both the system and data. The introduction of the Forum feature allowed users to communicate in real time, verify shared data (e.g., hazards, shelter locations), and contribute to collective situation awareness. Features such as metadata tagging, timestamps, and moderated threads helped ensure the reliability of community-sourced content, further strengthening user trust and engagement. Despite positive reception, some usability issues were identified, including unclear screen navigation, and data syncing problems under poor network conditions. These findings highlight the need for future iterations to incorporate offline-first design, and expanded visual benchmarks for AI-driven floodwater detection. There is also potential to scale the platform for multiple hazard types and other languages, to facilitate its integration with emergency response systems. While promising, findings are limited by the relatively small sample size (n = 15) and simulated testing conditions, and must be broadly validated in real-world flood scenarios. Nonetheless, Blupix mobile represents a scalable and inclusive tool for enhancing flood resilience by supporting community action and emergency response, and contributing to the field of disaster risk communication.
44 Behzadan and Sivakumar
REFERENCES
Alizadeh, B., Li, D., Hillin, J., Meyer, M. A., Thompson, C. M. Zhang, Z., Behzadan, A. H. (2022). Human-Centered Flood Mapping and Intelligent Routing Through Augmenting Flood Gauge Data with Crowdsourced Street Photos, Advanced Engineering Informatics Volume 54. Alizadeh, B. and Behzadan, A. H. (2023). Scalable Flood Inundation Mapping Using
Deep Convolutional Networks and Traffic Signage, Computational Urban Science Volume 3, Article 17. Alqahtani, A. and Kavakli, E. (2020). Usability Evaluation of Mobile Applications for Emergency Alerting: A User-Centered Perspective, International Journal of Human–Computer Interaction Volume 36 No. 5. Baxter, K. Courage, C., Caine, K. (2015) Understanding Your Users: A Practical
Guide to User Research Methods. New York, NY: Elsevier Science. Bossu, R., Roussel, F. Fallou, L., Landès, M., Steed, R., Mazet-Roux, G., Dupont, A., Frobert, L., Petersen, L. (2018). LastQuake: From Rapid Information to Global Seismic Risk Reduction, International Journal of Disaster Risk Reduction Volume 28. Chochoiek, N. (2017) Explaining the success of user-centered design – An empirical
study across German B2C firms, Junior Management Science, Volume 2 No. 1, pp. 81–116. Djamasbi, S., Siegel, M., Tullis, T. (2011). Visual hierarchy and viewing behavior: An eye tracking study. Proceedings of the Human-Computer Interaction International Conference, Lecture Notes in Computer Science, pp. 331–340. Dopp, A. R., Parisi, K. E., Munson, S. A., Lyon, A. R. (2020). Aligning
implementation and user-centered design strategies to enhance the impact of health services: Results from a concept mapping study, Implementation Science Communications Volume 1. FEMA (Federal Emergency Management Agency). (April 8, 2025). Software for Flood Mapping. FEMA Website: https://www.fema.gov/flood-maps/software. Fraustino, J. D., Liu, B. F., Jin, Y. (2012). Social media use during disasters: A
review of the knowledge base and gaps. College Park, MD: START, University of Maryland. Gould, J. D., Lewis, C. (1985). Designing for usability: Key principles and what designers think, Communications of the ACM Volume 28 No. 3, pp. 300–311. Güss, C. D. (2018). What is going through your mind? Thinking aloud as a method
in cross-cultural psychology, Frontiers in Psychology Volume 9, Article 1292. Hirabayashi, Y., Mahendran, R., Koirala, S., Konoshima, L., Yamazaki, D., Watanabe, S., Kim, H., Kanae, S. (2013). Global flood risk under climate change, Nature Climate Change Volume 3 No. 9, pp. 816–821. Hossain, M., Kauranen, I. (2015). Crowdsourcing: A comprehensive literature
review, Strategic Outsourcing: An International Journal Volume 8, No. 1, pp. 2–22. Houston, J. B., Hawthorne, J., Perreault, M. F., Park, E. H., Goldstein Hode, M., Halliwell, M. R., Turner McGowen, S. E., Davis, R., Vaid, S., McElderry, J. A., Griffith, S. A. (2014). Social media and disasters: A functional framework for social media use in disaster planning, response, and research, Disasters Volume 39, No. 1, pp. 1–22.
User-Centered Design and Usability Evaluation of a Floodwater Depth Estimation 45
Hu, P., Zhang, Q., Shi, P., Chen, B., Fang, J. (2018). Flood-induced mortality across the globe: Spatiotemporal pattern and influencing factors, Science of the Total Environment Volume 643, pp. 171–182. Kong, Q., Allen, R. M., Schreier, L., Kwon, Y. W. (2016). MyShake: A smartphone
seismic network for earthquake early warning and beyond, Science Advances Volume 2 No. 2, Article e1501055. Lang, F., Zhu, Y., Zhao, J., Hu, X., Shi, H., Zheng, N., Zha, J. (2024). Flood Mapping of Synthetic Aperture Radar (SAR) Imagery Based on Semi-Automatic Thresholding and Change Detection, Remote Sensing Volume 16 No. 15, p. 2763. Lima, A. L. S., von Wangenheim, C. G. (2021). Assessing the visual esthetics
of user interfaces: A ten-year systematic mapping, International Journal of Human–Computer Interaction Volume 38 No. 2, pp. 144–164. Lin, H. X., Choong, Y. Y., Salvendy, G. (1997) ‘A proposed index of usability: A method for comparing the relative usability of different software systems’, Behaviour & Information Technology Volume 16, No. 4–5, pp. 267–277. Mayes, E. C. (2023). Citizen science in news media: Boundary mediation of
public participation in health expertise, Science, Technology, & Human Values Volume 49 No. 2, pp. 211–237. Montargil, F., Santos, V. (2017). Citizen observatories: Concept, opportunities and communication with citizens in the first EU experiences, in Paulin, A. A., Anthopoulos, L. G. and Reddick, C. G. (eds.) Beyond Bureaucracy: Towards Sustainable Governance Informatisation, Springer, Cham, pp. 167–184. Nielsen, J. (2012) Thinking Aloud: The #1 Usability Tool. Nielsen Norman Group
Website: https://www.nngroup.com/articles/thinking-aloud-the-1-usability-tool/. Norman, D. A. (2013). The Design of Everyday Things. Revised and expanded edition. New York, NY: Basic Books. Preece, J., Rogers, Y., Sharp, H. (1994). Human-Computer Interaction. Reading,
MA: Addison-Wesley. Rentschler, J., Avner, P., Marconcini, M., Su, R., Strano, E., Vousdoukas, M., Hallegatte, S. (2023). Global evidence of rapid urban growth in flood zones since 1985, Nature Volume 622 No. 7981, pp. 87–92 Richardson, B., Campbell-Yeo, M., Smit, M. (2021). Mobile application user
experience checklist: A tool to assess attention to core UX principles, International Journal of Human–Computer Interaction Volume 37 No. 1. Rosala, M. (April 6, 2021). Using “How Might We” questions to ideate on the right problems. Nielsen Norman Group Website: https://www.nngroup.com/articles/h ow-might-we-questions/. Rubin, J., Chisnell, D. (2008). Handbook of Usability Testing: How to Plan, Design,
and Conduct Effective Tests. 2nd ed. Indianapolis, IN: Wiley Publishing. Tellman, B., Sullivan, J. A., Kuhn, C., Kettner, A. J., Doyle, C. S., Brakenridge, G. R., Erickson, T. A., Slayback, D. A. (2021). Satellite imaging reveals increased proportion of population exposed to floods, Nature Volume 596 No. 7870. United Nations Environment Programme. (2024). Climate change and water-related
disasters. UNEP Website: https://www.unep.org/topics/fresh-water/disasters-and- climate-change/climate-change-and-water-related-disasters. USGAO (U. S. Government Accountability Office). (2020). Flood Mapping: FEMA Needs to Address Data and Mapping Limitations That Hinder Flood Risk Management. GAO Website: https://www.gao.gov/products/gao-20-509. USGS (U. S. Geological Survey). (2024). USGS National Streamgaging Network.
Wogalter, M. S., DeJoy, D. M., Laughery, K. R. (1999). Warnings and risk communication. London: CRC Press. World Meteorological Organization. (2021). Weather-related disasters increase
over past 50 years, causing more damage but fewer deaths. WMO Website: https://wmo.int/media/news/weather-related-disasters-increase-over-p ast-50-years-causing-more-damage-fewer-deaths.
LISTED IN THE AHFE DIGITAL BOOKSTORE CATALOGUE
Explore the complete digital volume
Human Interaction and Emerging Technologies (IHIET 2025)
Read this individual research paper free through the original publisher, or explore the full digital proceedings book.
ISBN 978-1-964867-73-1
Explore this ISBN in the AHFE Bookstore ↗Listed in the July 2026 bookstore catalogue; search by ISBN to confirm current availability · Digital book purchase optional