Jan Viebahn, Abdullah Ayedh, Jonas Lundberg, Magnus Bång, Jeroen Keijzers (2025). User experience evaluation of an AI-based decision-support tool for power grid congestion management. In: Human Interaction and Emerging Technologies (IHIET 2025). AHFE Open Access, vol. 197, pp. 1–10. https://doi.org/10.54941/ahfe1006694
The electricity system is changing rapidly, due to the increasing efforts against climate change. In the control room, power grid operators are already being challenged by the changing system behaviour, and maintaining a high level of security of supply is expected to become even more challenging in the future. To cope with these challenges, new tools and functionalities, such as AI-based decision support tools (DSTs) are needed. Developers of future DSTs must consider not only technical aspects, but also whether new systems are usable by power system operators. This study presents a case study of user experience (UX) evaluation applied to a DST for power grid congestion management. The evaluation approach employs a broad range of UX metrics. More precisely, we (i) introduce entirely new UX metrics based on a cognitive analysis of the human-AI interactions, (ii) provide a questionnaire and a set of tasks that are tailor-made for the DST to assess acceptance, trust, and performance, and (iii) apply established generic questionnaires to assess usability and workload. At the same time, the employed methods are mostly simple such that the evaluation requires relatively low effort. The complete end-user population participated in the study, and the DST exhibits high scores in almost all UX metrics. The results form a baseline of summative user research which enables benchmarking of future congestion management tools (or future releases of the same tool).
Introducing artificial intelligence (AI) and automation in safety-critical high- risk domains requires that the whole work process of the joint human- machine system is considered. With humans still crucially being in the loop, the interaction between humans and AI presents challenges that stem from the complex interplay of the necessity for robust and safe decision-making and requirements for transparency, trust, and explainability (Leyli-Abadi et al., 2025). In other words, human and AI capabilities need to be adequately integrated to assure high performance, safety, and satisfaction (Lee et al.,
2017). One way to assess the human-AI interaction is to perform a user experience (UX) evaluation (Albert and Tullis, 2023).
In this study, we document a UX evaluation of the GridOptions tool (Viebahn et al. 2024) which is one of the first AI-based decision-support tools deployed in a control room of a Transmission System Operator (TSO). A TSO is responsible for operating the high-voltage power grid. Congestion is one of the major system risks for power grid operation. It can cause cascading failures which eventually can lead to a major power blackout. Congestion management is a real-world decision problem that is characterized by large action and observation spaces (due to the vast system size), sequentiality (including different time horizons), uncertainty (e.g., due to weather-driven generation sources like renewable energy or measurement errors), behavioural diversity, and multiple objectives (Viebahn et al., 2022). Control centres provide groups of human operators with the necessary working and decision-making environment to remotely monitor the system and properly operate it in real time (Marot et al., 2022). However, deploying AI-based decision support tooling in TSO control rooms is still in its infancy.
The GridOptions tool represents one of the first AI-based decision support tools that is deployed in a control room. It recommends to operators remedial actions to prevent congestion in the intraday timeframe (i.e., within a 24-hour forecast horizon). The underlying approach is based on quality-diversity multi-objective optimization. That is, by providing evidence for and against a range of possible options (instead of providing recommendations that can only be accepted or rejected), it leverages human expertise in decision-making and mitigates issues of over and under-reliance. Hence, the GridOptions tool can be considered as a form of Evaluative AI (Miller, 2023).
In this study, we perform a UX evaluation of the GridOptions tool by (i) introducing entirely new UX metrics based on a cognitive analysis of the human-AI interactions, (ii) providing a questionnaire and a set of tasks that are tailor-made for the GridOptions tool to assess acceptance, trust, and performance, and (iii) applying established generic questionnaires to assess usability and workload. More precisely, the article is structured as follows: In the next section we give a more detailed description of the GridOptions tool from a human factors perspective. Subsequently, we describe the different methods employed in the UX evaluation. Finally, we present the results, and we end with conclusions.
HUMAN ASPECTS OF THE GRIDOPTIONS TOOL Regarding human-AI interaction and levels of automation, the GridOptions tool currently features the assistance mode of human-AI interaction (EASA 2023, Leyli-Abadi et al., 2025). That is, all decisions are taken by the human, and action implementation is fully allocated to the human operator. AI offers cognitive assistance to the human in decision making and action selection. For that, AI can feature high levels of automation in information acquisition and information integration. Subsequently, AI may direct humans’ attention to important system information, integrates it in intuitive and human-friendly ways, and offers (a set of) possible actions.
User Experience Evaluation of an AI-Based Decision-Support Tool 3
To describe what kind of cognitive work is being performed with the GridOptions tool, we use the Levels of Autonomy in Cognitive Control (LACC), proposed in Lundberg et al., 2019. The LACC differentiates between cognitive work that is qualitatively different, in an abstraction hierarchy. Cognitive work can be described at – or as involving – one or several levels. We can describe and exemplify the LACC in power grid congestion management as follows:
1. Physical. The location and status of the physical assets (e.g. lines, transformers, breakers) of the power grid. For the operator, observing the location and status of power grid elements, executing the giving of directions for a specific switching action via telephone. 2. Implementation. A specific plan (i.e., sequence of actions), taking constraints into account (e.g., voltage or current limits when operating a specific breaker). For the operator, organizing the execution of a plan with the colleagues in the control room, in substations, or at other companies; limits on operator abilities to communicate with too many co-workers at the same time. 3. Generic. A plan for substation reconfiguration, that can be potentially reused, that must be adjusted to the congestion situation, as well as to changing goals. Considering the operator, a procedure such as mitigating congestion in a certain region. 4. Values. Performance indicators, such as the degree of safety and efficiency that is achieved, as well as trade-offs such as prioritizing safety over efficiency. Considering the operator, their workload can be described at this level. 5. Goals. The goals that are generic to congestion management, such as safety goals and efficiency goals. The goals that the operators are currently concerned with in their work, such as having a backup plan for possible forthcoming issues in the grid, serving customers, and avoiding overloads by looking ahead. 6. Frames. Power grid situations, such as congestion, voltage violation, maintenance execution – and the situations as observed by the operator.
METHOD
This study employs a lightweight methodology consisting of an easy-to- implement set of techniques, including newly defined UX metrics, tailor-made tasks, and established generic questionnaires. Due to page limitations, the questionnaires and tasks are not included in the article but can be shared on request.
New UX Measures Based on Joint Control Framework To assess cognitive patterns of human-AI interaction (CPHAI), we employ the Joint Control Framework (JCF) (Lundberg and Johansson, 2021). The JCF focuses on describing the execution of activities as processes (e.g., sensing, deciding, and action implementation) when those are distributed over different cognitive levels (and possibly different agents) by putting
(a sequence of) activities on a timeline and describing on which abstraction level the system needs to be perceived. The cognitive levels correspond to the six LACC described in the previous section.
The JCF can be used for both (i) describing actual (e.g., recorded) human-machine interactions for a given user interface, and (ii) designing a user interface by mapping out the expected human-machine interactions. Discrepancies between actual and expected interaction patterns can hint at design flaws. Consequently, we introduce two new UX metrics. The CPHAI design accuracy (CPHAI-DA) measures the similarity between the expected and the measured CPHAI. The CPHAI consistency across users (CPHAI-CU) measures how variable the CPHAI are across the user population.
Tailor-Made Set of Tasks and Questionnaire To assess performance, we measure the performance metric task success. It measures how effectively users are able to complete a given task (Albert and Tullis, 2023). Realistic tasks are often composed of a series of sub-tasks. Hence, we a perform a cognitive walkthrough (Rieman et al., 1995) with the human operators. This usability evaluation method relies on a detailed series of sub-tasks, and it is specifically limited to considering whether the user will select each of the correct actions along the solution path. The walkthrough procedure consists of a specific description of the sub-tasks to be performed with the system, and a list of the correct actions required to complete each of these tasks with the interface being evaluated. We custom-designed 11 sub- tasks for the GridOptions tool. For each sub-task, we measure the level of success: failure (the user gave up or thought it was complete, but it wasn’t), partial success (with assistance), complete success (without assistance).
To assess the acceptance of the user group with respect to the AI component of the decision support tool, we created a tailor-made questionnaire based on the Madsen and Gregor’s Trust questionnaire (Long et al., 2020). The questionnaire specifically focuses on measuring general confidence and familiarity with AI decision support tools as well as acceptance (after initial use) for daily use.
Established Questionnaires for Workload and Usability To assess the perceived workload, we employ the multidimensional NASA Task Load Index (NASA-TLX) (Hart and Staveland, 1988). There are six scales for TLX: Mental Demand, Physical Demand, Temporal Demand, Frustration, Effort, and Performance. Respondents rate the system on each of the six dimensions using 10-point scales from Low to High.
To assess the perceived usability, we employ the widely used System Usability Scale (SUS) (Perrier et al., 2023). It consists of 10 statements to which users rate their level of agreement. Half of the statements are positively worded and half negatively worded. A 5-point Likert scale of agreement is used for each.
Experimental Setup The user group of the GridOptions tool currently consists of 8 the senior operators. The entire population was available for this study. All sessions
User Experience Evaluation of an AI-Based Decision-Support Tool 5
were carried out in the control room, and with one operator per session. The sessions happened in two waves. In the first wave, a session was hold with each of the 8 senior operators in which the Trust and Acceptance questionnaire was filled in and the cognitive walkthrough was performed. The second wave of sessions included three of the 8 operators. Two operators were chosen based on their excellent performance results in the cognitive walkthrough (i.e., task success) to make sure that the subsequent measures were not influenced by unfamiliarity with the tool. Moreover, to check if this could have any influence at all, a third operator was chosen with less good performance results. With each of the three operators a session was conducted in which they received a small number of high-level tasks. They freely executed each task while these episodes of human-AI interaction were recorded. Subsequently, the operators filled in the NASA-TLX and SUS questionnaires.
RESULTS
Cognitive Patterns of Human-AI Interaction
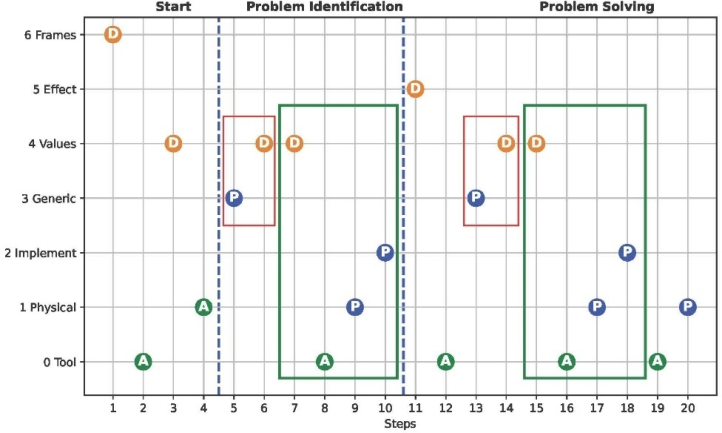
Figure 1 shows the JCF drawing derived from the recordings of the human operators interacting with the GridOptions tool. In Table 1, each step is characterized in detail. The overall CPHAI consists of three sub-tasks, namely, Start, Problem Identification, and Problem Solving. In the first step, the highest-level framing of the situation occurs, that is, the decision by the operator to perform the congestion analysis of the next day using the GridOptions tool. Subsequently, the operator opens the GridOptions tool. In the third step, the operator decides which model data exactly needs to be used, and in the fourth step the operator activates the corresponding data in the GridOptions tool. The fourth step is the only action point which is not on the Tool level since it is currently the only action in the GridOptions tool which determines the data shown in all subsequent views. All other action points only select specific views of pre-determined data.
Figure 1: JCF drawing of how human operators interact with the GridOptions tool.
With step 5 the problem identification begins. The operator perceives a high-level overview table of the default strategy. Then the operator identifies the congested hours (step 6), and subsequently decides to take a more detailed look (step 7). In step 8, an additional table with more detailed information related to the default strategy is opened. The operator investigates which grid elements exactly are overloaded (step 9), and how much different elements are overloaded relative to each other (step 10). This concludes the problem identification sub-task.
With step 11 the operator initiates problem solving. The operator decides that remedial actions are needed. For that, he enlarges the high-level overview table with additional strategies proposed by the GridOptions tool (step 12). Subsequently, a cognitive sub-pattern of human-AI interaction occurs that already appeared in the problem identification sub-task (compare steps 5–10 and 13–18). The difference is that now the operator looks at strategies that mitigate the congestion observed in the default strategy. Finally, in steps 19– 20 the operator opens a substation view in order to see which switching actions exactly are needed to mitigate the congestion.
Table 1: JCF table of human operators interact with the GridOptions tool.
Table available in the original PDF paper.
STEP QUESTION LEVEL POINT SUB-TASK DESCRIPTION 1 Why Frames Decision (D) Start Do congestion analysis 2 How Tool Action (A) Start Open decision-support tool 3 What Values Decision (D) Start Decide on day and version 4 How Physical Action (A) Start Choose the data source 5 What Generic Perception (P) Identification Look at high-level default strategy 6 What Values Decision (D) Identification Identify congestion 7 What Values Decision (D) Identification Decide to see more details 8 How Tool Action (A) Identification Open detailed load flow table 9 How Physical Perception (P) Identification Look at specific grid elements 10 How Imp Perception (P) Identification Identify element loading in space 11 Why Effect Decision (D) Solution Remedial actions are needed 12 How Tool Action (A) Solution Add strategies to high-level table 13 What Generic Perception (P) Solution Look at high-level strategies 14 What Values Decision (D) Solution Identify best strategy 15 What Values Decision (D) Solution Decide to see more details 16 How Tool Action (A) Solution Open detailed load flow table 17 How Physical Perception (P) Solution Look at specific grid elements 18 How Imp Perception (P) Solution Identify element loading in space 19 How Tool Action (A) Solution Open substation drawing 20 How Physical Perception (P) Solution See exact switching actions
Table 2 shows the scores for the two new UX metrics CPHAI-DA and CPHAI-CU. The CPHAI-DA is 100% which indicates that the users did not exhibit any unexpected behaviour. In other words, the CPHAI shown in Fig. 1 is exactly as expected by design, no unforeseen interactions happened. Moreover, CPHAI-CU is very close to 100%. This means that the individual CPHAI of the different operators are very similar. The only observed deviations from the CPHAI shown in Fig. 1 are related to operators omitting steps 19–20 at times since they already know the specific switching actions.
User Experience Evaluation of an AI-Based Decision-Support Tool 7
Table 2: Scores of the different UX metrics. All scores range between 0 and 100.
Table available in the original PDF paper.
The mean and standard deviation (sd) across users are shown except for the CPHAI metrics. The CPHAI metrics are computed as 100 – sd with the CPHAI shown in Fig. 1 used as mean.
Metric Score # Users Interpretation Design accuracy 100 3 Perfect match Consistency across users 99.3 3 Very high consistency Performance 90 ± 6.1 8 High task success Workload 0.0 ± 0.0 3 Minimal workload Usability 91.7 ± 0.5 3 Excellent usability Trust 69.2 ± 2.0 8 Moderate trust
Task Success
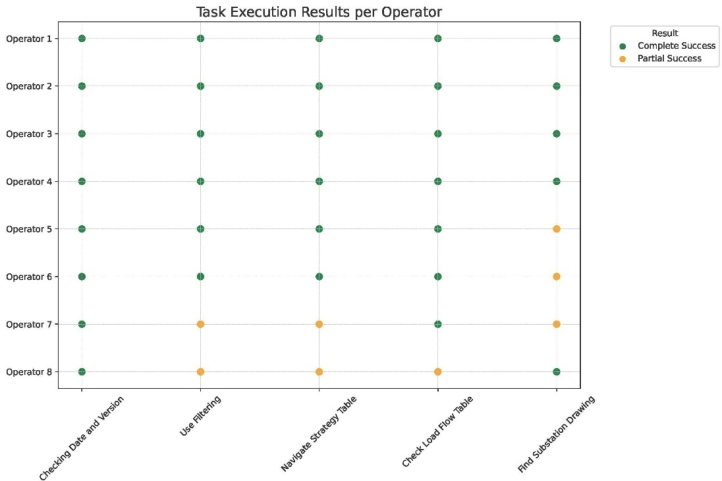
Figure 2 shows the results of the cognitive walkthrough per operator. Operators 1–4 exhibit perfect performance, that is, they completed all tasks flawlessly without encountering any issues. Also operators 5–6 could handle the tool on their own except for the last tasks related to the substation drawings where they asked a question. Finally, operators 7–8 more often asked for assistance but still could proceed to the end. In summary, all operators were able to complete the entire cognitive walkthrough (i.e., no single failure) and most of them could work without assistance. This is also reflected in the high overall performance score in Table 2.
Figure 2: Results of the cognitive walkthrough per operator.
Workload and Usability
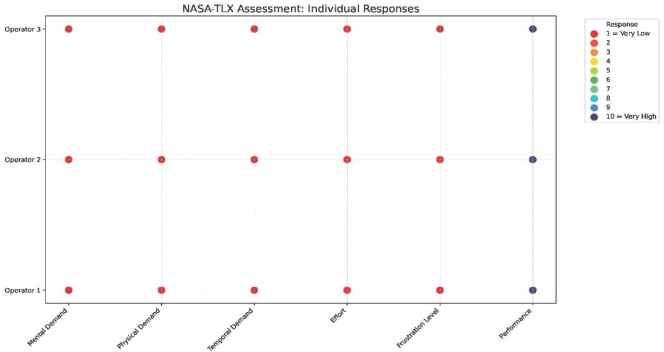
Figure 3 shows the perceived workload per operator, and the corresponding overall score is shown in Table 2. The results indicate that the perceived workload is minimal. In all ‘negative’ dimensions (Mental Demand, Physical Demand, Temporal Demand, Frustration, Effort) are rated very low, whereas performance is rated very high for all operators.
Similarly, the perceived usability has a high overall score as shown in Table 2. The ‘negative’ dimensions (complex, support needed, inconsistency, heavy to use, a lot of learning required) are all rated very low for all operators (not shown), whereas the rating of the ‘positive’ dimensions (use frequently, easy to use, well integrated, learn quickly, confident usage) are rated high except for ‘well integrated’ with values of 3–4.
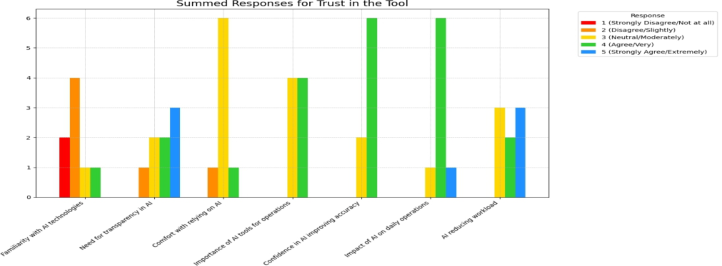
Figure 3: Results of the NASA-TLX per operator.Figure 4: Results of the AI trust and acceptance questionnaire.
User Experience Evaluation of an AI-Based Decision-Support Tool 9
AI Trust and Acceptance Finally, Figure 4 shows the results of the AI trust and acceptance survey. The user group exhibits low familiarity with AI tools, shows diversity regarding the need for transparency, and is neutral in relying on AI. Regarding the potential of AI in supporting the operator’s work the (rather conservative) user group is positive. Hence, the overall sentiment towards AI decision support tools is moderately positive (see Table 2).
DISCUSSION
This study forms a baseline of summative UX research which enables benchmarking of future congestion management tools (or future releases of the same tool). Using a broad range of UX metrics, the study demonstrates how an AI-based DST can be evaluated in a quantitative and multifaceted way with relatively low effort. The results indicate that even for a user group with moderate trust the DST exhibits favourable overall scores in terms of usability, workload, and consistency across users.
The setup can be extended in several directions. First, it would be interesting to see if different participants or different test situations would lead to different results. Regarding the trust scale, people with a lower score might act differently when using AI tools. With low workload (as reported here), they would be expected to (want to) check the AI more when testing it. Whether usage of this tool supports the building of trust from a low starting point is thus an open question. It is also possible that a high workload or otherwise more stressful situation would give other outcomes. The test did not include situations where the AI would give a less ideal solution, further tests could include testing whether detecting and addressing these issues are also supported by the tool, and how this is shown in the different analyses. Since the participants did not do many mis-steps here, recovery is another avenue for further study.
Second, the JCF analysis could be complemented by additional scores. For example, the JCF showed that some steps were optional due to experience (having built mental models), and also showed repeat patterns in the interactions. Potentially, the two CPHAI scores proposed here could be complemented with a repeat patterns score, in larger systems.
Finally, the used AI-based DST (i.e., the GridOptions tool) is still rather simple and could be advanced in several directions (outlined in Leyli-Abadi et al., 2025). In particular, the DST currently only features the assistance mode of human-AI interaction. Future releases might also feature a teaming mode of human-AI interaction including more extensive collaboration and cooperation between human and AI (EASA, 2023). In this case, the JCF analysis would also include cognitive levels on the AI side which would lead to more complex and divers CPHAI, again potentially motivating complementary UX metrics.
ACKNOWLEDGMENT
AI4REALNET has received funding from European Union’s Horizon Europe Research and Innovation programme under the Grant Agreement
No 101119527. Views and opinions expressed are however those of the authors only and do not necessarily reflect those of the European Union. Neither the European Union nor the granting authority can be held responsible for them.
REFERENCES
Albert, B., Tullis, T. (2023). Measuring the user experience. Elsevier. EASA (2023). Artificial Intelligence Roadmap 2.0: A human-centric approach to AI in aviation. European Union Aviation Safety Agency, EASA. Hart, S. G., Staveland, L. E. (1988). “Development of NASA-TLX (Task Load Index):
Results of empirical and theoretical research”. In: Hancock, P. A., Meshkati, N. (eds.) Human Mental Workload, pp. 139–183. North Holland, Amsterdam. Lee, J. D. et al. (2017). Designing for People: An Introduction to Human Factors Engineering. CreateSpace Independent Publishing Platform. Leyli-Abadi, M. et al. (2025). “A Conceptual Framework for AI-based Decision
Systems in Critical Infrastructures”, submitted. https://arxiv.org/abs/2504.16133. Long, S. K., Sato, T., Millner, N., Loranger, R., Mirabelli, J., Xu, V., Yamani, Y.
(2020). “Empirically and theoretically driven scales on automation trust: A multi- level confirmatory factor analysis”. In: Proceedings of the Human Factors and Ergonomics Society Annual Meeting, vol. 64. Los Angeles, CA, pp. 1829–1832. SAGE Publications. Lundberg, J., Bång, M., Johansson, J., Cheaitou, A., Josefsson, B., Tahboub, Z. (2019). “Human-in-the-loop AI: Requirements on future (unified) air traffic management systems”. IEEE/AIAA 38th Digital Avionics Systems Conference (DASC), San Diego, CA. Lundberg, J., Johansson, B. J. E. (2021). “A framework for describing interaction between human operators and autonomous, automated, and manual control systems”. Cognition, Technology & Work 23, 381–401. Marot, A., Kelly, A., Naglic, M., Barbesant, V., Cremer, J., Stefanov, A., and J.
Viebahn (2022). “Perspectives on future power system control centers for energy transition,” in Journal of Modern Power Systems and Clean Energy, vol. 10, no. 2, pp. 328–344. Miller, T. (2023) “Explainable AI is Dead, Long Live Explainable AI!: Hypothesisdriven Decision Support using Evaluative AI”, FAccT ‘23: Proceedings of the 2023 ACM Conference on Fairness, Accountability, and Transparency. Perrier, M. J., Louw, T. L., Carsten, O. M. (2023). “Usability testing of three visual
HMIs for assisted driving: How design impacts driver distraction and mental models. Ergonomics 66(8), 1142–1163. Rieman, J., Franzke, M., Redmiles, D. (1995). “Usability evaluation with the cognitive walkthrough”. Paper presented at the conference companion on Human factors in computing systems. Viebahn, J., Kop, S., van Dijk, J., Budaya, H., Streefland, M., Barbieri, D.,
Champion, P. et al. (2024). “GridOptions Tool: Real-world day-ahead congestion management using topological remedial actions”, CIGRE Science & Engineering, vol. 35, pp. 1–15. Viebahn, J., Naglic, M., Marot, A., Donnot, B., and S. Tindemans (2022). “Potential and challenges of AI-powered decision support for short-term system operations,” in CIGRE Paris Session 2022.
LISTED IN THE AHFE DIGITAL BOOKSTORE CATALOGUE
Explore the complete digital volume
Human Interaction and Emerging Technologies (IHIET 2025)
Read this individual research paper free through the original publisher, or explore the full digital proceedings book.
ISBN 978-1-964867-73-1
Explore this ISBN in the AHFE Bookstore ↗Listed in the July 2026 bookstore catalogue; search by ISBN to confirm current availability · Digital book purchase optional