Chris Wales, Ingvar Tjostheim (2025). Digital vulnerabilities and the oldest-old. In: Human Interaction and Emerging Technologies (IHIET 2025). AHFE Open Access, vol. 197, pp. 119–128. https://doi.org/10.54941/ahfe1006705
While physical and cognitive degeneration can limit older citizens from accessing beneficial digital services (Heponiemi et al., 2023), many lead digitally active lives well into their oldest years. However, those who are more digitally active may be susceptible to fraudulent behaviour, through such life circumstances as loneliness (Liao et al., 2024). In this paper we will build upon a study undertaken with two groups of pensioners, firstly with those aged 70-79, or “Young-Old” combined with “Middle-Old” which investigated how their characteristics and the way they make decisions can increase their susceptibility to digital deception. In this new study we are concerned with understanding how vulnerable our most senior, and often frailest, citizens, or the “oldest-old” feel towards their vulnerability to digital fraud, and the potential negative effect on happiness and quality of life. According to Vincent (2023, pp. 36-37) this age group has often been “ignored” in studies, becoming “invisible”, or treated separately from younger groupings. despite the increasing numbers living to an older age, of containing many of those adopters of digital technology Wu & Gu (2021) discuss how although there is lack of consensus on the age bandings within the “fourth age”, the category “oldest-old” often refers to digital usage, those over the age of 85 in developed economies, while over 80 in developing economies. In this study, we distinguish between two age groups: Group 1 (70–79 years old) with 273 respondents, and Group 2 (80+ years old) with 111 respondents. All respondents reported whether they had experienced identity theft, credit card misuse, or a similar fraud incident. The percentages for the two groups were 23% and 22%, respectively. Has experienced fraudHas not experienced fraudAge 70-79 years old23 77Age 80+ 22 78The questionnaire included three quality-of-life questions, measured using a Likert scale ranging from 0 to 10. For the statistical analysis, responses were categorized as follows: scores of 0–5 were classified as low, 6–7 as medium, and 8–10 as high. Descriptive statistics, presented in the table below, indicate that the oldest-old respondents who had experienced fraud had a lower overall quality-of-life score compared to the middle-old respondents.Quality of life indicators Meaningful life Life satisfactionHappiness in life % reported low % reported low% reported lowAge 70-79, Has experienced fraud or misuse of information11 14 27Age 80+, Has experienced fraud or misuse of information21 17 50 In this paper, we will present a binary logistic regression analysis to identify significant predictors for experiencing fraud versus not experiencing fraud, comparing the middle-old and the oldest-old age groups.ReferencesHeponiemi, T., Kainiemi, E., Virtanen, L., Saukkonen, P., Sainio, P., Koponen, P., & Koskinen, S. (2023). Predicting Internet Use and Digital Competence Among Older Adults Using Performance Tests of Visual, Physical, and Cognitive Functioning: Longitudinal Population-Based Study. J Med Internet Res, 25, e42287. https://doi.org/10.2196/42287 Liao, S., Wang, X., & Zhang, X. (2024). Loneliness could lead to risk of fraud victimization for middle-aged and older adults. Journal of Elder Abuse & Neglect, 36(5), 508-527. Vincent, J. (2023). Life stage or Age? Reviewing perceptions of oldest digital technologies users. In Digital Ageism (pp. 36-52). Routledge. Wu, Q., & Gu, D. (2021). Oldest-Old Adults. In D. Gu & M. E. Dupre (Eds.), Encyclopedia of Gerontology and Population Aging (pp. 3637-3653). Springer International Publishing. https://doi.org/10.1007/978-3-030-22009-9_1121
While physical and cognitive degeneration can limit older citizens from accessing beneficial digital services (Heponiemi et al., 2023), many lead digitally active lives well into their oldest years. However, those who are more digitally active may be susceptible to fraudulent behaviour, which is becoming increasingly insidious and dynamic in character.
In this paper we focus upon older people’s self-perception of vulnerability to cybercrime and how they view digital services and technology they are more and more required to understand and engage with. We build upon two previous studies undertaken with two groups of “younger” pensioners (Tjostheim & Halbach, 2025). This study additionally includes data from those often categorised as the “oldest-old”. Wu & Gu (2021) discuss how
although there is lack of consensus on the age bandings within the “fourth age”, the category “oldest-old” often refers to those over the age of 85 in developed economies, and over 80 in developing economies. According to Vincent (2023), this age group has often been “ignored” in studies, becoming “invisible”, or treated specially and separately from younger groupings. This, despite the increasing numbers living to an older age, includes many of whom, at a younger age, were amongst the earliest adopters of digital technology.
The true extent of cyberfraud amongst older people remains unclear. There is perceived to be a stigma attached to older people reporting that they have fallen for fraud-related cybercrime, that leads to under-reporting (Burton et al., 2022). In a qualitative study, Havers et al. (2024) noted how respondents’ reasons for not reporting falling for digital fraud were framed by both “interpersonal and corporate digital ageism”, whilst Money et al.’s (2024) findings indicate “generational barriers” that respondents perceive to hinder them engaging with digital platforms and services, and the devices required to, amongst other things, access them. As a result, stereotypes have been seen to be recursive, cementing the self-perception of older people themselves, as well as within the wider society (Field & Gueldner, 2001; Zou et al., 2024).
Furthermore, with regard to perceptions of vulnerability, Zou et al.’s (2024) informants, seniors 65+, largely believed their elderly peers, although not they themselves, to be more at risk and more susceptible to cyberfraud than younger people, due to a lack of digital competence. Cross’s (2016) research amongst volunteer support staff, of whom many were seniors themselves, showed how older victims of fraud were perceived to be inherently frail and susceptible. However, despite any misconception, Cross considered such attitudes might in turn lead to initiatives and support structures being put in place.
With regard to factors determining vulnerability of older people to fraudulent cybercrime, Shao et al. (2019) literature review revealed seven factors. The authors outline key risk factors of “an overly trusting nature psychological vulnerability, social isolation, risk-taking, and basic knowledge/informational literacy1”, where an overly trusting nature is considered a chief causal factor in the susceptibility of older people to fraud (Shao et al., 2021). Zou et al. (2024, p. 144) warn that “excessive trust [in service providers could lead] to delegation or even abandonment of useful protective strategies”. As other researchers have also noted, the authors challenge the way issues of vulnerability are framed with regard to older people, noting that many factors also apply to other age-brackets of society.
For this paper we formulated three research questions: to what extent are the oldest citizens more vulnerable to cyberfraud than younger pensioners? Secondly, are conformity and perceived low digital competence predictors, if at all, of fraud? Thirdly, does willingness to share passwords predicate falling victim to cyberfraud?
1Which they argue can lead to poor fraud awareness (p. 233).
Digital Vulnerabilities and the Oldest-Old 121
A SURVEY ABOUT DIGITAL VULNERABILITIES, CONFORMITY AND ICT SKILLS Our participants were members of The National Association of Retirees in Norway (NBF). Before we sent the questionnaire to individual email addresses, a workshop was conducted, presenting issues of digital vulnerabilities and to inform the pensioners about the questionnaire. The pensioners present at the meeting could fill in the questionnaire online, or together with the researchers.
Studies on the survey’s method (Krosnick, 1991; MacKenzie & Podsakoff, 2012) show that we cannot always assume honest and correct answers. Sometimes respondents do not remember an incident or want to repress a negative event. Before the Likert-scale questions about ID-theft and credit- card misuse, we asked the respondents to tell us about what happened to them concerning fraud incidents, where some respondents provided specific and valuable additional information of the incidents themselves. We therefore consider that the answers to this question are reasonably accurate.
In general, this type of survey with questions about ID-theft and card- misuse are used for statistical purposes, such as those carried out by Eurostat (European Union, 2017). With this method of recruiting respondents, we think reliable results can be assumed.
To characterise our participants (N = 572), we present the demographic profile in Table 1 and Table 2 for the four age-groups that we use in our analysis. The demographic profile for our participants is:
Table 1: Gender and the age profile of the participants.
Table available in the original PDF paper.
Equation reproduced from the original PDF.Equation reproduced from the original PDF.Equation reproduced from the original PDF.Equation reproduced from the original PDF.
As can be seen from Table 1, the greater majority of our respondents fall into the category of “middle-old”, that is between the ages of 75–84 years (Lee et al., 2018). In this grouping, there is a majority of female respondents. In Table 3 below, it can be seen that the majority of female respondents live alone, whilst male respondents were more likely to be living with a partner.
Table 2: Descriptive statistics, living arrangements of the participants.
Table available in the original PDF paper.
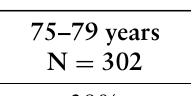
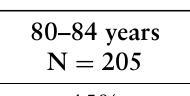
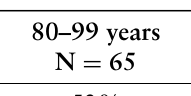
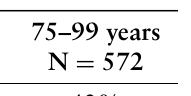
Living Alone Living With a Partner 75–79 years, N = 302 Male 24% 76% Female 60% 40% 80–84 years, N = 205 Male 29% 71% Female 72% 28% 85–99 years, N = 65 Male 38% 62% Female 74% 26%
122 Wales and Tjostheim
The survey was filled in by the respondent on either a PC, a tablet or a mobile phone. This method is a self-reported measurement, therefore we cannot test whether or not the respondents are actually telling the truth. In general, we assume that data is reliable for large scale, anonymous surveys when an invitation comes from an association that respondents are members of.
Table 3: Descriptive statistics of the variables and measurements (N = 572).
THE MEASUREMENTS IN THE STUDY The respondents answered questions about whether they personally had experienced ID-theft or credit-card misuse, and an open question about fraud-incidents. For ID-theft and credit-card misuse, the questions were identical to the questions used in surveys by the national bureau of statistics in Norway and the Eurostat-survey on European attitudes toward cyber security (European Union, 2017).
We designed a question about a parliamentary general election. Norway has previously trialled elections via digital platform, so-called Internet-voting, as well as carrying out digital national referendums. In these cases, for those that choose to, or were required to use Internet-voting, their national bank-ID needed to be used to log-on to the voting system. According to the national law, when voting, it is not allowed to share any information with anyone about the log-on or the ballot. We designed a scenario about voting electronically in a parliamentary election, where respondents were asked whether they would manage to vote alone or would ask for help from a trusted person. In the latter case the other person would be able to see the voter’s password and who they voted for. A yes-answer to this question indicates a high willingness to share personal data.
We also tested self-reported levels trust, both interpersonal and with authorities, conformity, ICT competence and level of usage as well as whether or not they personally had experienced fraud.
Table 3 shows descriptive statistics for all 13 variables. Kurtosis indicates the extent to which a distribution of scores is relatively flat or relatively peaked. Skewness indicates the extent to which scores have a tendency toward the upper or lower end of a distribution. There is a skewness problem
Digital Vulnerabilities and the Oldest-Old 123
if the result is greater than +/– 2.0, which is the case for the variable ‘sharing password’, where both skewness and kurtosis are peaked. The sharing password does not meet the criteria, but we still consider this factor as relevant for the study.
In total, across all age-groups, 26.6% reported that they had fallen for fraud in one form or other. It means approximately one-in-four of our respondents are the victims of some form of fraud or identity theft, which indicates a significant societal problem, given that we assume that those completing our survey had a relatively high digital confidence and motivation to be involved in the study. In our analysis falling victim is used as the dependent variable.
Table 4 shows that there are no (or only minor) differences between three age-groups regarding falling victim to fraud with the current year. An argument for analysing age-groups separately and not all age-groups together, is differences in sharing-frequency between the groups. The differences between the age groups are minor and insignificant. We used the non- parametric Kruskal Wallis and Wilcoxon (Mohr et al., 2021) signed-rank tests to assess the significance of any differences found between participant groups. As Table 4 shows the results were not significant for the three ages groups.
Table 4: Percentages that have fallen for fraud- the three age-groups.
Table available in the original PDF paper.
75–79 Years 80–84 Years 85–99 Years 75–99 Years Male (N = 241) 26% 33% 24% 29% Female (N = 331) 23% 27% 29% 25% All (N = 572) 25% 30% 26% 26,6%
Kruskal Wallis test for experience of fraud: 1,403, df 1 Assym. Sig 0,236 (not significant) The Analysis With Binary Logistics
Binary logistic regression is a form of regression analysis. The dependent variable is a dichotomy variable coded as 0 or 1. The independent variables can be of any type, for instance continuous and categorical variables. We first report the four models’ statistical summaries that include the Hosmer- Lemeshow test (Hosmer & Lemeshow, 1989) with the threshold criteria of > 0.05. The Hosmer-Lemeshow test is often used as a goodness of fit test. As we can see in Table 5 the criteria are met, even though the numbers are quite small.
The Wald statistic (Hosmer & Lemeshow, 1989) identifies variables of significance in each of the three models. This is the square of the t-statistic and gives equivalent results for a single parameter. It can be used to test the significance of particular predictors in a statistical model. We chose backward Wald for selecting how independent variables are entered into the analysis. With backward Wald, all the predictor variables chosen are added into the model, and those variables that do not (significantly) predict anything on the dependent measure are removed, one by one, from the model.
124 Wales and Tjostheim
Table 5: Model summaries, the final model for each of the three age-groups.
Table available in the original PDF paper.
Model summary, Age-group 75–79 years - -2 Log likelihood Cox and Snell R square Nagelkerke R square Step 5 328.194 0.027 0.040
Hosmer and Lemeshow Test Chi-square df Sig. Step 5 2.659 3 0.447
Model summary, Age-group 80–85 years -2 Log likelihood Cox and Snell R square Nagelkerke R square Step 6 234.830 0.070 0.099
Hosmer and Lemeshow Test Chi-square df Sig. Step 6 5.820 8 0.667
Model summary, Age-group 85–99 years -2 Log likelihood Cox and Snell R square Nagelkerke R square Step 9 67.724 0.102 0.149
Hosmer and Lemeshow Test Chi-square df Sig. Step 7 6.338 7 0.501
In Table 6 we present step 1 in the binary logistic regression analyses that includes all independent variables. In reviewing the numbers in step 1, a high Wald-score is an indication of what can be expected in the final model. The non-significant independent predictors (variables) are removed step-by-step. In the final step, only the significant predictors (<0.1) remain.
Table 6: Descriptive statistics of the variables in the final step for the three models.
Table available in the original PDF paper.
Variable Code Beta Est. SE Wald df Sign. Exp (B) Age 75–79 years Sharing password (voting
scenario) Cautious or TrustPeople -0.355 0.196 3.297 1 0.069 0.701 Digital Competence1, I can
-0.393 0.186 4.486 1 0.034 0.675
find a solution on a tech problem Digital Competence3, I can
0.285 0.155 3.383 1 0.066 1.330
install a software Constant -0.666 1.194 0.312 1 0.577 0.514
Continued
Digital Vulnerabilities and the Oldest-Old 125
Table 6: Continued Variable Code Beta Est. SE Wald df Sign. Exp (B)
Table available in the original PDF paper.
Age 85–99 years Conformity 0.773 0.424 3.323 1 0.068 2.167 Digital Competence1, I can
0.890 0.436 4.172 1 0.41 2.436
find a solution on a tech problem Digital Competence3, I can
-0.538 0.308 3.053 1 0.81 0.584
install a software Constant 3.878 1.495 6.726 1 0.010 0.021
The three final models in Table 6, show the significant predictors for each of the three age-groups. For the 75–79 age-group, there are two significant predictors, the sharing password and the digital competence3 “I can install a software”, which we consider, in line with Schwarz et al. (2024) a measure of problem-solving and continuing learning. These two variables are predictors for the next age-group 80–84. For the age-group 80-84, also gender (male) and digital competence I can find a solution to a tech problem are significant predictors. In the questionnaire, the scale is from low to high. Hence a negative Beta reveals that a low score is a predictor. Finally, for the age- group 85–99 years, conformity and the two digital competence variables are the significant predictors.
Following binary logistic regression, we include the classification table, presenting correct and incorrect percentages for the groups ‘has experienced fraud’ (coded as 1) and ‘has not experienced fraud’ within the last 12 months (coded as 0). The higher the percentage, the better the variables function as good predictors.
Table 7 therefore shows how for all three age-groups the prediction in the final models are above 60%. Whether these percentages are satisfactorily high is not a straightforward question. The respondent answers the questions in the survey about fraud and misuse incidents and has to rely on his/her memory. A percentage around 60 indicates that also other factors matter. Research and police reports indicate that criminal activity is becoming more and more sophisticated in this area. This is concurrent with an increasing requirement to communicate electronically with trusted businesses, like the postal service and when travelling, and with governmental authorities, thus increasing our digital engagement and activity. We are all, therefore, vulnerable. In general, it is assumed that criminals target individuals with low digital competence and perceived naivety.
Table 7: Classification table - the binary logistics prediction of the three groups.
Table available in the original PDF paper.
Percentage
Not Experienced
Has Experienced Correct Misuse (Numbers) Misuse (Numbers)
75–79 years 0 145 83 63.6% 1 37 37 50.0% 60.3% Continued
126 Wales and Tjostheim
Table 7: Continued
Table available in the original PDF paper.
Percentage
Not Experienced
Has Experienced Correct Misuse (Numbers) Misuse (Numbers)
In this study we collected data about elderly citizens’ self-perceptions of vulnerability to cyberfraud, their perceived level of digital competence and their trust in authorities and those within their closet support networks. We undertook the survey in cooperation with the national organization for pensioners, NBF, (The national association of retirees), through a survey of their members, with a sample from 75 to 93 years old, in total 572 citizens. Our analysis of responses was based upon binary logistic regression, with the aim of being able to predict a categorical dependent variable, in our case whether a person has been victim of fraud. We included the following independent variables: gender, ICT skills, trust in public institutions, conformity, willingness reveal their password, a self-reported risk-measure.
Our results are inconclusive with regard to whether the oldest are more vulnerable to cyberfraud. Additionally, it appears less related to personal traits, than is generally assumed. What we do notice is that it appears more linked to behaviour, for example, that willingness to share passwords makes one more at risk for fraud. Additionally, we also see that the likelihood of falling victim to fraud does not necessarily increase based on chronological age alone. High levels of conformity seem to make the oldest- old more vulnerable compared to the youngest- and middle-old, but we have a relatively small sample so this must be investigated further. This is an interesting finding to follow up, with regard to predilection for our oldest citizens, for whom conformity may place them at more risk.
Another interesting finding is that willingness to share passwords combined with a self-reported high competence, I can install a software, suggests greater vulnerability for the youngest- and middle-old groups.
A key finding from our study is that our results show that at least one- in-four report that they have personally been victims of cyberfraud. We can already observe, therefore, that authorities and services should see the growing necessity of protecting those citizens as they require them to increase their digital presence. This includes, but not exclusively, our oldest citizens.
A limitation in our study is that the survey requires some level of digital competence, however those who are able to fill out a relatively long
Digital Vulnerabilities and the Oldest-Old 127
questionnaire are those more likely to be digitally active and hence a potential target for criminals.
Due to limitations of space, we are not able to present additional findings with regard to the results for the three groups combined, nor assess our results in depth against other research. In planned future studies, we will examine in more depth how and to what extent levels of age and conformity, are related to trust, digital competence and perceptions of mental health and well-being.
ACKNOWLEDGMENT
This research was financially supported by Stiftelsen Dam/Dam Foundation, The project number is SDAM_HEL567392.
REFERENCES
Burton, A., Cooper, C., Dar, A., Mathews, L., & Tripathi, K. (2022). Exploring how, why and in what contexts older adults are at risk of financial cybercrime victimisation: A realist review. Experimental Gerontology, 159, 111678. https:// doi.org/10.1016/j.exger.2021.111678 Cross, C. (2016). ‘They’re very lonely’: Understanding the fraud victimisation of
seniors. International Journal for Crime, Justice and Social Democracy, 5(4), 60–75. European Union. (2017). 5661. Special Eurobarometer 464a “European attitudes towards cyber security.” September 2017. Field, D., & Gueldner, S. H. (2001). The oldest-old: How do they differ from the
old-old? Journal of Gerontological Nursing, 27(8), 20–27. Havers, B., Tripathi, K., Burton, A., Martin, W., & Cooper, C. (2024). Exploring the Factors Preventing Older Adults From Reporting Cybercrime and Seeking Help: A Qualitative, Semistructured Interview Study. Health & Social Care in the Community, 2024, Article 1314265. https://doi.org/10.1155/2024/1314265 Heponiemi, T., Kainiemi, E., Virtanen, L., Saukkonen, P., Sainio, P., Koponen,
P., & Koskinen, S. (2023). Predicting Internet Use and Digital Competence Among Older Adults Using Performance Tests of Visual, Physical, and Cognitive Functioning: Longitudinal Population-Based Study. J Med Internet Res, 25, e42287. https://doi.org/10.2196/42287 Hosmer, D. W., & Lemeshow, S. (1989). Applied logistic regression. Wiley. Krosnick, J. A. (1991). Response strategies for coping with the cognitive demands of attitude measures in surveys. Applied cognitive psychology, 5(3), 213–236. Lee, S. B., Oh, J. H., Park, J. H., Choi, S. P., & Wee, J. H. (2018). Differences
in youngest-old, middle-old, and oldest-old patients who visit the emergency department. Clin Exp Emerg Med, 5(4), 249-255. https://doi.org/10.15441/ ceem.17.261 MacKenzie, S. B., & Podsakoff, P. M. (2012). Common method bias in marketing: Causes, mechanisms, and procedural remedies. Journal of retailing, 88(4), 542–555. Mohr, D. L., Wilson, W. J., & Freund, R. J. (2021). Statistical methods (Fourth edition
ed.). Academic Press. https://doi.org/10.1016/B978-0-12-823043-5.00015–1 Money, A., Hall, A., Harris, D., Eost-Telling, C., McDermott, J., & Todd, C.
(2024). Barriers to and Facilitators of Older People’s Engagement With Web-Based Services: Qualitative Study of Adults Aged> 75 Years. JMIR aging, 7, e46522.
128 Wales and Tjostheim
Schwarz, S., Bieg, T., Svecnik, E., Schmölz, A., Geppert, C., & Gerdenitsch, C.
(2024). Digital Competence Scale (DCS) A Short Self-Assessment Instrument for Measuring Digital Competences. Nordic Journal of Digital Literacy(3), 126–143. Shao, J., Hang, Y., Xu, L., Jiamei, L., & Zhang, Q. (2021). The Shackles of Fear: A Moderated Mediation Model of How Fear of Aging May Increase Older Adults’ Vulnerability to Fraud. Clinical Gerontologist, 44(5), 567–576. https://doi.org/ 10.1080/07317115.2019.1676354 Shao, J., Qianhan, Z., Yining, R., Xiying, L., & and Lin, T. (2019). Why are older
adults victims of fraud? Current knowledge and prospects regarding older adults’ vulnerability to fraud. Journal of Elder Abuse & Neglect, 31(3), 225–243. https:// doi.org/10.1080/08946566.2019.1625842 Tjostheim, I., & Halbach, T. (2025). Elderly and Digital Vulnerability Predictors.
In: Gao, Q., Zhou, J. (eds) Human Aspects of IT for the Aged Population. HCII 2025. Lecture Notes in Computer Science, vol 15811. Springer, Cham. https://doi.org/10.1007/978-3-031-92712-6_16 Vincent, J. (2023). Life stage or Age? Reviewing perceptions of oldest digital technologies users. In Digital Ageism (pp. 36–52). Routledge. Wu, Q., & Gu, D. (2021). Oldest-Old Adults. In D. Gu & M. E. Dupre (Eds.),
Encyclopedia of Gerontology and Population Aging (pp. 3637–3653). Springer International Publishing. https://doi.org/10.1007/978-3-030-22009-9_1121 Zou, Y., Sun, K., Afnan, T., Abu-Salma, R., Brewer, R., & Schaub, F. (2024).
Cross-contextual examination of older adults’ privacy concerns, behaviors, and vulnerabilities. Privacy-Enhancing Technologies (PoPETs).
LISTED IN THE AHFE DIGITAL BOOKSTORE CATALOGUE
Explore the complete digital volume
Human Interaction and Emerging Technologies (IHIET 2025)
Read this individual research paper free through the original publisher, or explore the full digital proceedings book.
ISBN 978-1-964867-73-1
Explore this ISBN in the AHFE Bookstore ↗Listed in the July 2026 bookstore catalogue; search by ISBN to confirm current availability · Digital book purchase optional