Joel Pinney, Fiona Carroll, Esyin Chew (2022). Enthusiast versus Antagonist: Exploring the perceptions of data experts on the visualisation of uncertainty. In: Human Interaction & Emerging Technologies (IHIET-AI 2022): Artificial Intelligence & Future Applications. AHFE Open Access, vol. 23. https://doi.org/10.54941/ahfe100893
Despite the copious number of reasons to visualise uncertainty in visualisations, there is still a reluctance to actively represent uncertainties. This paper explores the perceptions of data experts considering uncertainty visualisation and their reasoning behind lacking engagement. By documenting a series of interviews with data experts, the authors uncover the perceptions and constraints faced when contemplating uncertainty visualisation. Through several industries, the authors reveal numerous perceived benefits of uncertainty visualisation but also the strong influence end-users have on the decision to incorporate the additional information. Finally, the paper reflects on a lack of experience but also the commitment from the data experts to the use of aesthetics in developing intuitive uncertainty visualisations. Whilst also highlighting their perceived benefits around what the aesthetic could bring to both visualisation development and uncertainty visualisation design. The study documented in this paper feeds into a larger body of research on aesthetic uncertainty visualisation.
The visualisation process is a necessary part of representing large quantities of data in a way which is not only easily accessible but understandable to a wide audience (Sadiku et al. 2016). Moreover, when we view a visualisation and observe data presented in at specific point, we tend to infer that it is a precise representation of the true data value (Wilke, 2019). However, this is a common misconception as visualised data can have questionable origins and quality (Pang et al. 1997). Moreover, nearly all data contains some uncertainty (Wilke, 2019), this is particularly common when developing visualisations for predictive purposes. Through a set of semi structured interviews, this paper captures the perceptions of visualisation experts from different industries on uncertainty visualisation. In detail, it probes the potential use of depicting uncertainty through aesthetic designs. By documenting not only participants outlook on presenting uncertainty but the restrictions they face, we begin to uncover some of the reasons uncertainty visualisation is not regularly contemplated when presenting data. By revealing the attitude towards uncertainty visualisation, we can begin to understand the considerations needed when developing innovative methods to visualise uncertainty. In turn we highlight the potential accessible ways to include uncertainty in a visualisation to provide a more accurate account and visual depiction of a range of datasets (Skeels et al. 2008).
Uncertainty Visualisation Uncertainty can be categorised as the “degree to which the lack of knowledge about the amount of error is responsible for hesitancy in accepting results and observations without caution” (Hunter & Goodchild, 1993). The visualisation of uncertainty is concerned with the representation of a data set alongside additional information signifying accuracy or error (Boukhelifa & Duke, 2009), which results in a multi faceted visualisation. Moreover, invoking a method for presenting a thorough and factual portrayal of the data for analysis (Pang, 1997). Visualisations which depict uncertainty are frequently portrayed using methods such as error bars and confidence intervals. However, these methods were constructed in the context of scientific publications and require a level of knowledge to be interpreted correctly (Wilke, 2019). These methods can be highly beneficial for understanding results if effectively understood but come with their pitfalls for inexperienced viewers (Cumming et al. 2007). In order to build visualisation techniques to depict uncertainty there must be a level of intuitiveness (Vosough, 2019), and not reliant on previous knowledge. A promising uncertainty visualisation approach to address the intuitiveness are HOP’s (Hypothetical outcome plots), which utilise random draws from a distribution of data and present them using animations over time (Padilla, 2020). Despite the effective feedback of using this method, it is not feasible for static representations and other methods of design must be explored to intuitively depict uncertainty statically.
Portraying uncertainty in a visualisation can bring many advantages from improved decision making (Korporaal et al. 2020, Raber et al. 2020), through strengthening the credibility and reliability of the information presented (Levontin &
Walton, 2020). There has been substantial research conducted into the effects of depicting uncertainty for decision making (Griethe & Schumann, 2005). Whilst research shows the positive influence uncertainty visualisation can have on the decision-making process, considerations of how this extra information is presented must be assessed. It is important to take into consideration that the degree to which the uncertainty influences the decision is dependent on how the uncertainty is expressed (Deitrick & Edsall, 2006). Despite these reasons to visualise uncertainty there are still many misconceptions and limitations restricting the use of presenting uncertainty in a visualisation.
Misconceptions of Uncertainty Visualisation Despite the growing interest of transparency in data visualisations, there is still an impediment surrounding uncertainty visualisation. It must be considered that the data sets backing a visualisation may have missing values, come from a disreputable source, contain deviations, or simply have a low precision of accuracy (Griethe & Schumann, 2005). Moreover, raising the question of why uncertainty has undergone such disapproval in the visualisation community. There have been many theories and conceptions as to why uncertainty visualisation has endured such misconception. Work by (Hullmam, 2019) investigates the common fallacy and concerns associates with uncertainty visualisation. In the paper “Why Authors Don’t Visualise uncertainty”, (Hullman, 2019) conducts a qualitative study to evaluate the scarce implementation of uncertainty visualisation and the core drawbacks causing a hindrance for wide scale acceptance. The paper evaluates 612 visualisations, of which 73% had the intended use of presenting data as a means to guide informed judgements. Incidentally, only 3% of those intended to assist in decision making considered or represented uncertainty through visual means. Taking into consideration the encouraging overview surrounding the benefits of visualising uncertainty from numerous research (Raber et al. 2020, Bonneau et al, 2014), it augments the question of why uncertainty visualisation is so inadequately represented. Fundamentally the decision to present uncertainty is down to the competence of the visualisation designer, yet evidence shows how even those with expert background knowledge can struggle with uncertainty visualisation (Frost, 2017). When uncertainty is presented in a visualisation, we tend to subconsciously avoid acknowledging the uncertainties which stem from the feeling of unease or dissonance (Ellis & Dix, 2015). The general fear that presenting uncertainty will signify to the viewer that the data contains unwanted estimations or that the data is ‘less credible’ (Fischhoff, 2012, Manski, 2018) may be a cause for the circumspection. Another common reason is simply that uncertainty information as a whole can be inherently difficult for people to understand (Nadav-Greenberg, 2008). Through highlighting fundamental issues with both the current methods of visualising uncertain data and inherent impediments understanding uncertainty, the requirement for an intuitive uncertainty depiction is indispensable. The authors turn to aesthetic designs as a possible solution to addressing both the complexity caused with current uncertainty visualisation techniques and inherent difficulties contemplating uncertainty depiction.
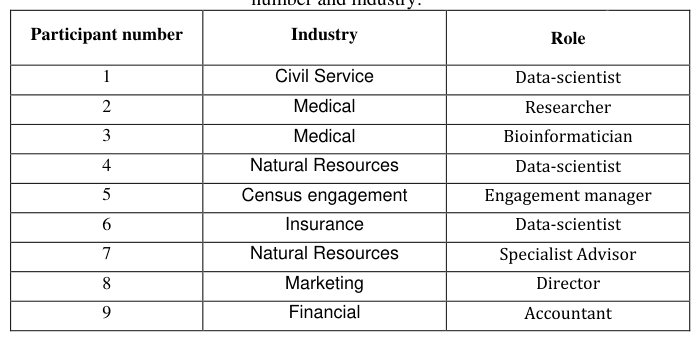
Study Design The study was conducted through a series of semi-structured interviews with participants from a range of industries. Nine extensive interviews were conducted from seven industries (see Table 1) with data scientists and data driven decision makers. The interviews varied in duration from 45-minutes to 2-hours and were all conducted through virtual video conferencing software. Participants were strategically selected in order to build a diverse picture of uncertainty visualisation from an array of industries. The calculated participant selection allowed for controlling the number of participants from a particular industry. Moreover, allowed for the full control over who was interviewed, with the only restriction being on the condition participant consent to participate (Tongco, 2007). Participants were asked a series of questions to empathise with their experiences and thoughts on dealing with visualising uncertainty, before moving into aesthetic and sensory perception questions.
Table 1: Participant number and industry.
Human Interaction & Emerging Technologies (IHIET-AI 2022) Artificial Intelligence & Future Applications https://openaccess.cms-conferences.org/#/publications/book/978-1-7923-8989-4 sensory perceptions you cause? E.g., triggering an emotional or affective response?” (Q3).
Findings The findings from this study uncover the pragmatic reality of attempting to visualise uncertainty in a visualisation. We encountered repeatedly that the participants interviewed understood uncertainty visualisation and acknowledged the benefits of uncertainty visualisation but very rarely actively attempted to visualise it. The consideration made by participants whether or not to depict uncertainty in a visualisation was most commonly dependant on the intended recipient of the visualisation (i.e., client, boss, decision maker, another department). The terminology used by participants when describing uncertainty visualisation expressed key words ranging from communicate to confidence, whilst reinforcing their comprehension surrounding the importance of uncertainty visualisation. The first instance of discussing uncertainty visualisations were positive and well founded from all participants, expressing uncertainty visualisations functionality and practicality.
Despite the constructive overview uncertainty visualisation received in the early stages of the interviews, it was quickly replaced with uneasiness when considering whether or not participants intently represent uncertainty in their visualisation designs. Of the nine interviews conducted no participant could say with assurance that they consistently contemplate uncertainty as a factor in their visualisation or have the capacity to freely make the judgement on whether or not to depict uncertainty in their visualisations.
Focusing on the three core questions highlighted in the study design, we can begin to recognise the minimal consideration uncertainty and aesthetics has on designing a visualisation. By firstly probing participants regarding portraying an in- depth picture of the data in a visualisation (Q1), we uncovered some of the key advantages presenting uncertainty can bring. “It allows people to see a clearer picture of what is going on in the data set” [P8]. “It allows for decisions which are now better informed and allows us to be prepared for it as actually the results are not as certain as we think it was originally.”[P9] On the other hand some participants took a more cautious approach to answering this question by still considering the end user: “It will allow them to make decisions on if the data is suitable quickly...However, it could confuse people who don’t necessarily understand for example confidence” [P7], and “This can almost make the decision more real. The more accurate you communicate those things, the more the person to whom you communicate needs that understanding” [P4]. Interestingly, when prompting all participants on the role that design plays in a visualisation (Q2), all participants had a positive outlook. “It is important as we can infer quite a lot from visuals” [P2]. “If you want people to engage in what you’re telling them you need to make it look interesting” [P1]. “Design can help tell a story quickly, making it easily readable” [P9]. “Design is critical” [P4]. Nearly all participants expressed the importance of design in a visualisation from the perspective of making a visualisation “coloured and pretty” [P3]. Interestingly, the
Human Interaction & Emerging Technologies (IHIET-AI 2022) Artificial Intelligence & Future Applications https://openaccess.cms-conferences.org/#/publications/book/978-1-7923-8989-4 consideration made to incorporate design was simply down to their subjective opinion of what they felt was visually appealing.
We then questioned the participants on the thought process of selecting visual changes. Moreover, their consideration for aesthetic designs as a means to causing sensory perceptions [Q3]. The findings portrayed how participants instinctively relied on their personal opinions when designing a visualisation, with limited consideration for sensory perceptions. In some cases, participant’s thought processes associated this question to the use of colours: “Only so much as the use of colours, but I can’t really pinpoint and emotional response I would be looking for in the viewer” [P3]. “The most important thing to me is to get the message across not to worry about any emotion” [P8]. “No, I have never thought that deep into it if I am being honest, but I see how you can make things worse in certain avenues like using red could install fear.” [P6]. We asked the question could aesthetic designs which are commonly overlooked in visualisation design be the answer for intuitive uncertainty visualisation. “Definitely, its not something I have given a great deal of thought about before having spoken about some of this during the interview” [P6]. The findings show how depicting uncertainty through aesthetic designs was an interesting concept to participants, but not one they had previously considered.
In this work we show how the visualisation of uncertainty is a controversial topic between the standpoint of the data expert and their capacity to implement uncertainty into a visualisation. The comprehensive account from the participants expresses how representing uncertainty in a visualisation can portray a valuable dimension to assist in creating a more thorough representation of what the data shows. Nevertheless, their wariness surrounding the confusion of the client, decision maker or general viewer from understanding uncertainty has created a barrier halting the flow of this information. In order to reap the benefits of uncertainty visualisation there needs to be a standard and intuitive approach to visualise uncertainty. The only way to make uncertainty visualisation successful is to introduce accessible techniques which are able to capture and model uncertain data in a visualisation with a socially agreed system for depiction [Boukhelifa & Duke, 2009). The consideration of using design to afford sensory perceptions was fairly poor from all participants. The responses strongly present the minimal thought that goes into the participants reflection of how their designs may influence a person’s sensory perceptions and emotions. In order to promote the further use of aesthetics to depict uncertainty, we must pursue additional research.
1.1 Future work This study was conducted as part of a series of pilot studies into the development of an uncertainty visualisation framework aimed to assist in selecting effective uncertainty visualisation methods. This research follows the design thinking approach comprised of 5-stages to allow the researchers to fully immerse themselves within a problem (Waloszek, 2012). This paper reports on the first step of the designing thinking process; the empathising stage. Proceeding this study, a further two studies will commence (Aesthetic design evaluation study– Develop stage & User task
Human Interaction & Emerging Technologies (IHIET-AI 2022) Artificial Intelligence & Future Applications https://openaccess.cms-conferences.org/#/publications/book/978-1-7923-8989-4 analysis study - Test) to further evaluate the use of aesthetic design for the depiction of uncertainty in a visualisation. These composite of studies will probe the most effective methods to present a static representation of uncertainty through aesthetic manipulations of the design. The aesthetic combination of using a dashed line to represent areas uncertain and the positioning across the line signifying movement, we are able to create an intuitive impression of uncertainty. We require methods of depicting uncertainty which are untaught and intuitive. Currently being able to successfully apply the common techniques is a very challenging task with minimal guidance on which uncertainty methods yield the best results (Sanyal, 2009). The outcomes from the planned group of pilot studies will contribute towards the development of an uncertainty visualisation framework, helping guide visualisation designers with alternative intuitive methods of visualising uncertainty which are not reliant on previous knowledge.
REFERENCES
Bonneau, G.P., Hege, H.C., Johnson, C.R., Oliveira, M.M., Potter, K., Rheingans, P. and Schultz, T. (2014). Overview and state-of-the-art of uncertainty visualization. Mathematics and Visualization, 37:3–27.
Boukhelifa, N. and Duke, D.J. (2009), Uncertainty visualization - Why might it fail? Conference on Human Factors in Computing Systems - Proceedings, 4051–4056.
Cumming, G., Fidler, F. and Vaux, D.L. (2007), Error bars in experimental biology. Journal of Cell Biology, 177(1):7–11.
Deitrick, S. and Edsall, R. (2006), The Influence of Uncertainty Visualization on Decision Making: An Empirical Evaluation.tle. In A. Riedle, W. Kainz, and G. Elmes, eds., Progress in Spatial Data Handling, Springer, Berlin, 719–738.
Ellis, G. and Dix, A. (2015), Decision Making Under Uncertainty in Visualisation? In IEEE VIS2015.
Fischhoff, B. (2012), Communicating uncertainty fulfilling the duty to inform. Issues in Science and Technology, 28(4):63–70.
Frost, M., Baxter, J., Buckley, P., Dye, S. and Stoker, B. (2017), Reporting marine climate change impacts: Lessons from the science-policy interface. Environmental Science and Policy, 78(August):114–120.
Griethe, H. and Schumann, H. (2005), Visualizing uncertainty for improved decision making. Proceedings of the 4th International Conference on Business Informatics Research, BIR 2005, 2005(2), 23–34.
Hullman, J. (2019), Why Authors Don’t Visualize Uncertainty. IEEE Transactions on Visualization and Computer Graphics, 26(1):130–139.
Hunter, G. and Goodchild, M. (1993), Managing Uncertainty in spatial Databases: Putting Theory into Practice. Journal of the Urbane and Regional Information System Association, 5(2):55–63.
Korporaal, M., Ruginski, I.T. and Fabrikant, S.I. (2020), Effects of Uncertainty Visualization on Map-Based Decision Making Under Time Pressure. Frontiers in Computer Science, 2(August):1–20.
Levontin, P. and Lindsay Walton, J. (2020), Visualising uncertainty a short introduction. Number 1. AU4DM, London.
M. Skeels, B. Lee, G. Smith, and G. Robertson. Revealing uncertainty for information visualization. Proceedings of the Workshop on Advanced Visual Interfaces AVI, pp. 376– 379, 2008. doi: 10.1145/ 1385569.1385637 Manski, C.F (2018), The lure of incredible certitude. Working Paper 24905, National Bureau of Economic Research, August.
Nadav-Greenberg, L., Joslyn, S.L. and Taing, M.U. (2008), The Effect of Uncertainty Visualizations on Decision Making in Weather Forecasting. Journal of Cognitive Engineering and Decision Making, 2(1):24–47.
Padilla, L., Kay, M. and Hullman, J. (2020), Uncertainty Visualizations. Journal of Cognitive Engineering and Decision Making, 6(1):30–56.
Pang, A.T., Wittenbrink, C.M. and Lodha, S.K. (1997). Approaches to uncertainty visualization. Visual Computer, 13(8):370–390.
Raber, T.R., Files, B.T., Pollard, K.A., Oiknine, A.H. and Dennison, M.S. (2020), Visualizing Quantitative Uncertainty: A Review of Common Approaches, Current Limitations, and Use Cases, vol. 1206 AISC. Springer International Publishing.
Sadiku, M., Shadare, A., Musa, S. and Akujuobi, C. (2016), Data Visualization. International Journal of Engineering Research and Advanced Technology (IJERAT), 2(12):11–16.
Sanyal, J., Zhang, S., Bhattacharya, G., Amburn, P. and Moorhead, R.J. (2009), A user study to compare four uncertainty visualization methods for 1D and 2D datasets. IEEE Transactions on Visualization and Computer Graphics, 15(6):1209–1218.
Tongco, M. D. C. (2007), Purposive sampling as a tool for informant selection. Ethnobotany Research and Applications, 5:147–158.
Vosough, Z., Kammer, D., Keck, M. and Groh, R. (2019), Visualization approaches for understanding uncertainty in flow diagrams. Journal of Computer Languages, 52(April), 44– 54.
Waloszek, G. (2012), SAP Design Guild: Introduction to design thinking, SAP AG, SAP User Experience.
Wilke, C.O (2019), Fundamentals of Data Visualization. O’Reilly Media, Sebastopol, 1st ed.
Read this individual research paper free through the original publisher, or explore the full digital proceedings book.
ISBN 978-1-7923-8989-4
Explore this ISBN in the AHFE Bookstore ↗Listed in the July 2026 bookstore catalogue; search by ISBN to confirm current availability · Digital book purchase optional