Oleg Spakov, Ahmed Farooq, Hanna Venesvirta, Arto Hippula, Veikko Surakka, Roope Raisamo (2022). Ultrasound Feedback for Mid-air Gesture Interaction in Vibrating Environment. In: Human Interaction & Emerging Technologies (IHIET-AI 2022): Artificial Intelligence & Future Applications. AHFE Open Access, vol. 23. https://doi.org/10.54941/ahfe100930
Mid-air ultrasound skin stimulation is a known technology used to provide haptic feedback for touchless communication. Even though some in-car interaction already takes place with mid-air gestures, the utilization of this type of feedback is still uncommon. In this study we evaluated how environmental vibration affects the recognition of ultrasound haptic feedback exposed to the driver’s hand. Four skin stimulation shapes of two durations were projected onto the driver’s palm while driving a simulator within a laboratory setting and in a test vehicle on a closed track. Results show that road vibration had a very little effect on driver’s ability to recognize the shape of the stimulation, but, some shapes may require additional training to be recognized consistently. Our findings also suggest that ultrasound haptic output can remain an efficient feedback source even in noisy vibration environments, (i.e., on the road) as compared to conventional vibrotactile feedback, thus drivers can focus their attention more towards the primary task and yet still interact with the onboard IVIS.
Since introduction of the mid-air gestures for human-computer interaction, it has been argued that auditory and/or visual feedback may not be sufficient to ensure good usability. Ultrasound skin stimulation (i.e., ultra-haptics, UH) was suggested to complement mid-air gestures in gesture-based interaction as soon as it was discovered by Iwamoto et el. (2008), Hoshi et al. (2010), and Carter et al. (2013). The follow-up studies by, for example, Freeman et al. (2014) and Long et al. (2014) were mainly focusing on constructing a wide variety of static and dynamic UH skin stimulation that should resemble touching certain surfaces or shapes in 3D space. Gable et al. (2014) suggested that UH feedback may be useful at least to signal that a hand has entered the interaction area. This suggestion was later proved by Vo and Brewster (2015). A recent review by Rakkolainen et al. (2020) contains a thorough summary of related research and applications of mid-air ultrasound haptics.
Later UH technology was tested in a car interaction context. Georgiou et al. (2017) suggested to use UH feedback to improve interaction experience when making mid- air hand gestures to control in-vehicle infotainment systems. However, UH in-car interaction feedback should be meaningful to the user and avoid confusion with other types of UH feedback. Harrington et al. (2018) and Large et al. (2019) suggested that interaction with car systems by mid-air gesture was more robust when visual feedback was supported by UH feedback, as it resulted in shortest interaction times, highest number of correct responses, least ‘overshoots’ rate, and was much favored by participants. These studies stimulated new research in designing UH feedback suitable for use in a car context (Brown et al. 2020). Similarly, Howard et al. (2019) and Shakeri et al. (2018), found that some types of UH feedback may be difficult to discriminate from each other, but horizontal and vertical lines may be perceived rather reliably. This issue was addressed in several recent works, like Young et al. (2020) who experimented with single-point and variable-size circle UH feedbacks, Rutten et al. (2020) who studied discrimination of intensity-increasing circular feedback and Hajas et al. (2020) who focused on recognition of a polygons.
An important factor that has not been yet considered in respect to the use of UH is the effects of environmental vibration to the UH functionality. Most of the above studies were conducted in a laboratory setup where the participants were driving simulators which do not provide environmental vibration. It is known that vibrotactile sensitivity of a palm is affected by vibrations (e.g., Thonnard et al. 1997). Therefore, we suggested that discrimination of various UH skin stimulation types may degrade if applied in a car running on a road. To test this, we first conducted an UH stimulation shape recognition study in which a driving simulator was enhanced by vibration applied to the steering wheel and the ultrasound generating device. Later, we moved the study setup into a real car and tested the discrimination of stimulation types during a live driving task on a closed test track.
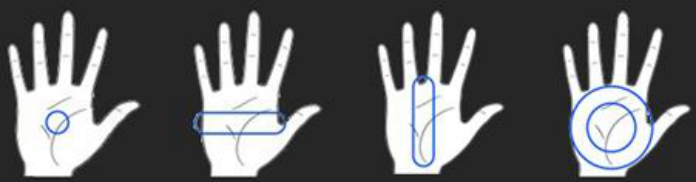
ULTRA-HAPTIC SYSTEMS DESIGN For the study, we created four stimulation shapes (see Fig. 1). Single point, horizontal, and vertical lines were selected based on earlier studies that found them as very distinguishable from other UH stimulations (Howard et al. 2019). Following the guidelines by Young et al 2020, we further supposed that a circular stimulation could be well distinguishable from these three because it is orthogonal to the lines and stimulates the area apart from the single-point shape stimulation.
Figure 1. UH stimulation shapes: single point, horizontal, vertical, and a circular form.
The stimulations were always focused into the center of the palm (i.e., haptic feedback followed the hand). The point was drawn to the center of the palm, the circular shape was drawn from the palm center as 6 cm wide circle, and the lines crossed the center of the palm. The vertical line was parallel to the fingers, and horizontal line was orthogonal to it. Both lines were UH-generating device-wide in size. The ultrasound amplitude was set to the maximum that the UH device can allow. Both the laboratory and test-track studies not only had the “vibration” condition, but also a "still” condition served as a comparison baseline. The methods and the results of both studies with two different pools of participants are described next separately.
Driving Simulator Study Twenty voluntary participants (9 males and 11 females) took part in the study (18-57 years old, µ=32 years), all right-handed (due to the hand recognition and stimulation device located on the right), and they also had to have a valid driving license. The participants were rather experienced drivers (µ=12 years of driving), driving mostly daily (30 %) or weekly (75 %).
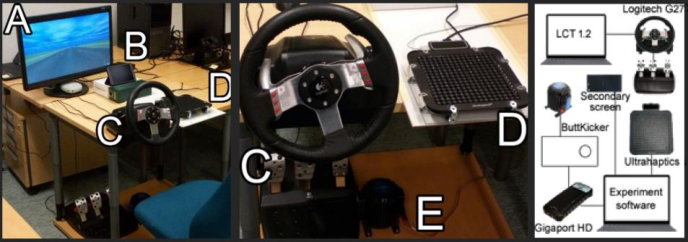
The experiment took place in laboratory premises equipped with a driving simulator. The simulator was based on Logitech G27 set of steering wheel and pedals (see Fig. 2C) connected to a laptop running LCT Sim v1.2 software (Huemer & Vollrath, 2012). The primary external 23″ display showing LCT Sim application was located 1 m in front of the driver, and a secondary 5″ display (mobile phone in a landscape orientation) was placed near its bottom-right corner. The secondary display was used
Human Interaction & Emerging Technologies (IHIET-AI 2022) Artificial Intelligence & Future Applications https://openaccess.cms-conferences.org/#/publications/book/978-1-7923-8989-4 to imitate sudden events (distractors) showing a white 1 cm circle flashing for 0.5 seconds on the black background. Distractor tracking by the participants while driving allowed the control of their attention to the primary (driving) task. The Logitech G27 steering wheel was mounted on the 80×60 cm table which in turn was mounted on top of 80×60 cm plate with a ButtKicker device attached to it (see Fig. 2E) which allowed creating a strong vibration feedback. We used a noise recorded in a car running at about 70 km/h as an input for the ButtKicker device connected with the laptop via Gigaport HD external sound card. The noise was amplified so that the vibration was clearly recognized when holding the steering wheel. We intentionally set the vibration level high so that it would remind driving a real car on a road with a rather rough surface: the RMS value of the vibration amplitude measured with accelerometer attached to the Logitech steering wheel was approximately 1.1 m/s2.
Figure 2. Driving simulator setup: (A) main and (B) secondary displays, (C) Logitech G27 device, (D) Ultrahaptics and Leap Motion devices, and (E) ButtKicker vibration motor.
Connection scheme of the equipment is shown on the right.
Leap Motion was used as a hand-tracking device. It was assembled into a single unit together with Ultrahaptic STRATOS device equipped with 256 ultrasonic actuators that create a touchless haptic sensation. The unit was located on a table ≈20 cm to the driver’s right hand (see Fig. 2D). In pilot testing we found that seating position and posture played an important role in participant’s ability to comfortably reach the Ultrahaptics STRATOS device. For that reason, we used a regular office chair with a neck-rest instead of a car seat, forcing participants to be seated in more up-right position guaranteeing they could reach the Leap Motion tracker at the top of the Ultrahaptics STRATOS device with an outstretched arm. The chair and pedals’ locations were adjustable to accommodate participants of all heights comfortably.
The participant was instructed to drive at a maximum allowed speed (45 km/h; restricted through LCT Sim settings) and keep the middle lane. The simulator was tested in a short (≈30s) trial session. Then the participant was trained to recognize all four UH stimulation shapes. Before the test sessions started, the participant was instructed to keep tracking the distractors that were appearing on a secondary display every 5-20 seconds in between the shape recognition tasks (25-32 events per session),
Human Interaction & Emerging Technologies (IHIET-AI 2022) Artificial Intelligence & Future Applications https://openaccess.cms-conferences.org/#/publications/book/978-1-7923-8989-4 and report verbally when they noticed a flash. after the practice drive. The participant’s spoken responses were recorded, and the supervisor manually accepted each response by pressing a button that triggered countdown timer (random interval between 5 and 6 seconds) to the next shape recognition trial. Cases when a participant missed a stimulation or refused to name it were also handled. The shape recognition and distractor notice tasks were given only during straight driving parts of the simulator. The participants filled in two questionnaires after the test session ended, NASA TLX and a general questionnaire (Table 1). The questions 6-8 were asked after the session in which the vibration was activated. Twenty-grade rating scales were used in both questionnaires. A movie ticket was given to all participated in the study.
Table 1: Session questionnaire in laboratory setup
Table available in the original PDF paper.
We tested 3 factors that could affect stimulation recognition: 1) surface vibration, 2) stimulation duration and 3) stimulation shape. The experiment was split into two sessions, and each session had fixed surface vibration condition, either STILL (ButtKicker was switched off) or VIBRATION. The stimulation duration was either 0.75 (SHORT) or 3.0 (LONG) seconds. There were 4 stimulation shapes described above: Point, Circle, LineH, and LineV. Each participant completed 8 trials for each shape-duration condition. Thus (4 shapes) x (2 durations) x (8 repetitions) = 64 shape recognition tasks were performed during each experimental condition and 128 for the whole experiment. The trials within a condition were completely randomized and the order of the experimental conditions was counterbalanced.
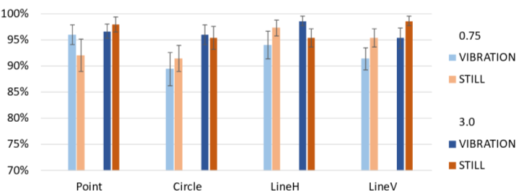
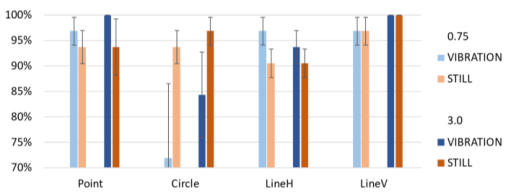
The stimulation recognition rate for each stimulation condition was calculated as a ratio between the number of correctly recognized simulations and the number of stimulations within the condition. The results showed that the general mean of stimulation recognition rate was 94.7%, SEM=0.9% in the still condition and 95.5%, SEM = 1.0% in the vibrating condition. The stimulation recognition rates for each duration, surface vibration, and shape condition are shown in Figure 3.
Figure 3. Mean (±SEM) stimulation recognition rates (left) and noticed distractors (right) in the laboratory setup.
Repeated measures three-way ANOVA revealed that only the stimulation duration had a significant effect for the stimulation recognition rate (F(1,19)=10.9, p < 0.001). The pairwise t-test showed that this rate was 93.4%, SEM=1.3% for SHORT (0.75s) stimulations and 96.8%, SEM=0.7% for LONG (3s) stimulations, and the difference was significant (t=-2.70, p < 0.05). Surface vibration and stimulation shape did not affect to the stimulation shape recognition rate significantly. Further, there were no interactions of the main effects. The rate of noticed distractors shown on the secondary screen was not affected by the surface vibration condition (see Fig. 3 right).
To analyze possible learning effect on the recognition, we replaced the surface vibration factor with the session order. Three-way ANOVA (session order, stimulation duration and stimulation shape) showed that the session order indeed was a factor (F(1,19)=4.85, p < 0.05) for the shape recognition rate, and there was also an interaction between the session order and the stimulation shape (F(3,38)=3.25, p < 0.05). To dismantle this interaction, the stimulation duration factor was omitted, and the following analysis was performed. Two-way ANOVA (session order × stimulation shape) confirmed the significance of the session as a factor for the recognition rate (F(1,19)=5.54, p < 0.05) and that there is an interaction between the session order and the stimulation shape (F(3,54)=5.04, p < 0.01). One-way ANOVA calculated for each shape separately revealed that the session order was a significant factor for the Circle shape only (F(1,19)=14.06, p < 0.001): this shape was recognized significantly worse in the first session (89.8%, SEM=2.1%) than in the second (96.4%, SEM=1.5%, t=-3.75, p < 0.001). Further analysis showed that the stimulation shape was a significant factor in the first session only (F(3,19)=3.45, p < 0.05), and the recognition rate in the first session for circular shape (89.8%, SEM=2.1%) was significantly lower than for vertical line shape (96.4%, SEM=1.2%; t=-3.0, p < 0.01) in this session. The distractors were noticed equally well despite the session order (96-97%). The paired Wilcoxon tests revealed no significant differences for the subjective ratings between the conditions. Participants noted that the vibration was similar to the one found in their personal car, though felt somewhat stronger.
Five voluntary male participants novice to the test setup took part in the study (31-57 years old, µ=38 years). Same criteria as in the simulator study were used for recruiting the volunteers. The participants were experienced drivers (µ=17 years of driving), were driving either daily (n=2) or weekly (n=3). The experiment took place at the closed test track in Nokia of approximately 1.5 km in length (see Fig. 4, right) and with an even and smooth asphalt/tarmac surface.
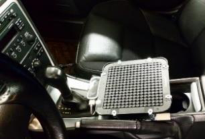
Figure 4. Car setup: Ultrahaptics device location (left) and test track layout (right).
The participants were driving a Volvo V50 car (2010-year model, automatic transmission). The UH device was powered using 12/240V adapter and fastened on the central console between the driver and the front passenger seat, behind the gear stick (see Fig. 4 left). The mobile phone for the distractor presentations was attached within the driver visual field, slightly left of the center of the windshield panel.
The procedure in the test track was quite similar to the driving simulator procedure in the laboratory. While training participants to recognize the stimulation shapes, they were instructed to locate and move their palm parallel to the Ultrahaptics device surface. Participants drove one full lap on the test track at 50 km/h speed to familiarize themself with the road and with the car. On the second lap, the supervisor launched the experiment software and the VIBRATION session started. The next-trial timer was never paused as driving on turning ranges of the track did not require much more effort (such as turning the steering wheel) compared to the straight ranges. The car was parked for the STILL condition. We did not ask participants to report the distractors they noticed in this condition as there was no primary task for them and therefore all attention could have been directed to the display with distractors. The participants filled in NASA TLX and after-session (see Table 2) questionnaires after each session. Only questions #4 and #5 were asked in the STILL condition.
Table 2: Session questionnaire in car setup
Table available in the original PDF paper.
Due to the low number of participants in the test track study only descriptive statistics without statistical analysis are reported here as results. With respect to objective
Human Interaction & Emerging Technologies (IHIET-AI 2022) Artificial Intelligence & Future Applications https://openaccess.cms-conferences.org/#/publications/book/978-1-7923-8989-4 measures, the average values of shape recognition rates for various conditions were again rather high and similar to those registered in the laboratory (see Fig. 5). The general mean recognition rate was 93.6 %, only 1.5 % lower than in the laboratory.
Figure 5. Mean (±SEM) stimulation recognition (left) and noticed distractors (right) rates in the car setup.
A notably reduced recognition rate of the circular stimulation in the VIBRATION condition (78.1 % against 92.8 % in the laboratory) was the main reason of this difference. Beside this, the recognition rate of the horizontal line decreased slightly in the STILL condition: 90.6%, against 96.4%. Other shapes were recognized similarly as in the laboratory, for details see the Table 3.
Table 3: Stimulation recognition rates in both setups
Table available in the original PDF paper.
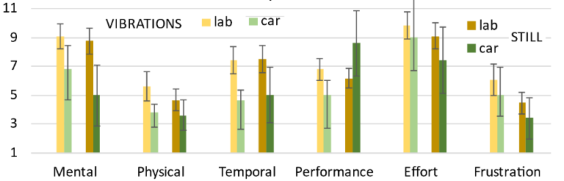
The participants reported that it was easy to keep the speed as requested. Similarly as in the simulator setup, they were not sure they noticed all the distractors although they were quite attentive both in the laboratory and in the test track. In the VIBRATION condition, however, they had to guess the stimulation shape much more often than in the STILL condition. The ratings for the mental, physical, and temporal demands, performance, efforts, and frustration (NASA TLX questionnaire) in both conditions were very similar to the ratings in the laboratory setup, as shown in Figure 6.
Figure 6. Mean (±SEM) NASA TLX rates collected in both setups.
Most of the participants complained that the stimulation signal was somewhat weak, while nobody mentioned this in the laboratory setup. After all data was collected, we tested the ultrasound signal amplitude using a 3×4 array of transducers identical to the transducers used in Ultrahaptics STRATOS device. The array was connected to a measuring device while located at the ultrasound stimulation focal point while the “Point” stimulation shape was played. The measurements were collected in a laboratory and a stationary car with the engine turned on. We could not measure the amplitude in a running car as the measurement device required external power source. The measurements revealed that the ultrasound signal amplitude measured from the Ultrahaptics device powered from the car accumulator via 12/240V adapter was indeed about two times weaker than when powered in the laboratory.
CONCLUSIONS
Ultrasonic stimulation recognition rate remained unaffected of the vibration applied to the steering wheel and pedals in the driving simulator setup. Further, the recognition rates of 3 out of 4 stimulation shapes were at the same level during car driving and when the car was parked. The circular stimulation was the only shape that had lower recognition rate in the driving condition. This stimulation shape did not belong to the list of stimulations found earlier as robustly distinguishable from other stimulation shapes (Hajas et al. 2020, Young et al. 2020). Participants involved in the simulator experiment had to spend some time to learn to distinguish between the shapes even though they had a short practice before the test and reported that they feel differences in skin stimulation between all shapes. However, the stimulations were exposed with short breaks in between during the practice, and longer breaks during the test most likely made the recognition task harder and the participants were still learning to discriminate some shapes. Thus, the session order may be a factor for the recognition rate of shapes that are not as well distinguishable as lines.
In contrast to the simulator study, participants in the test track experiment noted that the stimulations were somewhat weak, even though the hardware and software setup and settings were kept similar in both studies. We suppose that the ultrasound stimulation and transducer amplitude in the car was affected due to the change of the power source for Ultrahaptics device. As discussed earlier, the car setup was powered through a 12V-240V AC-AC adapter which was connected to the test vehicle cigarette lighter. During our post-test investigation we found that the adapter voltage output varied from 5-20% as the setup heated up. We think this may be one of the reasons for the participants’ perceptual variance. However, as the results illustrate, this variance did not overly affect the perception rate.
Most of the distractors shown on a separate screen were noticed while driving a simulator, i.e. participants’ attention to consider the secondary task remained on a good level irrespective of UH interaction. Driving the real car was notably more attention-demanding task and the participants missed 4 times more distractors than in
Human Interaction & Emerging Technologies (IHIET-AI 2022) Artificial Intelligence & Future Applications https://openaccess.cms-conferences.org/#/publications/book/978-1-7923-8989-4 the laboratory. Thus, UH interaction has the potential of requiring additional driver attention in complex driving situations, which should be researched further.
REFERENCES
Brown, E., Large, D. R., Limerick, H. and Burnett. G. 2020. Ultrahapticons: “Haptifying” Drivers’ Mental Models to Transform Automotive Mid-Air Haptic Gesture Infotainment Interfaces. In Proc. of AutomotiveUI '20. ACM, 54–57. Carter, T., Seah, S. A., Long, B., Drinkwater, B., and Subramanian, S. 2013.
UltraHaptics: multi-point mid-air haptic feedback for touch surfaces. In Proceedings of UIST '13. ACM, 505–514. Dong-Bach, V. and Brewster, S. 2015. Touching the invisible: Localizing ultrasonic haptics cues. In Proceedings of IEEE WHC'15, 368-373. Freeman, E., Brewster, S., and Lantz, V. 2014. Tactile Feedback for Above-Device
Gesture Interfaces: Adding Touch to Touchless Interactions. In Proceedings of ICMI '14. ACM, 419–426. Gable, T. M., May, K. R., and Walker, B. N. 2014. Applying Popular Usability Heuristics to Gesture Interaction in the Vehicle. In Adjunct Proceedings of AutomotiveUI '14. ACM, 1–7. Georgiou, O., Biscione, V., Harwood, A., Griffiths, D., Giordano, M., Long, B., and
Carter, T. 2017. Haptic In-Vehicle Gesture Controls. In Proceedings of AutomotiveUI '17. ACM, 233–238. Hajas, D., Pittera, D., Nasce, A., Georgiou, O., and Obrist, M. 2020. Mid-Air Haptic Rendering of 2D Geometric Shapes with a Dynamic Tactile Pointer. In IEEE Transactions on Haptics, 13 (4), 806-817. Harrington, K., Large, D. R., Burnett, G., and Georgiou, O. 2018. Exploring the Use
of Mid-Air Ultrasonic Feedback to Enhance Automotive User Interfaces. In Proceedings of AutomotiveUI '18. ACM, 11–20. Hoshi, T., Takahashi, M., Iwamoto, T., and Shinoda, H. 2010. Noncontact Tactile Display Based on Radiation Pressure of Airborne Ultrasound. IEEE transactions on haptics, 3(3), 155–165. Howard, T., Gallagher, G., Lécuyer, A., Pacchierotti, C., and Marchal, M. 2019.
Investigating the Recognition of Local Shapes Using Mid-air Ultrasound Haptics. In Proceedings of IEEE WHC’19, 503-508. Iwamoto, T., Tatezono, M., and Shinoda, H. 2008. Non-contact method for producing tactile sensation using airborne ultrasound. In Haptics: Perception, Devices and Scenarios (EuroHaptics ’08), Springer, 504–513. Large, D. R., Harrington, K., Burnett, G., Georgiou, O. 2019. Feel the noise: Mid-air
ultrasound haptics as a novel human-vehicle interaction paradigm. Applied Ergonomics, 81 (102909) Long, B., Seah, S. A., Carter, T., and Subramanian, S. 2014. Rendering volumetric haptic shapes in mid-air using ultrasound. ACM Transactions on Graphics. 33 (6), Article 181, 10 pages. Rakkolainen, I., Freeman, E., Sand, A., Raisamo, R., and Brewster, S. 2020. A Survey
of Mid-Air Ultrasound Haptics and Its Applications. IEEE Transactions on Haptics, 14(1), 2-19.
Rutten, I., and Geerts, D. 2020. Better Because It's New: The Impact of Perceived Novelty on the Added Value of Mid-Air Haptic Feedback. In Proceedings of CHI '20. ACM, 1–13. Shakeri, G., Williamson, J. H. and Brewster, S. 2018. May the Force Be with You:
Ultrasound Haptic Feedback for Mid-Air Gesture Interaction in Cars. In Proceedings of AutomotiveUI '18. ACM, 1–10. Thonnard, J-L. Masset, D., Penta, M., Piette, A., and Malchaire, J. 1997. Short-term effect of hand-arm vibration exposure on tactile sensitivity and manual skill. Scandinavian journal of work, environment & health, 23(3), 193–198. Young, G., Milne, H., Griffiths, D., Padfield, E., Blenkinsopp, R., and Georgiou, O.
2020. Designing Mid-Air Haptic Gesture Controlled User Interfaces for Cars. In Proceeding on ACM Human-Computer Interaction. 4, EICS, 81, 23p.
Read this individual research paper free through the original publisher, or explore the full digital proceedings book.
ISBN 978-1-7923-8989-4
Explore this ISBN in the AHFE Bookstore ↗Listed in the July 2026 bookstore catalogue; search by ISBN to confirm current availability · Digital book purchase optional