Julie Baca, Christopher Lewis, Michael Stephens, Daniel Carruth (2022). Evidence for Effect of Aesthetic on Interpretation of Visualizations by Engineers and Non-Engineers. In: Usability and User Experience. AHFE Open Access, vol. 39, pp. 280–287. https://doi.org/10.54941/ahfe1001718
Evaluating scientific visualization has long presented challenges to those working in the field. Recent reviews of evaluation practices found that while reports of evaluations are rising, algorithmic performance outweighs user performance as the dominant metric. This study sought to address this gap by engaging multiple categories of users informally evaluating the efficacy of a scientific visualization. Efficacy was evaluated for understanding, usability, and aesthetic value. Results indicate that aesthetics play a critical, but complex role in enhancing user understanding, particularly for non-expert viewers.Method Our center offers visualization services to scientists analyzing large volumes of complex data. This work motivated our need to evaluate scientific visualization from our users’ many perspectives. Our users need visualization for both: Collaborating with other specialists in their fields; Communicating results to non-specialist sponsors or public We designed a 2-phased study to include both audiences to evaluate a visualization of a research problem. In phase 1, participants evaluated a visualization produced collaboratively with the principal investigator (PI) of the research and our center. In Phase 2, participants evaluated the original visualization produced by the PI with no collaboration with our center. Visualization DescriptionThe U.S. Army is studying fuel atomization as it relates to heavy fuel engines relying on direct injection fuel delivery systems. The engines must significantly advance current fuel conversion efficiencies. The PI for the research created a visualization of the fuel atomization spray. The ERDC DAAC team designed a second visualization of the spray working iteratively with the researcher. Participants were shown an animation of that visualization. Participants were recruited from faculty, staff, and students across multiple disciplines at a university. Over the two phases of the study, 62 engineers, and 54 non-engineers participated. Participants were asked to watch videos of the visualization, answer questions about its content, and evaluate its aesthetic quality.The two-phase study directly compared the original to the enhanced visualization to determine the contribution of aesthetics to a viewer’s understanding of the research for engineers versus non-engineers. ResultsResults indicate that non-engineers viewed the original visualization as having poorer aesthetics and that enhancements to the visualization led to improved perception of aesthetics. These results suggest that improvements to aesthetics of a visualization may have a greater effect on non-engineers than engineers. For engineers, understanding of the research was not significantly improved when viewing the enhanced visualization. However, non-engineer performance matched engineer performance for the enhanced visualization. On the original visualization, non-engineers have a poorer understanding of the research than engineers. On the enhanced visualization, non-engineer performance is higher and closer to engineer performance.Our long-term goal is to develop a more explicit usability process incorporating aesthetics to enhance visualization quality for both researchers and public audiences.
Evaluating the efficacy of scientific visualization has long presented challen- ges to those working in the field, whether users or creators. A comprehensive review of evaluation practices in scientific visualization is given in (Isenberg et al. 2013). The review encodes papers from 10 years of IEEE Visualization conferences to assess their evaluation practices. While reports of evaluation per se steadily rose during the review period, algorithmic performance con- tinued to outweigh user performance overall as the dominant metric. Even when user involvement was included in evaluation, the level of rigor in the work and its reporting was too informal to allow cross comparison or achi- eve external validity (Isenberg et al. 2013). This study sought to address these gaps by engaging multiple categories of potential actual users in formally evaluating the efficacy of scientific visualization.
BACKGROUND
The Data Analysis and Assessment Center at the US Army Corps of Engineers Engineer Research and Development Center provides visualization services to scientists in the DoD High Performance Computing Modernization Program (HPCMP). This work motivated the need to evaluate scientific visualization
Evidence for Effect of Aesthetic on Interpretation of Visualizations 281
from our users’ many potential perspectives. We offer support to scientists analyzing large volumes of complex data in a variety of ways, including but not limited to assistance in using a visualization technique, as well as cho- osing which technique to use for a particular problem. Support may also involve a visualization specialist collaborating with the scientist in the use of the visualization program to extract data or images that highlight problems with an original computation.
The two basic categories of informational and communicative needs of our direct users are:
Collaborating with other specialists in their fields to conduct research;
Communicating with non-specialist sponsors or public consumers At a high level, we consider the two audiences to be experts and non- experts. We designed our study to consider both categories of users.
Related Research Three types of evaluations conducted in the field of information visualization informed our approach:
1. Usability-centered (Nielsen, 1980) 2. Aesthetic (Purchase et al. 2002), (Hartman, 2006) 3. Iterative, generative design-based (Jackson et al. 2012) Any of these categories of evaluations may overlap or be used in parallel in a given study, as in (Cawthon and Van de Moere, 2007) to examine effects of aesthetics on usability. The aesthetic evaluations in these studies based key hypotheses of expected user responses on guidelines given in (Tufte, 1990) that 1) the human eye finds the softer, lighter color palettes found in the natural world most effective for information display, and 2) the presence of organic, lifelike movement or animation provides further benefit.
Aesthetics, Usability, and Iterative Design Our study used aspects of evaluation types 1 and 2 to examine the effects of aesthetics on usability, where usability is defined by the objective of the resea- rcher (understanding of the content and value of the research) and measured by the user responses to questions about their understanding of the research. We also incorporated aspects of type 3 design-based evaluations that allow enhancement of a visualization as it is being developed.
METHOD
We conducted a 2-phased study to evaluate a visualization of a specific rese- arch problem. In the first phase of the study (phase 1), participants evaluated a visualization produced collaboratively with the principal investigator (PI) of the research and our center. In the second phase (phase 2), participants evaluated the original visualization produced by the PI with no collaboration with our center.
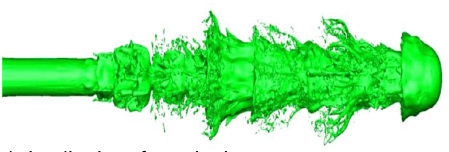
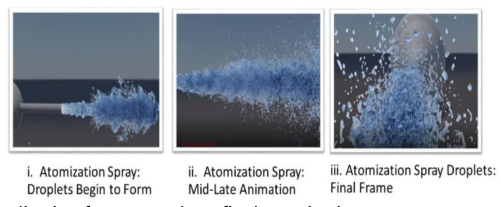
Figure 1: Original visualization of atomization spray.Figure 2: Visualization frames: early to final atomization.
Visualization Description The U.S. Army is studying heavy fuel engines that rely on direct injection fuel delivery systems. The engines must significantly advance current fuel conver- sion efficiencies. In propulsion systems, energy conversion by combustion begins with jet fuel in a compressed liquid form. The initial step in energy conversion is atomization of the fuel, or disintegration of the liquid core, which significantly impacts the droplet-size distribution and fuel conversion efficiency. In combustion scenarios, the liquid fuel must be fully atomized, evaporated and mixed with the carrier gas-phase environment. Hence, the interaction of liquid atomization and spray vaporization is critical, as it deter- mines the efficiency of the conversion of fuel to energy. The PI of the fuel atomization research project created an initial visualization of the atomiza- tion spray. A key frame of that visualization, taken close to the midpoint of the atomization process, is shown in Figure 1.
Our center created a visualization of the atomization spray through an iterative design process with the researcher. We were initially guided by the researcher’s emails regarding the intent for the target audience, excerpted here: “I’d like to highlight the atomization breakup features of the spray... Perhaps a transparent media (color) would also show the internal flow stru- cture. I’m open to your expert suggestions as well.” We began by modifying the color scheme to use softer, more natural colors. The team also added camera movement to provide multiple viewing angles of the spray. The ani- mation was then iteratively refined in review and feedback cycles with the researcher until he was satisfied the goals were achieved. Participants in the study were shown an animation of that visualization. Key frames of the animation illustrating the atomization process are shown in Figure 2.
Research Questions The two-phase study allowed us to directly compare the original visualiza- tion to the enhanced visualization to determine the contribution of aesthetics
Evidence for Effect of Aesthetic on Interpretation of Visualizations 283
to a viewer’s understanding of the fuel atomization research. Hypotheses examined in the study included: Hypothesis 1: Understanding of the research will be improved for ever- yone when viewing the enhanced visualization compared to the original visualization.
Hypothesis 2: Perception of aesthetics will be higher for the enhanced visualization compared to the original visualization.
Hypothesis 3: Non-engineers will have reduced understanding of the research compared to engineers.
Participants Participants were recruited from among faculty, general staff, and students across multiple disciplines at a university. In order to identify participants with relevant knowledge and/or expertise, those who held or were working towards engineering degrees or who rated their domain knowledge of the research at a level of at least 3 on a scale of 1-5 were counted as engineers. All others were counted as non-engineers. In phase 1, 36 engineers and 37 non-engineers participated in the study. In phase 2, the onset of Covid-19 restrictions impacted the recruitment and testing of participants, resulting in only 26 engineers and 17 non-engineers participating. Participants were asked to watch videos of a scientific visualization, answer questions about its content, and evaluate its aesthetic quality.
Experimental Treatments Participants viewed a video of either the original or the enhanced visualiza- tion of the atomization and spray vaporization interactions. The video was embedded in a local HTML-based survey presented in a standard web bro- wser. On the first screen of the survey, participants were also provided a text description below the video that described the research. There were no traditional usability “tasks” for users to perform; instead, the participants were asked to answer questions intended to probe their understanding of the content and their perception of the aesthetics of the visualization.
While taking the survey, users could review the visualizations as much as they wished. However, the text description was only visible on the first page of the survey in order to isolate the effectiveness of the visualization itself. The survey contained 4 open-ended questions regarding their understanding of the scientific content, and 2 Likert Scale questions to rate its potential importance to science and the military on a scale of 1-5 “Least”to “Highest”.
Users were also asked to rate their perception of the aesthetic quality of the visualization on a scale of 0-100 “Ugly” to “Beautiful” and to give an explanation of their rating.
Scoring Results Multiple readers (3) provided scores of understanding for each open-ended textual answer. Answers were scored on a 3-point scale: 0 = Wrong, absent,
Table 1. Understanding scores and aesthetics: original versus enhanced visualizations.
Table available in the original PDF paper.
Enhanced Visualization Original Visualization Central Problem 0.92 0.86 Main Idea 0.74 0.56 Impact 0.85 0.65 Aesthetics 72.70 65.41
Table 2. Comparison of average scores for original and enhanced visualization for engineers and non-engineers.
Table available in the original PDF paper.
Enhanced Visualization Original Visualization Eng. Non-Eng. Eng. Non-Eng. Central Problem 0.97 0.86 1.06 0.73* Main Idea 0.72 0.76 0.71 0.46* Impact 0.92 0.81 0.82 0.54† Aesthetics 69.86 73.16 75.24 59.19*
or irrelevant, 1= Correct undetailed, 2=Correct detailed. Inter-rater reliabi- lity for the 3 readers was calculated using Gwet’s AC2 (Gwet, 2012). A final score was calculated by taking the average of the 3 scores.
RESULTS
The overall results for the original and enhanced visualizations for all par- ticipants are shown in Table 1.While the average scores for accuracy of participant responses regarding their understanding of the main idea, impact, and central problem, as well as the aesthetic ratings, were all lower for parti- cipants viewing the original visualization, the difference was not statistically significant. This ran counter to our expectation of a significant decrease in understanding and aesthetic ratings for the original visualization.
On closer examination, however, distinctly different patterns began to emerge between engineers and non-engineers (see Table 2).
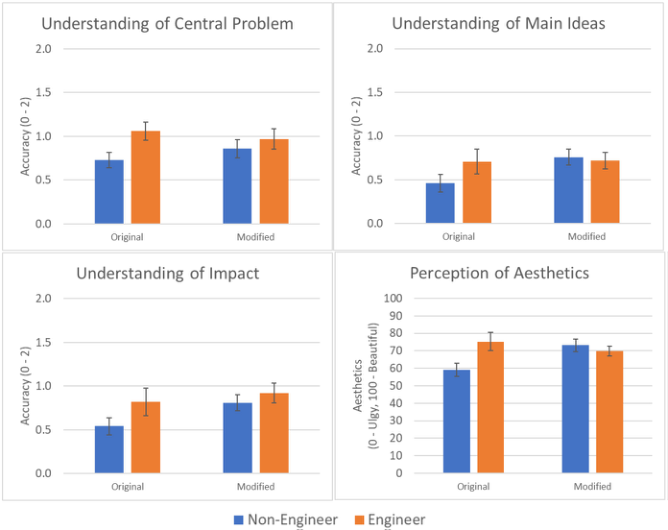
For the enhanced visualization, we observed no evidence of a difference in understanding or aesthetics between the non-engineers and the engi- neers. In contrast, for participants that viewed the original visualization, non-engineers (M = 0.73, SD = 0.45) were significantly less accurate (t = −2.373, df = 41, p<.05) than the engineers (M = 1.06, SD = 0.43) in their understanding of the central problem (Figure 3). Also, the non-engineers perceived the original visualization (M = 59.19, SD = 19.38) to be signi- ficantly less attractive (t = −2.561, df = 41, p<.05) than the engineers (M = 75.24, SD = 21.14; Figure 6).
Additional differences are observed when non-engineer understanding of the research for the original and the enhanced visualization are compared. For non-engineers viewing the original visualization, their understanding of the main idea (M = 0.46, SD = 0.51) was significantly poorer (t = −2.168, df = 61, p < .05) than understanding of the non-engineers viewing the enha- nced visualization (M = 0.76, SD = 0.55; Figure 4). Similarly, non-engineer
Evidence for Effect of Aesthetic on Interpretation of Visualizations 285
Figure 3: Differences in engineer and non-engineer understanding of the central pro- blem (top left), main idea (top right), and Impact (bottom left) and perception of the aesthetics (bottom right) of the original and the enhanced visualization. Error bars indicate standard error. *indicates p < .05. † indicates p < 0.1.
understanding of the impact (M = 0.54, SD = 0.51) was marginally poorer (t = −1.952, df = 61, p=.056) compared to understanding of non-engineers viewing the enhanced visualization (M = 0.81, SD = 0.57; Figure 5) With regard to the aesthetics of the visualizations, the non-engineers viewed the original visualization (M = 59.19, SD = 19.38) as having significantly worse aesthetics (t = −2.573, df = 61, p <.05) than the enhanced visualization (M = 73.16, SD = 22.4; Figure 6).
DISCUSSION
While the overall results did not indicate a significant improvement in aesth- etics for the enhanced video, the results do indicate that non-engineers both viewed the original visualization as having poorer aesthetics and that the enh- ancements to the visualization led to improved perception of the aesthetics of the video. These results suggest that improvements to the aesthetics of a video may have a greater effect on non-engineers than engineers.
As with the aesthetics results, overall there was no evidence of improved understanding of the fuel atomization research when viewing the enhanced visualization. However, the results indicate that non-engineer understanding matched the engineer understanding for the enhanced visualization and was
poorer for the original visualization. On the original visualization, non- engineers have a poorer understanding of the central problem than engineers. On the enhanced visualization, non-engineer understanding is higher and closer to engineer understanding.
For main ideas and impact, non-engineers demonstrate significantly worse understanding on the original visualization than on the enhanced visualiza- tion. The enhanced visualization improves non-engineer understanding of the main ideas and impact.
The hypotheses examined in the study included: Hypothesis 1: Understanding of the research will be improved for ever- yone when viewing the enhanced visualization compared to the original visualization.
Partial support. While engineers’ understanding of the research was not improved for the enhanced visualization, non-engineers’ understanding was significantly improved.
Hypothesis 2: Perception of aesthetics will be higher for the enhanced visualization compared to the original visualization.
Partial support. As with understanding of the research, engineers did not perceive improved aesthetics in the enhanced visualization. However, non-engineers did perceive that the enhanced visualization had improved aesthetics compared to the original.
Hypothesis 3: Non-engineers will have reduced understanding of the research compared to engineers.
Partial support. This was supported only for the original visualiza- tion. When viewing the enhanced visualization, non-engineer understanding matched engineer understanding of the research.
When considering development of visualizations for specific audiences, for the decision-making audience, understanding and appreciation for the research may lead decision makers to perceive the research to be important, and hence have greater likelihood of approval. For general public audiences, which can influence decision makers, their support may be more likely as well when the research is more easily understood. While enhanced aesthe- tics may not improve understanding of expert reviewers, the results of this study strongly support the expectation that aesthetics play a critical role in the perception and understanding of the research for non-expert reviewers.
Finally, this study presents a formal evaluation of a visualization that was enhanced according to guidelines for scientific visualization and through an iterative design process including the original researcher and our center. By engaging multiple categories of potential actual users in the formal compari- son, the study highlights the importance of enhanced aesthetics for the larger portion of the potential audience, the non-experts
FUTURE WORK
We plan to continue the research by expanding the study in several ways. First, we plan to conduct a direct comparison study of only the aesthetic evaluation of original visualization to the enhanced visualization to avoid possible “participant bias” leading to inflated aesthetic responses. We believe
Evidence for Effect of Aesthetic on Interpretation of Visualizations 287
a direct comparison of only the aesthetics of the DAAC-enhanced visualiza- tion to the original visualization in the same study could yield further insight into the value added by DAAC.
Second, we plan to include in later studies a focus on capturing greater detail in viewers’ understanding of the content. Third, we would like to attempt to gauge participants’ “positive feelings toward” or “support of” the research, to explore the possibility that aesthetics in presentation of research may lead to increased support by sponsors and decision makers.
Our long-term goal is to use the results of these studies during design and development to enhance the quality of visualizations provided to researchers, scientists, and the general public. This research will enable a more explicit formulation of a visualization usability process to follow to attain our goal.
Acknowledgment This paper is based upon work supported by the U.S. Army Engineer Research and Development Center (ERDC) under Contract No. W912HZ- 17-C-0015.
REFERENCES
Cawthon, N. and Vande Moere, A. (2007) “Qualities of Perceived Aesthetic in Data Visualization”, Proceedings of CHI 2007, pp. 1–11, ACM Press, San Jose, CA, USA. Cawthon, N. and Vande Moere, A. (2007) “The Effect of Aesthetic on the Usability
of Data Visualization”, Proceedings of 11th International Conference on Informa- tion Visualization IV’07, pp. 637–648, IEEE Computer Society, Washington D.C., USA. Gwet, K.L. (2012) Handbook of inter-rater reliability. Advanced Analytics, LLC, Maryland, USA. Hartman, J. (2006) “Assessing the Attractiveness of Interactive Systems”, Procee-
dings of CHI ‘06 Extended Abstracts on Human Factors in Computing Systems, pp. 1755–1758. ACM Press, Montreal Quebec, Canada. Isenberg, T., Isenberg, P., Chen, J., Sedlmair, M., and Moller T. (2013) A systematic review on the practice of evaluating visualization. IEE Transactions on Visualization and Computer Graphics. Volume 19, No. 12, 2818–2827. Jackson, B., Coffey, D., Thorsen, L., Schroeder, D., Ellingson, A.M., Nuckley, D.J.,
and Keefe, D.F. (2012) “Towards Mixed Method Evaluation of Scientific Visuali- zations and Design Process as an Evaluation Tool”, Proceedings of BELIEV 2012, Seattle, Washington, USA. Nielsen, J. (1980) Usability inspection methods. New York: John Wiley and Sons. Purchase, H., Allder, J.A., and Carrington D. (2002) Metrics for graphic drawing aesthetics. Journal of Visual Languages and Computing 13, 501–516. Tufte, E. (1990) Envisioning Information. Graphics Press, Cheshire, Conn., USA.
LISTED IN THE AHFE DIGITAL BOOKSTORE CATALOGUE
Explore the complete digital volume
Usability and User Experience
Read this individual research paper free through the original publisher, or explore the full digital proceedings book.
ISBN 978-1-958651-15-5
Explore this ISBN in the AHFE Bookstore ↗Listed in the July 2026 bookstore catalogue; search by ISBN to confirm current availability · Digital book purchase optional