Hongyu Li, Chien-Hsiung Chen (2022). User Experience of Visual Perception for Smart Central Control System. In: Usability and User Experience. AHFE Open Access, vol. 39, pp. 86–94. https://doi.org/10.54941/ahfe1001694
Intelligent technology changes the world, promotes the integration and development of industries, and changes people's way of life and form. The smart home central control system, which is closely related to our daily life, is comfortable, safe, highly stable, and reliable. This research purpose was to explore the affordance of gender visual perception for the interface design of a smart central control system. The experimental was adopted a 2 x 3 mixed factorial design to help explore whether different gender and operation modes may affect users’ visual perception. We employed convenience sampling and recruited a total of 12 participants to participate in this experiment. The experimental data were collected in relation to task performance using the system usability scale (SUS), subjective evaluations, and semi-structured interviews. The generated results revealed that: (1) The task performance shows that the interface design of the smart home central control system affects the participants' visual perception. (2) Females generally believe that the three smart home central control system interface designs are logical and innovative. (3) There was an interaction between gender and operation mode, the logic and innovation of the operation interface affected participants' perception of interaction.
User Experience on Visual Perception of Smart Central Control System 87
interaction through the icon is of great significance in improving the intera- ction efficiency of the graphical user interface (Mestres-Missé, Münte, and Rodriguez-Fornells, 2014). The operating system of smart home products significantly affects user perception, which the visual cues of its interface icons help to clarify information content and reduce perception uncertainty (Li and Chen, 2021). People perform tasks through the invisible meaning of simple and well-known interface icons. Affordance emphasizes intuitive inte- raction and is widely used in the field of HCI (Norman, 1988). Its concept helps construct the framework of the activity and explain the implementation of the activity under unconscious intervention (Wittgenstein, 1958). Afforda- nce design significantly affects the user’s visual perception, and a reasonable interface icon state has high affordance (Li and Chen, 2021). The specificity of the icon has long been regarded as one of the influencing factors based on the user experience (McDougall, Curry, and Bruijn, 1999), which refers to “the degree to which the icon describes things that people are already familiar with within the real world and daily life” (McDougall, Bruijn and Curry, 2000). Obviously, the interface design of the smart home central con- trol system affects the user’s visual perception, especially the icon style design is particularly important.
EXPERIMENT DESIGN The experiment adopted a 2x3 mixed factorial design. The two independent variables were gender and operation mode. Gender was the between-subjects factor, which included the two levels were male or female. The operation mode was the within-subjects factor, which included the three levels for the Ring, Honeycomb, and Strip types. The convenience sampling method was used in this study. A total of 12 users participated in this experience (6 males, and 6 females). Their education level is above the junior college students, and the age is between 17-25 years old.
Materials
The experiment was implemented on a HUAWEI touch screen computer with a 13.9-inch. The Photoshop software was used to simulate the three different user interfaces and icon designs. In addition, the Mocking Bot application was used to help create the prototypes.
Experimental Procedure Before the experiment, participants were told that the aim of the experiment was to perform five tasks and record their performance of each task. Each time an experiment was completed, the participant would need to fill out the questionnaire of system usability scale (SUS) and subjective satisfaction. Moreover, semi-structured interviews were conducted with participants on specific issues pertinent to smart central control system user interface design. The total experiment time was no more than 45 minutes.
88 Li and Chen
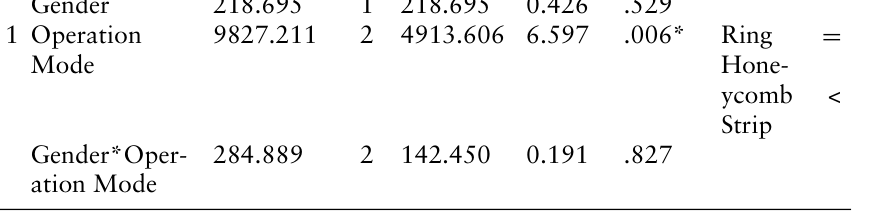
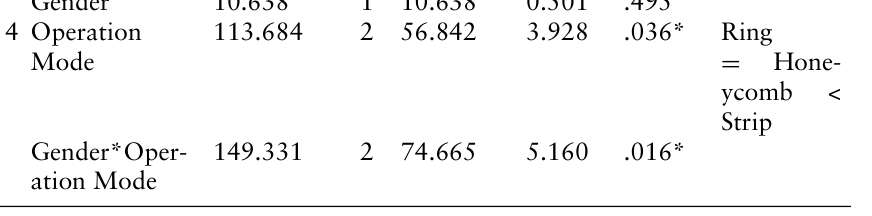
Table 1. The results of mixed two-way ANOVA of task completion time.
4200.608 2 2100.304 3.958 .036* Honeycomb < Ring Gender*Oper- ation Mode *Significantly different at α=0.05 level (*P < 0.05).
RESULTS AND ANALYSES Task Analyses
This study of the experiment used the two-way analysis of variance (ANOVA) to help analyze the collected data. The generated results of each task pertinent to participants’ task completion time are shown in Table 1.
In the first task, participants set the task content in the living room. It was shown that there was a significant difference in the main effect of gen- der (F (1, 10) = 0.426, P = 0.529 > 0.05). There also existed no significant interaction effect between gender and operation mode (F (2, 20) = 0.191, P = 0.827 > 0.05).
User Experience on Visual Perception of Smart Central Control System 89
The main effects of operation mode were also significantly different (F (2, 20) = 6.597, P = 0.006 < 0.05). The post hoc comparison showed that the Strip (M = 96.60, SD = 33.95) and Ring types (M =57.64, SD = 20.54) showed a significant difference (P = 0.014 < 0.05). The Strip and Hone- ycomb types (M = 67.64, SD = 17.10) also revealed a significant difference (P = 0.013 < 0.05). The Ring and Honeycomb types showed no significant difference (P = 0.362 > 0.05). The results showed that participants’ task per- formance regarding the Strip type was slower than the Ring and Honeycomb types.
In the second task, participants set the task content in the bedroom. The result revealed no significant difference in the main effect of gender (F (1, 10) = 3.086, P = 0.109 > 0.05). There existed no significant diffe- rence in the main effect of the operation mode (F (2, 20) = 2.049, P = 0.155 > 0.05). There also existed no significant interaction effect between gender and operation mode (F (2, 20) =1.968, P = 0. 166 > 0.05).
In the third task, participants set up tasks in the kitchen. The result revea- led no significant difference in the main effect of gender (F (1, 10) = 0.847, P = 0.379 > 0.05). There existed no significant difference in the main effect of the operation mode (F (2, 20) = 1.146, P = 0.338 > 0.05). There were also being no significant interaction effect between gender and operation mode (F (2, 20) = 0.794, P = 0.466 > 0.05).
In the fourth task, participants set the task content in the study. The result revealed no significant difference in the main effect of gender (F (1, 10) = 0.501, P = 0.495 > 0.05).
There existed a significant difference in the main effect of the operation mode (F (2, 20) = 3.928, P = 0.036 < 0.05). The post hoc comparison showed that the Strip (M = 24.53, SD = 3.75) and Ring types (M = 20.86, SD = 5.30) showed a significant difference (P = 0.016 < 0.05). The Strip and Honeycomb types (M = 20.66, SD = 4.25) also revealed a significant difference (P = 0.014 < 0.05). The Ring and Honeycomb types showed no significant difference (P = 0.923 > 0.05). The results showed that participants’ task performance regarding the Strip type was slower than the Ring and Honeycomb types.
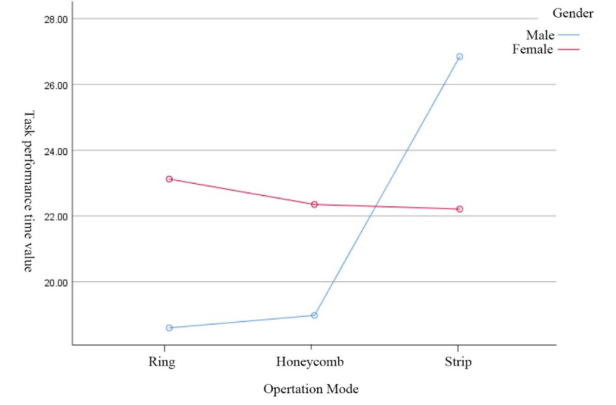
In addition, there existed a significant interaction effect between gender and operation mode (F (2, 20) = 5.160, P = 0.029 < 0.05). The interaction diagram is shown in Figure 1 that, the male took less time to complete the task than the female when using the Ring and Honeycomb types. Nonetheless, the female spent less time in completing the task when they adopted Strip type.
In the fifth task, participants set the task content in the monitoring. The result revealed no significant difference in the main effect of gender (F (1, 10) = 2.189, P = 0.170 > 0.05). There were also being no significant interaction effect between gender and operation mode (F (2, 20) = 0.537, P = 0.593 > 0.05).
However, there existed a significant difference in the main effect of the operation mode (F (2, 20) = 3.958, P = 0.036 < 0.05). The post hoc com- parison showed that the Ring (M = 50.68, SD = 19.51) and Honeycomb types (M = 27.16, SD = 18.38) showed a significant difference (P = 0.006 < 0.05). The Ring and Strip types (M = 28.42, SD = 24.78) showed no signifi- cant difference (P = 0.071 > 0.05), but the Honeycomb and Strip types also
90 Li and Chen
Figure 1: Task 4: The interaction diagram between gender and operation mode.Table 2. The results of mixed two-way ANOVA of SUS.
showed no significant difference (P = 0.901 > 0.05). The results showed that participants’ task performance regarding the Ring type was slower than the Honeycomb type.
System Usability Scale (SUS) After the experiment, the participants were asked to fill out the SUS questi- onnaire after completing the assigned tasks. The generated results from the mixed two-way ANOVA are illustrated in Table 2.
From Table 2, The result revealed no significant difference in the main effect of gender (F (1, 10) = 0.167, P = 0.691 > 0.05). there was a significant difference in the main effect of operation mode (F (2, 20) = 1.865, P = 0. 181 > 0.05). There existed no significant interaction effect between gender and operation mode (F (2, 20) = 0.104, P = 0.902 > 0.05).
Subjective Evaluations Using a 7-point Likert scale, the results of the participants’ subjective eva- luations after completing the operational tasks (i.e., 1: least agree, 7: most agree) are presented as follows.
Smart: The result revealed no significant difference in the main effect of gender (F = 0.312, P = 0.589 > 0.05). There existed no significant difference
User Experience on Visual Perception of Smart Central Control System 91
Table 3. The results of mixed two-way ANOVA regarding subjective evaluations.
in the main effect of the operation modes (F = 1.028, P = 0.376 > 0.05). There existed no significant interaction effect between gender and operation mode (F (2, 20) = 1.627, P = 0.213 > 0.05).
Legibility: The result revealed no significant difference in the main effect of gender (F = 0.755, P = 0.405 > 0.05). There existed no significant difference in the main effect of the operation modes (F = 1.152, P = 0.336 > 0.05). There was no significant interaction effect between gender and operation mode (F (2, 20) = 0.599, P = 0.559 > 0.05).
Logicality: The result revealed no significant differences in the main effect of gender (F = 0.204, P = 0.661 > 0.05). There existed also no significant difference in the main effect of the operation modes (F = 1.503, P = 0.246 > 0.05).
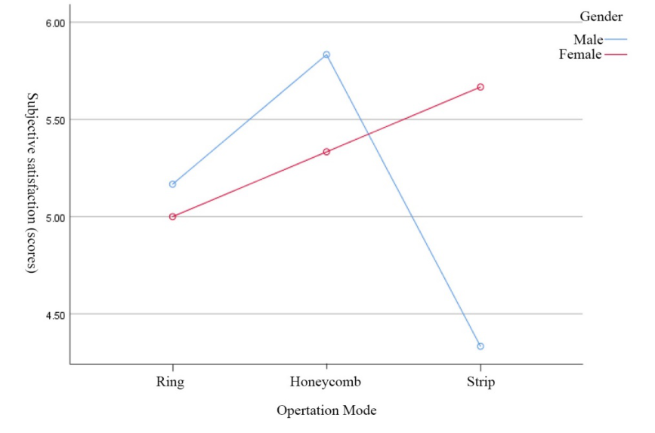
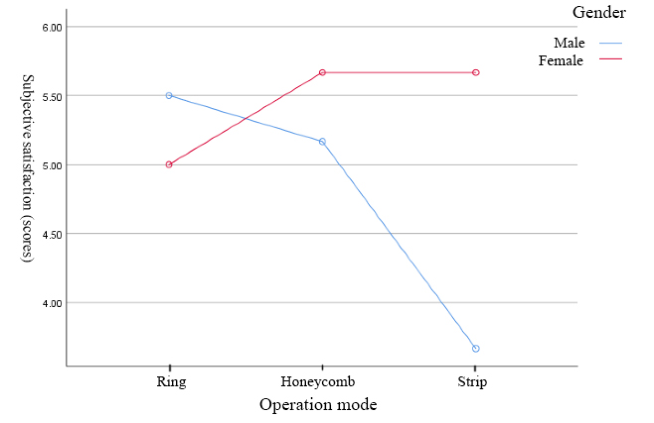
There was a significant interaction effect between gender and operation mode (F (2, 20) = 3.601, P = 0.046 < 0.05). The interaction diagram is shown in Figure 2 that, in the Ring and Honeycomb types, the male felt higher degree of logicality with the two designs than the female, especially in the Honeycomb type. However, in the Strip type, the female felt higher degree of logicality than the male.
Novelty: The result revealed no significant differences in the main effect of gender (F = 0.994, P = 0.342 > 0.05). There existed also no significant difference in the main effect of the operation modes (F = 1.683, P = 0.211 > 0.05).
There existed a significant interaction effect between gender and operation mode (F (2, 20) = 4.296, P = 0.044 < 0.05). The interaction diagram is shown in Figure 3 that, in the Honeycomb and Strip types, the male felt less degree of novelty with the two designs than the female. However, in the Ring type, the male felt higher degree of novelty than the female.
92 Li and Chen
Figure 2: Logicality: The interaction diagram between gender and operation mode.Figure 3: Novelty: The interaction diagram between gender and operation mode.
CONCLUSION
This research study is to explore the influence of the interface design of the smart home central control system on the user’s visual perception. In task per- formance, the results show that there are significant differences among the three different operating modes. Participants’ task completion timer generally showed that the Strip type took the longest. There was a significant intera- ction between gender and operational mode, with males generally took less time to complete tasks on the Ring and Honeycomb types, but took longer time on the Strip type.
User Experience on Visual Perception of Smart Central Control System 93
In addition, in terms of subjective evaluations, there existed an interaction between gender and operation mode. Both the interface the Logicality and Novelty have a significant impact on participants’ perception of interaction. Logicality: When participants operate the Ring and Honeycomb types, com- pared with the females, the male thought that these two designs were more logical, especially in the Honeycomb type. In the Strip type, however, the female thought the design was more logical. Novelty: When operating the Honeycomb and Strip types, the female felt more degree of novelty with the innovation of these two designs than the male. Nonetheless, in the Ring type, the male felt more degree of novelty than the female. In general, in terms of the Ring and Honeycomb types, the participants believed that they were both logical and innovative. In the Strip type, the male generally believed that the interface operating system was less in logic and innovation.
The interface icon design of the smart home central control system affects the user’s visual perceptions. The use of different icon styles may affect the user’s visual perception of pleasure and happiness pertinent to the product or user interface.
Smart digitization improves home life, helps liberate hands, frees people from tedious home life, and allows people to experience the beauty in life completely. The rapid development of the digital economy has also promoted the close connection between education and society. Strengthen the training of digital design professionals, and effectively improve the virtuous circle between people and products, people and things, and people and society, can help achieve a better user experience.
ACKNOWLEDGMENT
This paper is supported by Zhejiang Provincial Philosophy and Social Scie- nces Planning Project (No. 22NDJC303YBM); Zhejiang Provincial Educati- onal Science Planning Project (No. 2022SCG132).
REFERENCES Li, H., & Chen, C. H. (2021) Effects of Affordance State and Operation Mode on a Smart Washing Machine Touch Sensitive User Interface Design. IEEE Sensors Journal, 21(19), 21956–21967. Li H, Chen C. H. (2021) Effect of the Affordances of the FM New Media Commu-
nication Interface Design for Smartphones. Sensors, 21(2):384. https://doi.org/10. 3390/s21020384. Mestres-Missé, A., Münte, T. F., & Rodriguez-Fornells, A. (2014) Mapping concrete and abstract meanings to new words using verbal contexts. Second Language Research, 30(2), 191–223. Mcdougall, S. J., Curry, M. B., & De Bruijn, O. (1999) Measuring symbol and icon
characteristics: Norms for concreteness, complexity, meaningfulness, familiarity, and semantic distance for 239 symbols. Behavior Research Methods, Instruments, & Computers, 31(3), 487–519. McDougall, S. J., De Bruijn, O., & Curry, M. B. (2000) Exploring the effects of icon characteristics on user performance: The role of icon concreteness, complexity, and distinctiveness. Journal of Experimental Psychology: Applied, 6(4), 291. Norman, D. A. (1988) The psychology of everyday things. New York, NY: Basic
books.
94 Li and Chen
Wang Q, Zhang Y, Chen G, Chen Z, Hee HI. (2021) Assessment of Heart Rate and Respiratory Rate for Perioperative Infants Based on ELC Model. IEEE Sensors Journal, 21(12):13685–13694. DOI: 10.1109/JSEN.2021.3071882. Wang Q, Liu W, Chen X, Wang X, Chen G, Zhu X. (2021) Quantification of
scar collagen texture and prediction of scar development via second harmo- nic generation images and a generative adversarial network. Biomedical Optics Express, 12(8):5305–5319.
LISTED IN THE AHFE DIGITAL BOOKSTORE CATALOGUE
Explore the complete digital volume
Usability and User Experience
Read this individual research paper free through the original publisher, or explore the full digital proceedings book.
ISBN 978-1-958651-15-5
Explore this ISBN in the AHFE Bookstore ↗Listed in the July 2026 bookstore catalogue; search by ISBN to confirm current availability · Digital book purchase optional