Lu Lu, Chien-Hsiung Chen (2025). Diversity Analysis of Smart Home User Interface Design. In: Usability and User Experience. AHFE Open Access, vol. 194, pp. 220–227. https://doi.org/10.54941/ahfe1006684
Due to the rapid development of the Internet of Things (IoTs), more and more users are demanding to operate and experience smart devices at home. Smart home control provides richer content and functions than the traditional single smart home software, and the richness of the control content leads to a more interactive and complex interface. These interfaces require more complex cooperation between users and interactive systems and put forward more scientific requirements for the organization and presentation of information. People increasingly need intuitive interfaces to facilitate and manage complex smart home central control systems in a friendly manner. As the information carried by the smart home control interface becomes more and more diverse, the user interface design becomes more and more complicated, therefore, users are faced with the need to find the required content in a large amount of information when operating the smart home control interface, effectively improving the visual search efficiency and reducing the cognitive load have become urgent problems to be solved.Design complexity is also important to determine how easy it is for users to search for icons on the user interface. It is important to understand the impact of interface complexity on users in smart homes, and it is necessary to carry out design complexity research on their GUI. The existing literature on the effects of interface visual complexity on user performance is inconsistent. Low complexity will improve operational efficiency and processing fluency, medium complexity will reduce the load on visual attention and thus increase purchase intention, and high complexity will promote more positive responses, but it will also increase user cognitive load. Although many studies have been conducted on the complexity of interface vision, the results have not been consistent. To sum up, there is no consensus on the impact of dynamic icons on the complexity of visual design. Therefore, this study collected data such as user operation performance and subjective evaluation through experiments to measure the influence between icon dynamic effect and design complexity.In this study, a 2X3 two-way analysis of variance ANOVA (N=48) was used to investigate the influence of cognitive load on users operating the control interface in smart home under different situations of design complexity (low, medium, high) and icon state (static, dynamic). The experimental results are as follows: (1) The higher the design complexity, the more cognitive load can be increased; (2) In simple tasks, the icon status does not affect the user's cognitive load; (3) User cognitive load is influenced by design complexity and icon status.
With the increasing intelligence and interconnectivity of Internet of Things (IoT) technology, the convenience of human-computer interaction is becoming increasingly apparent. Technological advances have enabled various smart home products to interact with users through various interfaces, thereby enhancing user experience. However, there are also discussions about the cognitive compliance and emotional experience of users. Designing user-friendly interfaces is not only related to the intuition and efficiency of operation but also may affect the user’s emotional perception and interaction experience. Therefore, it is worthwhile to continue in-depth research on how to improve the functionality of smart home products while taking into account the user’s emotional perception and user experience.
The relationship between interface design diversity, motion graphics, and user performance is an important research area in the field of human- computer interaction. Existing research has shown that the design diversity of an interactive interface has a significant impact on user performance and learning costs (Norman, 2013). High-complexity interfaces may improve information usability but also increase cognitive load (Sweller, 1988). In
Diversity Analysis of Smart Home User Interface Design 221
addition, animation effects, as a visual cue, can be effective in guiding users’ attention and increasing the fluency and immersion of interactions (Mayer & Moreno, 2003). However, some studies have pointed out that too many animation effects may distract users’ attention and affect the efficiency of operation (Tversky et al., 2002).
In smart home interactive interface design, Design Diversity and Motion Graphics are key factors affecting the user’s emotional perception and experience. Too much simplicity in design may reduce the efficiency of information transfer, while too much complexity may increase the cognitive load of the user. At the same time, static and dynamic visual presentations may affect the user’s emotional experience and the smoothness of interaction. Therefore, this study aims to investigate how these two factors affect users’ affective cognition and user experience.
In this study, a 2×2 between-subjects experiment design (N = 32) was adopted to investigate the effects of two variables, Design Diversity (Simple, Complex) and Motion Graphics (Static, Dynamic), on user experience in smart home interfaces. It is expected that the results of this study will be an important revelation for the design of smart home interactive interfaces, and provide a reference for the future design of interfaces that are more in line with users’ cognitive and emotional needs.
LITERATURE REVIEW
Design Diversity and Motion Graphics Design diversity in interface refers to the changes in interface layout, functions, interaction methods, and so on. Design diversity is particularly important in interface design, providing multiple design solutions for interface aesthetics, interface adaptability, and creativity. Design diversity not only promotes innovation but also enhances user acceptance and satisfaction (Norman, 2013). Particularly in interaction design, the use of diverse visual languages ensures that users with different backgrounds and needs have a good experience (Marcus, 2002). It has been shown that high Design diversity in mobile news applications can exacerbate information overload and lead to visual distraction (Guo, Chen, Li, Lyu, & Zhang, 2021).
Motion Graphics is a visual design technique that enhances user experience and interactivity through animation. Research has shown that appropriate motion effects can improve information delivery, usability, and enjoyment for users (Lupton, 2013). The type of Motion Graphics affects the user’s visual perception. Several types of Motion Graphics have been investigated as follows. Ponsard et al. (2015) investigated two types of motion effects, twist, and pulse, and found that these effects improved visual search performance by 8–10. Blinking attracts users’ attention more than translational and rotational animations (O’Neill, Erdemli, Arya, Field, 2020), and Hong et al.’s (2004) study centered around the blinking animation, which was found to be able to help users find a target in a large amount of information. The visual perception of athletes was evaluated and it was found that animations could attract their visual attention (O’Neill, Erdemli, Arya, Field, 2020).
222 Lu and Chen
Vibrating animations have the greatest impact on visual search behavior and are preferred by users (Chowdhury & Rohankar, 2023).
Emotion Perception in Interaction Emotion as a high-level psychological need cannot be ignored in design (Wang & Wang, 2023). Arousal and valence are crucial to describing emotion perception and are important components of human emotions. Therefore, by evaluating arousal and valence in emotion, the diversity of interaction interface design can be further understood.
Existing research still contains some divergent discussions about the role of interface design diversity on affective understanding. There is a negative correlation between design variety and affective pleasure (Pandir & Knight, 2006), whereby arousal with moderate interface design variety improves interface performance (Berlyne, 1960), and users prefer moderate arousal. Affective arousal, potency, and pleasantness affect selective attention and visual processing (Madan, Bayer, Gamer, Lonsdorf, & Sommer, 2018), positive emotions broaden the user’s attention, and negative emotions narrow the field of view, and the effect of online shoppers’ visual search suggests that pessimism requires more attention than positive emotions (Hwang & Lee, 2022). Tuch investigated how the design diversity of web page affects human perceptual pleasure, arousal, and physiological responses (Tuch, 2007).
For this reason, this experiment is centred around the following two research questions.
Q1: How does interface Design Diversity and Motion Graphics affect users’ emotional perception?
Q2: How does interface Design Diversity and Motion Graphics affect user performance?
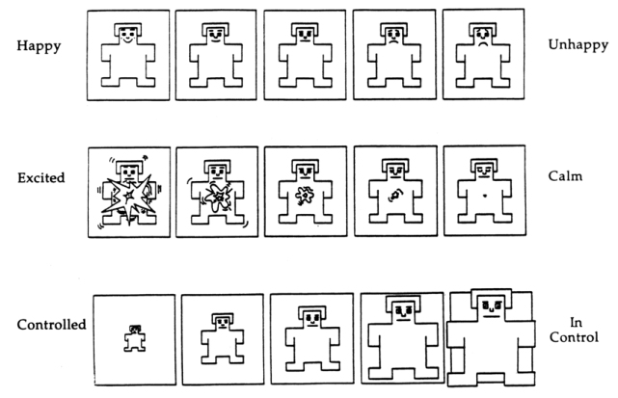
EXPERIMENTAL DESIGN This experiment was divided into two phases: task manipulation and subjective assessment. Subjects completed four task manipulations according to the tasks and then completed the SAM scale and SUS scale according to their subjective feelings after the manipulations, which is a self-report scale developed by Bradley and Lang (Bradley & Lang, 1994). The scale assesses participants’ effect through three latitudes of Valence, Arousal, and Dominance (Fig. 1), each of which consists of a five-picture, nine-point scale. Valence ranges from very unhappy (1 point) to very happy (9 points) to assess the degree of happiness; Arousal ranges from very calm (1 point) to very excited (9 points) to assess the degree of emotional arousal; and Dominance ranges from completely controlled (1 point) to completely controlled (9 points) to assess the degree to which the user dominates or is dominated by the emotion.
Diversity Analysis of Smart Home User Interface Design 223
Figure 1: Bradley and Lang developed the self-assessment manikin (SAM) scale.
RESULTS
Completion Time of Experiment Tasks Task 1 operational performance did not produce a significant interaction between the Motion Graphics and Design Diversity factors (F=2.872, p=0.101>0.05; η2=0.093). No significant difference was found in the main effect of the Motion Graphics factor (F=0.297, p=0.590>0.05; η2=0.010). However, a significant difference was produced in the Design Diversity factor main effect (F=4.554, p=0.042< 0.05; η2=0.140), where the performance of the simple level of Design Diversity interface operation (M=8.28, SD=3.10) was faster than the performance of the complex level of Design Diversity interface operation (M=10.10, SD=4.17).
Task 2 operational performance did not produce a significant interaction between the Motion Graphics and Design Diversity factors (F=0.612, p=0.440>0.05; η2=0.021). No significant difference was found in the main effect of the Motion Graphics factor (F=1.550, p=0.223>0.05; η2=0.052). Similarly, no significant differences were found in the main effect of the Design Diversity factor (F=0.018, p=0.894>0.05; η2=0.001).
Task 3 operational performance did not produce a significant interaction between the Motion Graphics and Design Diversity factors (F=3.475, p=0.073>0.05; η2=0.110). No significant difference was found in the main effect of the Motion Graphics factor (F=0.189, p=0.667>0.05; η2=0.007). Similarly, no significant differences were found in the main effect of the Design Diversity factor (F=0.355, p=0.556> 0.05; η2=0.013).
Task 4 operational performance did not produce a significant interaction between the Motion Graphics and Design Diversity factors (F=0.699, p=0.410>0.05; η2=0.024). No significant difference was found in the main effect of the Motion Graphics factor (F=0.200, p=0.658>0.05; η2=0.007). Similarly, no significant differences were found in the main effect of the Design Diversity factor (F=0.699, p=0.410>0.05; η2=0.024).
224 Lu and Chen
Table 1: The descriptive statistics of participants’ task completion time (unit: second).
Table available in the original PDF paper.
Variable Task1 Task2 Task3 Task4
M SD M SD M SD M SD Static 9.29 4.16 15.92 4.18 14.29 5.33 6.86 1.69
Diversity Analysis of Smart Home User Interface Design 225
Experimental Subjective Assessment The total score on the System Usability Scale (SUS) for this experiment was 72 (M = 72.42, SD = 11.90). From the SUS main effect analysis of the two- way ANOVA in Table 3, the main effect of motion graphics (F = 0.313, p = 0.580 > 0.05; η2 = 0.011) and the main effect of design variety (F = 2.818, p= 0.104 > 0.05; η2 = 0.091) were not significant. Meanwhile, there was no significant interaction between the two variables (F = 0.168, p = 0.685 > 0.05; η2 = 0.006), suggesting that system usability was consistent across all four prototypes in this experiment.
Table 3: The results of the two-way ANOVA regarding the SUS.
According to the two-way ANOVA, the three latitudes of emotion perception, Valence (M = 6.66, SD = 1.60), Arousal (M = 4.03, SD = 2.28), and Dominance (M = 6.28, SD = 2.77), were not significant in the Motion Graphics and Design Diversity main effects on the Self-Assessment Manikin (SAM), and there was no significant interaction between the two variables (Tab. 4).
Table 4: The results of the two-way ANOVA regarding the self-assessment manikin (SAM).
Table available in the original PDF paper.
Source SS df MS F p η2 Post Hoc Valence 2.531 1 2.531 1.076 .308 .037 Motion Graphics
∗Significantly different at α = 0.05 level (∗p < 0.05). ∗∗Significantly different at α = 0.01 level (∗∗p < 0.01).
226 Lu and Chen
DISCUSSIONS A simple interface is faster to use than a complex one. There are several possible reasons for this. A simple interface design reduces the cognitive load on the user. Too many or overly complex interface elements require more attention to process and understand, which increases the operational performance time. Secondly, a simple interface design typically conforms to design conventions, which reduces the user’s learning cost and decision time (Hick’s Law). In this experiment, the presence or absence of motion graphics did not have a significant impact on the user’s operational efficiency. This may be because the interface animation effects involved in this task do not affect the core operations needed to complete the task, and the motion graphics themselves do not help users understand the interface, so they do not significantly impact the user’s operational efficiency. It is also possible that the animations are often ignored or interfered with during high-frequency tasks, as users tend to focus more on task completion than on the animation.
In this study, there was no significant difference in the dynamic changes of emotional states between the two variables, and the emotional impact of interface design needs further exploration. The stimulus material (interface design) in the experiment may not have been strong enough, with emotions being too neutral or similar in intensity, lacking sufficient emotional evocativeness. This may have made it difficult to measure emotional responses using the SAM scale. Additionally, other measurement tools could be used in conjunction with SAM to capture a fuller range of emotional responses. The type of stimulus material might also be related to the medium used, as visual attention is generally higher on mobile screens compared to desktop screens. Furthermore, since mood measures are more susceptible to individual differences, experiments should control for such variables by increasing the sample size to improve statistical performance. The results of this study can provide valuable insights for researchers and designers regarding the emotional design of smart home interfaces, helping to enhance user engagement, user experience, and subjective perception.
REFERENCES
Berlyne, DE (1973). Aesthetics and psychobiology. Journal of Aesthetics and Art Criticism, 31 (4). Berlyne, DE (1960). Stimulus Selection and Conflict. Bradley, MM & Lang, PJ (1994), Measuring emotion: The self-assessment manikin and the semantic differential. Journal of Behavioral Therapy and Experimental. Psychiatry, 25, 49–59. Chowdhury, A., & Rohankar, S. (2023). Effects of Animation Types on Visual
Search Behavior: A Study on Mobile Icon Search. In Communication Design and Branding: A Multidisciplinary Approach (pp. 253–266). Cham: Springer Nature Switzerland. Guo, F., Chen, J., Li, M., Lyu, W., & Zhang, J. (2022). Effects of visual complexity on user search behavior and satisfaction: An eye-tracking study of mobile news apps. Universal Access in the Information Society, 21(4), 795–808.
Diversity Analysis of Smart Home User Interface Design 227
Hong, W., Thong, JY, & Tam, KY (2004). The effects of information format and shopping task on consumers’ online shopping behavior: A cognitive fit perspective. Journal of management information systems, 21 (3), 149–184. Hwang, YM, & Lee, KC (2022). An eye-tracking paradigm to explore the effect of
online consumers’ emotion on their visual behaviour between desktop screen and mobile screen. Behaviour & Information Technology, 41 (3), 535–546. Madan, CR, Bayer, J., Gamer, M., Lonsdorf, TB, & Sommer, T. (2018). Visual complexity and affect: Ratings reflect more than meets the eye. Frontiers in psychology, 8, 2368. Marcus, A. (2002). Globalization and the design of user interfaces. Interactions, 9(6),
6–14. Mayer, RE, & Moreno, R. (2003). Nine ways to reduce cognitive load in multimedia learning. Educational psychologist, 38 (1), 43–52. Norman, D. (2013). The design of everyday things: Revised and expanded edition.
Basic books. O’Neill, D., Erdemli, M., Arya, A., & Field, S. (2020). Improving the Visual Perception and Spatial Awareness of Downhill Winter Athletes with Augmented Reality. In HCI International 2020–Late Breaking Papers: Virtual and Augmented Reality: 22nd HCI International Conference, HCII 2020, Copenhagen, Denmark, July 19–24, 2020, Proceedings 22 (pp. 403–420). Springer International Publishing. Pandir, M., & Knight, J. (2006). Homepage aesthetics: The search for preference
factors and the challenges of subjectivity. Interacting with Computers, 18(6), 1351–1370. Ponsard A, Ardekani K, Zhang K, Ren F, Negulescu M, McGrenere J (2015) Twist and pulse: Ephemeral adaptation to improve icon selection on smartphones. In: Proceedings of the 41st graphics interface conference, pp. 219–222. Saffer, D. (2013). Microinteractions: Designing with details. “O’Reilly Media, Inc.”. Sweller, J. (1988). Cognitive load during problem solving: Effects on learning. Cognitive science, 12 (2), 257–285. Tversky, B., Morrison, JB, & Betrancourt, M. (2002). Animation: Can it facilitate?
International journal of human-computer studies, 57 (4), 247–262. Tuch, AN (2007). Visual Complexity of Websites and its Effects on Experiential, Psychophysiological, Visual Search Reaction Time and Recognition Responses (Doctoral dissertation, Department of Cognitive Psychology and Methodology, University of Basel). Wang, Z., & Wang, J. (2023). Do the emotions evoked by interface design factors
affect the user’s intention to continue using the smartwatch? The mediating role of quality perceptions. International Journal of Human–Computer Interaction, 39(3), 546–561.
LISTED IN THE AHFE DIGITAL BOOKSTORE CATALOGUE
Explore the complete digital volume
Usability and User Experience
Read this individual research paper free through the original publisher, or explore the full digital proceedings book.
ISBN 978-1-964867-70-0
Explore this ISBN in the AHFE Bookstore ↗Listed in the July 2026 bookstore catalogue; search by ISBN to confirm current availability · Digital book purchase optional