Yue Shan, Xin Chen, Li Yan (2025). A Comprehensive and Quantitative framework of User Experience Evaluation in GenAI software. In: Usability and User Experience. AHFE Open Access, vol. 194, pp. 112–119. https://doi.org/10.54941/ahfe1006673
Generative AI (GenAI) is transforming the software market by introducing innovative yet complex intelligent experiences across various applications. However, traditional user experience (UX) evaluation methods, such as SUS, UEQ, and CSAT, are inadequate for capturing key aspects of these AI-driven experiences including output diversity and relevance. Relying solely on user feedback also overlooks broader commercial objectives. To address these challenges, we propose a structured evaluation framework that balances user experience and business goals. This paper: a) defines four core metrics for AI-driven experiences—Functionality, Ease of Use, Intent Understanding, and Generation Quality—further broken down into 27 influential factors; b) establishes a quantitative approach that combines product decision-makers’ weighted metrics with user satisfaction ratings to create a comprehensive satisfaction scoring model. Empirical validation with six GenAI software products and 30 user surveys confirms that when weight data meets consistency validation (CR < 0.1), prioritizing high-weight, low-satisfaction metrics enables precise UX issue identification and targeted enhancements. This approach resulted in notable improvements in user satisfaction and NPS, showcasing the practical value of aligning weighted metrics with user feedback for effective product optimization.Our primary contribution is a measurement framework for evaluating GenAI software. It's designed to overcome the limitations of traditional metrics while aligning user experience with business strategy, providing actionable insights for product iteration. This framework is currently being tested across various domains. We will present its definitions, evaluation approach, metrics, and results in poster sessions to foster cross-industry discussions on GenAI software UX evaluation.
Generative AI (GenAI) is transforming cloud computing by enhancing service delivery, management, and efficiency (Kumar, 2024). Alibaba Cloud offers over 200 products to millions of customers, many of which have been transformed by GenAI. These products can be categorized into two types: AI-augmented products and AI-native products.
AI-augmented products are GenAI solutions based on traditional cloud services enhanced by generative AI. They improve tasks like automated
A Comprehensive and Quantitative Framework of User Experience Evaluation 113
content creation, natural language processing (NLP)-based assistance, or data-driven content generation, but their core operations do not rely entirely on AI.
AI-native products are entirely built on AI as the core technology. Their functionality and user interactions rely on AI models, such as deep learning, large language models (LLMs), or reinforcement learning, to deliver intelligent and autonomous experiences.
The rapid development of technology has created new challenges in evaluating user experience. Products integrating GenAI technologies face issues that traditional evaluation methods cannot address. These methods struggle to measure the uncertainty of intelligent services. For example, image generation systems may produce inconsistent outputs due to misinterpreting contextual information. Existing tools fail to capture the dynamic and evolving nature of such experiences. To solve this problem, we propose a measurement framework for evaluating GenAI software. This framework overcomes the limitations of traditional metrics. It aligns user experience with business goals. Additionally, it provides actionable insights to guide product improvement.
RELATED WORK
Traditional UX evaluation methods and tools, such as the System Usability Scale (SUS), the User Experience Questionnaire (UEQ) (Bangor et al., 2008), and Customer Satisfaction (CSAT) (Inan Nur et al., 2021), typically emphasize “usability” and “ease of use.” However, they do not include metrics for assessing intelligent experiences. As a result, these methods fall short in thoroughly capturing users’ true perceptions of AI application (Brdnik et al., 2022). This limitation is becoming increasingly evident.
Currently, the evaluation of AI agent focuses mainly on model output performance, content quality, and user satisfaction (Höök, 1998). Model performance assessment examines response speed, security, stability, and resilience to interference. Content quality assessment emphasizes the accuracy of emotional expression, consistency, handling of anomalies, and ethical compliance (Chang et al., 2024). However, these evaluations tend to concentrate on the effectiveness of large models and do not yet fully encompass the overall user experience.
METHODOLOGY
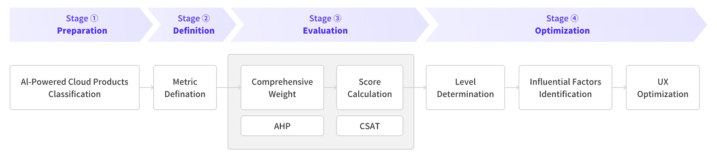
To meet the measurement needs of intelligent products, the framework defines metrics covering multiple dimensions of user experience. Scores are computed by combining weighted metrics from decision-makers with user satisfaction ratings, ensuring balanced assessment from dual perspectives. These scores evaluate the overall user experience and are presented as product ratings. Figure 1 shows the framework’s measurement process.
Figure 1: The measurement process of the framework.
Define Metrics Firstly, it is essential to define the appropriate metrics for evaluating the overall user experience (UX) of AI-powered cloud products. The study recommends assessing these products using four specific metrics, each of which is further decomposed into several influential factors (Pu et al., 2011). These metrics and factors are derived from the fundamental functional and intelligent perceptual components (see Table 1).
1. Functionality evaluates the completeness and practicality of product features in meeting user needs (McNamara and Kirakowski, 2006). 2. Ease of use assesses factors such as ease of learning, convenience, visual design, response speed, and interaction fluidity. This includes aspects like operational simplicity, process smoothness, interface aesthetics, performance stability, and the quality of help services. 3. Intent Understanding measures the accuracy of semantic parsing and error recognition in understanding user intent. 4. Generation Quality focuses on the relevance, accuracy, authenticity, diversity, and creativity of AI-generated content (Faruk et al., 2024), ensuring both information security and a positive emotional experience.
Table 1: Metrics and influential factors of UX evaluation in GenAI software.
Table available in the original PDF paper.
Metrics Influential Factors Functionality Problem Solvability/Demand Fulfillment Ease of use Recognizability/Learnability/Operability/Visual
Assess Metric Weighs and User Satisfaction Recognizing the varying importance of key metrics across different product types and domains, this study adopted an experimental approach to determine the weight of each metric. Six products were evaluated, including one content creation product, one conversational product, and one data
A Comprehensive and Quantitative Framework of User Experience Evaluation 115
analysis product, each from both AI-augmented and AI-native categories. Eighteen decision-makers from Alibaba Cloud, each with over three years of experience, assessed the importance of four metrics using the Analytic Hierarchy Process (AHP) (Radziwill and Benton, 2017)to systematically derive metric weight coefficients.
To evaluate overall user satisfaction, 30 participants were recruited to experience the core functions of six products and complete a satisfaction questionnaire. Two researchers observed the entire process to ensure the fairness and accuracy of the ratings. The questionnaire employed a five- point Likert scale (where 1–3 indicates lower satisfaction and 4–5 indicates higher satisfaction) and included options for influential factors, allowing participants to provide feedback on the factors influencing their scores. This approach not only quantified overall satisfaction but also identified influential factors affecting user experience, thereby providing precise feedback for product optimization.
Functionality 0.268 0.332 0.372 0.064 0.219 0.199 Ease of use 0.406 0.189 0.097 0.083 0.260 0.259 Intent Understanding
0.177 0.232 0.306 0.484 0.251 0.254
Generation Quality Metrics with a weight exceeding 0.25 are considered highly significant. A greater weight value indicates that decision-makers place increased importance on the metric, identifying it as a critical focus area for enhancing the product user experience. From Table 2, it is obvious to find AI-augmented product attributes greater significance to functionality and ease of use, while AI-native product prioritizes intelligent metrics such as intent understanding and generation quality. In terms of product domains, AI-native content creation product emphasizes the importance of generation quality, whereas conversational product, being highly interactive, prioritizes intent understanding and ease of use.
Table 3: Calculated user satisfaction score for each metric.
Functionality 4.13 3.25 3.5 3.86 3.33 3.69 Ease of use 4.75 3.69 3.75 4.00 4.00 3.77 Intent Understanding
3.88 3.45 3.63 3.67 3.67 3.54
Generation Quality
Traditional UX evaluation methods prioritize low-scoring items for optimization but overlook the importance of metric weights. As shown in Table 3, in AI-augmented content creation products, although generation quality has the lowest score (3.88), its weight is also the lowest (0.177), indicating that it may not need to be prioritized for improvement. Conversely, in AI-native conversational products, both functional satisfaction and intent understanding have the lowest scores (3.33). However, since intent understanding carries the highest weight, decision-makers should prioritize improving UX of this metric. To properly assess Alibaba Cloud’s products, decision-makers should conduct a comprehensive evaluation of satisfaction levels across various offerings. This approach ensures more effective resource allocation by concentrating on metrics that significantly impact the overall user experience, rather than merely targeting those with lower satisfaction scores.
Identify Influential Factors and Optimizations A single metric’s satisfaction score cannot reflect the overall satisfaction with a product. Therefore, this study provides an objective and quantitative evaluation tool. By aggregating the weighted satisfaction scores of each key metric, we can calculate an overall user satisfaction score that comprehensively reflects the product’s overall satisfaction. A higher score indicates that the product is more aligned with its development goals and user expectations.
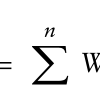
The satisfaction score (Ei) for each key metric uses a five-point scale, while the weight (Wi) of each key metric is represented as a value between 0 and 1. The final product overall user satisfaction score (S) can be calculated using the following formula:
Equation reproduced from the original PDF.
After deriving the overall satisfaction score through quantitative analysis, the scores are categorized into three levels: Level A [4.5,5] indicates high satisfaction; Level B [4,4.5) indicates moderate satisfaction with room for improvement; Level C [1,4) indicates low satisfaction requiring significant enhancement. As shown in Table 4, none of the six products reached the A-level standard.
Table 4: Overall user satisfaction scores and influential factors.
Table available in the original PDF paper.
Product Type
Product Domain
Influential Factors for Improvement
Overall User Satisfaction Score
Overall User Satisfaction Level
4.36 B Problem Solvability
AI- Augmented
Content Creation Conversation 3.41 C Demand Fulfillment Data Analysis 3.51 B Problem Solvability
Continued
A Comprehensive and Quantitative Framework of User Experience Evaluation 117
Table 4: Continued Product Type Product Domain
Table available in the original PDF paper.
Influential Factors for Improvement
Overall User Satisfaction Score
Overall User Satisfaction Level
4.10 B Accuracy
AI-Native Content Creation Conversation 3.59 B Effectiveness Data Analysis 3.63 B User Request Understanding
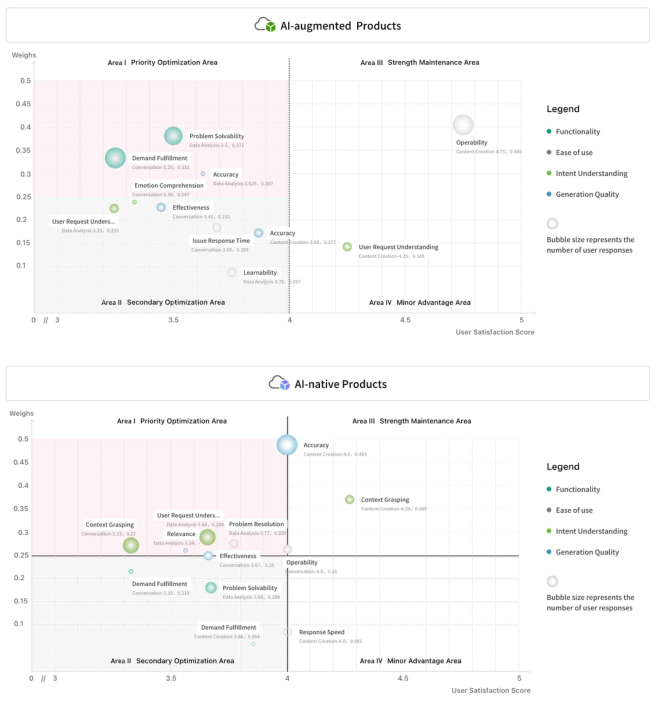
Figure 2: Quadrant chart of influential factor distribution.
To identify the key issues affecting user experience satisfaction, we adopted a quadrant analysis chart, as shown in Figure 2, to evaluate the distribution of critical influencing factors. In this framework, the X-axis represents satisfaction scores for each metric, while the Y-axis represents the weight of each metric. Each dot represents an influencing factor within the four core metrics (Functionality, Ease of Use, Intent Understanding, and Generation
Quality). Colors differentiate metric categories, while dot size correlates with user selection frequency. Larger dots indicate factors identified by more users; smaller dots show less frequently selected factors. This visualization reveals both critical factors by quadrant position and commonly identified user concerns. By using satisfaction scores of 4 and weight values of 0.25 as dividing lines, the chart is split into four regions. The upper-left quadrant (low satisfaction, high weight) is defined as the core area requiring priority attention.
After further analyzing the factor distributions for AI-Augmented and AI-Native products, we found that the key influencing factors for AI-Augmented products are mainly concentrated in foundational metrics. In contrast, the key factors for AI-Native products are more distributed across intelligent-level metrics. By combining the frequency of user selections (indicated by dot size), we were able to accurately pinpoint the critical factors that significantly impact satisfaction across all product types.
We validated the framework by analyzing NPS trends before and after improving key experience factors, showing a strong positive correlation between user satisfaction and NPS, confirming its effectiveness. We recommend that decision-makers and design teams prioritize metrics with high weight but low satisfaction, addressing the root causes behind them. Optimizing these areas improves user experience and enhances competitiveness.
CONCLUSION
The main contribution of this work is twofold: a) It defines four core metrics for GenAI user experiences—Functionality, Ease of Use, Intent Understanding, and Generation Quality—along with 27 influential factors. These address the lack of intelligent metrics in traditional evaluation methods.
b) It establishes a quantitative approach by combining weighted metrics from product decision-makers with user satisfaction ratings. Through user experiments and quadrant-based data analysis, we identified the distribution of influential factors, screened key factors, and validated the approach’s reliability using NPS tools. Together, these elements form a comprehensive satisfaction scoring model.
This framework has been applied to real cases on Alibaba Cloud, where the evaluation results have been refined into actionable, tiered design strategies. These strategies offer valuable and precise insights for designers and product teams. However, while our study evaluates multiple dimensions of user experience, it also highlights certain limitations. The limited sample size, though sufficient for preliminary insights, underscores the need for broader and more diverse data collection to ensure the generalizability of our findings. Future research will focus on assessing the scalability and adaptability of this framework across various product domains. We believe this approach will contribute to advancing the quantification of GenAI-driven experiences, drive deeper academic discussions, and support further innovations in UX evaluation.
A Comprehensive and Quantitative Framework of User Experience Evaluation 119
ACKNOWLEDGMENT
The authors sincerely thank our team members for their collaboration and effort, as well as our business partners at Alibaba Cloud for their valuable support, which was instrumental to our research outcomes.
REFERENCES
Bangor, A., P. T. Kortum and J. T. Miller (2008). “An empirical evaluation of the system usability scale.” Intl. Journal of Human–Computer Interaction 24(6): 574–594. Brdnik, S., T. Heriˇcko and B. Šumak (2022). “Intelligent user interfaces and their
evaluation: A systematic mapping study.” Sensors 22(15): 5830. Chang, Y., X. Wang, J. Wang, Y. Wu, L. Yang, K. Zhu, H. Chen, X. Yi, C. Wang and Y. Wang (2024). “A survey on evaluation of large language models.” ACM Transactions on Intelligent Systems and Technology 15(3): 1–45. Faruk, L. I. D., D. Pal, S. Funilkul, T. Perumal and P. Mongkolnam (2024).
“Introducing CASUX: A Standardized Scale for Measuring the User Experience of Artificial Intelligence Based Conversational Agents.” International Journal of Human–Computer Interaction: 1–25. Höök, K. (1998). Tutorial 2: Designing and evaluating intelligent user interfaces.
Proceedings of the 3rd international conference on Intelligent user interfaces. Inan Nur, A., H. B. Santoso and P. O. Hadi Putra (2021). The method and metric of user experience evaluation: a systematic literature review. Proceedings of the 2021 10th International Conference on Software and Computer Applications. Kumar, A. (2024). “AI-Driven Innovations in Modern Cloud Computing.” arXiv
preprint arXiv:2410.15960. McNamara, N. and J. Kirakowski (2006). “Functionality, usability, and user experience: Three areas of concern.” interactions 13(6): 26–28. Pu, P., L. Chen and R. Hu (2011). A user-centric evaluation framework for
recommender systems. Proceedings of the fifth ACM conference on Recommender systems. Radziwill, N. M. and M. C. Benton (2017). “Evaluating quality of chatbots and intelligent conversational agents.” arXiv preprint arXiv:1704.04579.
LISTED IN THE AHFE DIGITAL BOOKSTORE CATALOGUE
Explore the complete digital volume
Usability and User Experience
Read this individual research paper free through the original publisher, or explore the full digital proceedings book.
ISBN 978-1-964867-70-0
Explore this ISBN in the AHFE Bookstore ↗Listed in the July 2026 bookstore catalogue; search by ISBN to confirm current availability · Digital book purchase optional