Sheau-Farn Max Liang, Jiunn-Horng Lian (2021). Effects of Loading Lags and Displays on Television Viewing Experience. In: Advances in Affective and Pleasurable Design. AHFE Open Access, vol. 14. https://doi.org/10.54941/ahfe100589
Information communication technology industry now focuses on the market of interactive televisions. However, user requirements in this growing market have not been fully understood. Television viewing experience can be regarded as a type of user experience, and this study aims to assess the effects of video loading lags and displayed loading indicators on users' television viewing experience. A 2×5 between-subject factorial experiment was designed. The first independent variable was the loading display with two types: a text-only animation and an animated text with a running percentage bar. The second independent variable was the loading lag with five durations: 1, 5, 10, 15, and 20 seconds. One hundred university students were recruited as participants to watch two music videos with an assigned loading lag and display in between, and then to complete a questionnaire about their satisfaction and pleasure. Results showed that there was a significant effect of loading lags on user interaction satisfaction and pleasurability. A marginal significant effect of loading displays on pleasurability was also found. Post-hoc comparisons revealed that the loading lag should be limited up to 15 seconds for maintaining satisfaction, and up to 10 seconds to sustaining pleasure. Findings of this study can provide useful guidelines for the design of interactive televisions.
Interactive television is predicted as the next surge in the market following the widespread use of mobile phones and tablet computers. There are several relevant terms about the interactive television, such as internet protocol TV (IPTV), connected TV, and internet TV to highlight the connection with the internet, digital TV to emphasize the digitalization, and smart TV to feature various types of application software. These terms are interchangeable with the terms used in this paper, interactive TV, which gives emphasis to viewers' interactions with TVs. With the capability of interaction, people now can "use" TV instead of just "watching" TV.
A set-top box linked to a digital TV screen is the most popular approach of connecting the networks. While many manufacturers of set-top boxes exist, few of them have considered user requirements in their product development process. Consequently, specifications of interactive TVs are mainly decided according to development costs but not user requirements. Thus, users often have degraded experience when they watch interactive TV through a set-top box. One commonly found annoyance is a loading lag. A loading lag may be due to limited bandwidth of networks, poor performance specifications, and/or information content sizes. All these issues are resolvable through the technology. However, many manufacturers hesitate to take any action since it is difficult for them to estimate the return on investment, that is, the extent to which viewing experience will be improved by an investment in enhancing specifications. To provide a clearer picture of this issue, this study aims to assess the relationship between loading lags/displays and television viewing experience, so that some useful guidelines can be derived for the design and development of interactive TVs.
Television viewing experience can be regarded as a type of user experience (UX). As defined by the ISO 9241- 210 standard, UX is "person's perceptions and responses resulting from the use and/or anticipate use of a product, system or service" (ISO, 2010). This perception and response process is influenced by both a top-down (knowledge- driven) processing and a bottom-up (stimulus-driven) processing (Wickens et al., 2004) so that people's UX is influenced by their prior knowledge and expectation of the use as well as by the interaction with products, systems or services during the use. While it appears that no research findings are yet available concerning the relationship between loading lags/displays and television viewing experience, it seems worthwhile to review literature on the waiting time for downloading a web page. Several recommendations have been made about the upper time limits of loading a web page. While Nielsen (1996) suggested 15 seconds as the threshold to maintain users' interests, Zona Research (2001) applied its 8-second rule. Various empirical results can also be found. Selvidge et al. (2002) reported that no significant effect of loading delays among 1, 10, and 20 seconds on user frustration, but significant increases of frustration level were found from the delay of one second to the delay of 30 seconds, and from the one second to the 60 seconds. Ramsay et al. (1998) manipulated loading delays from two seconds to two minutes and suggested that users would lose their interests as the delay exceeded 41 seconds. Hoxmeier and DiCesare (2000) examined the relationship between the system response times of 0, 3, 6, 9, 12 seconds and user satisfaction. Their results showed that satisfaction decreased as response time increased, and a significant decrease of satisfaction was found around the response time of 12 seconds. Nah (2004) concluded that the majority of users would abandon a downloading web page if the delay exceeded two seconds, but their waiting times would be prolonged as a feedback during the wait was displayed on the screen. In general, the increase of loading lags accumulates demerits. Furthermore, as shown in previous research, different tasks and contexts seem to have different tipping points about the lag limit that make significant shift in terms of users’ attitudes and behaviors. Therefore, this study attempted to examine the tipping point of TV viewing experience with the method described in the next section.
METHOD
Participants One hundred university students were recruited as participants. Thirty-seven were female and sixty-three were male. Their average age was 24.5 years old with a standard deviation of 2.1 years old. Among the participants, 58% of them have had the experience of watching interactive TVs, and 96% of them have had the experience of watching TV programs through the internet.
The Experiment A 2×5 between-subject factorial experiment was designed with loading displays and loading lags as the two independent variables, and participants’ responses about their satisfaction and pleasure as the dependent variables. While the two types of loading displays were a simple text loading animation and the text animation with a percentage progress bar, five durations of the loading lags were 1, 5, 10, 15, and 20 seconds. Responses from participants were collected through a questionnaire modified from the questionnaire for user interaction satisfaction
(QUIS) (Shneiderman, 1997) and the questionnaire for pleasurability (Jordan, 2000). The scale of the questionnaire was from 0 to 10.
As shown in Figure 1, two loading animations were designed. The text-only feedback (Figure 1 (a)) just displayed the text of “Loading” with three running dots behind, whereas the other feedback (Figure 1 (b)) added a percentage progress bar below the text.
(a) (b)
Figure 1. Loading displays: (a) text only; (b) text with percentage bar The experiment was conducted in a typical living room set-up with a TV, a remote control, and a sofa. Participants were randomly assigned to one of the ten experiment conditions. For each condition, participants were first asked to watch a four-minute music video on a TV, then to play the next music video with pressing a button on a remote control. Once the button was pressed, the assigned loading display was shown on the screen for the duration of assigned loading lag. The second music video would be displayed on the TV after the lag, and was stopped at about ten seconds for participants to complete their questionnaires.
RESULTS
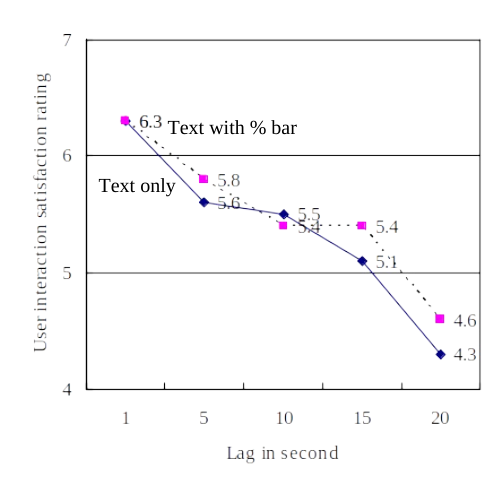
User Interaction Satisfaction The relationship between loading lags/displays and user interaction satisfaction ratings is illustrated in Figure 2. In this figure, the dotted line represents the trend of ratings as the loading text with a percentage bar was displayed, whereas the solid line represents the trend as only the loading text was displayed. As can be seen, both dotted line and solid line have declined in a similar manner with an increase in the loading lag. Compared to a relatively flat trend for the lags from five to 15 seconds, there appear steeper decreases from one to five seconds, and from 15 to 20 seconds.
Text with % bar Text only
Figure 2. Relationship between loading lags/displays and user interaction satisfaction ratings
Results of the ANOVA showed that there was a significant effect of loading lags on user interaction satisfaction ratings (F(4, 90) = 2.936, p = 0.025), however, the effect of loading displays, as well as the interaction effect of the lag and the display, were not significant on the rating. Results of the post-hoc comparison of the ratings among five loading lag levels revealed that significant difference existed for the lags of one second and 20 seconds at the p < 0.05 level.
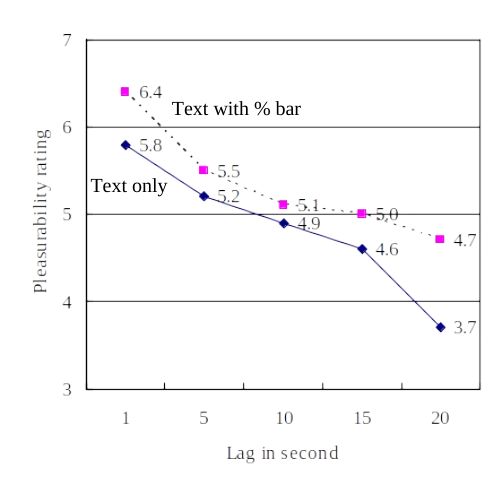
Pleasurability The relationship between loading lags/displays and pleasurability ratings is illustrated in Figure 3. Same as in the previous figure, the dotted line in this figure represents the trend of ratings as the loading text with a percentage bar was displayed, whereas the solid line represents the trend as only the loading text was displayed. As can be seen, both dotted line and solid line have declined with an increase in the loading lag. However, different from the satisfaction ratings in Figure 2, all the dotted line is above the solid line. Moreover, the downward trend for the dotted line seems relatively convex compared to the trend for the solid line which is relatively concave.
Text with % bar
Text only
Figure 3. Relationship between loading lags/displays and pleasurability ratings
Results of the ANOVA showed that there was a significant effect of loading lags on pleasurability ratings (F (4, 90) = 5.367, p = 0.001). A marginal significant effect of loading displays on the rating was also found (F (1, 90) = 3.431, p = 0.067), however, the interaction effect of the lag and the display was not significant. Results of the post-hoc comparison of the ratings among five loading lag levels revealed that significant difference existed for the lags of one second and 15 seconds, and for the lags of one second and 20 seconds. Both were at the p < 0.05 level.
DISCUSSION
In conclusion, the loading lag may be limited under 15 seconds to achieve a better user interaction satisfaction, and under 10 seconds to obtain a more pleasant viewing experience. This result is in line with previous reports (e.g., Hoxmeier and DiCesare, 2000; Nielsen, 1996; Zona Research, 2001). The addition of a progress percentage bar on the loading display could marginally enhance the viewing experience compared to a simple text loading animation. This finding is consistent with previous research (e.g., Nah, 2004). It is expected that this loading display would be significantly enhance the viewing experience if it compared to a dark screen without any loading indicator.
It appears that the lag limit for a pleasant viewing experience is shorter than the one for the user interaction satisfaction. Since the questions for user interaction satisfaction are more about functional aspects of usability and the questions for pleasurability are more about emotions and feelings, this finding implies that users' feelings rather than attitudes towards functional usability are easier to be affected by loading lags. Additional research in this issue should prove quite beneficial.
ACKNOWLEDGEMENT
This research was funded by the National Science Council of Taiwan (NSC 101-2221-E-027-005-MY3).
REFERENCES
Hoxmeier and DiCesare (2000, August). System response time and user satisfaction: An experimental study of browser-based applications. Proceedings of the Americas Conference on Information Systems, Long Beach, CA, 140-145. ISO (2010). "Ergonomics of human-system interaction- Part 210: Human-centred design for interactive systems", ISO 9241-210,
International Organization for Standardization, Geneva, Switzerland. Jordan, P. W. (2000). “Designing pleasurable products”. UK: Taylor & Francis. Nah, F. F. (2004). A study on tolerable waiting time: How long are Web users willing to wait? Behaviour & Information Technology, 23(3), 153-163. Nielsen, J. (1996). Original top 10 mistakes in web design. Retrieved February 21, 2014, from the Nielsen Norman Group
website: http://www.nngroup.com/articles/original-top-ten-mistakes-in-web-design/ Ramsay, J., Barbesi, A. and Preece, J. (1998). A psychological investigation of long retrieval times on the world wide web.
Interacting with Computers, 10(1), 77-86. Selvidge, P. R., Chaparro, B. S. and Bender, G. T. (2002). The world wide wait: Effects of delays on user performance.
International Journal of Industrial Ergonomics, 29, 15-20. Shneiderman, B. (1997). “Designing the user interface: Strategies for effective human-computer interaction”. 3rd. Eds., MA: Addison-Wesley Longman. Wickens, C. D., Lee, J., Liu, Y. and Becker, S. G. (2004). "An Introduction to Human Factors Engineering". 2nd. Eds., NJ:
Pearson Prentice Hall. Zona Research (2001, April). The need for speed II. Zona Market Bulletin, Issue 05, 1-9.
LISTED IN THE AHFE DIGITAL BOOKSTORE CATALOGUE
Explore the complete digital volume
Advances in Affective and Pleasurable Design
Read this individual research paper free through the original publisher, or explore the full digital proceedings book.
ISBN 978-1-4951-2109-8
Explore this ISBN in the AHFE Bookstore ↗Listed in the July 2026 bookstore catalogue; search by ISBN to confirm current availability · Digital book purchase optional