Oleg Zhvalevsky, Sergey Roudnitsky (2022). Modelling And Simulation With Biofeedback For Operators Of Human-Machine Systems. In: Neuroergonomics and Cognitive Engineering. AHFE Open Access, vol. 42, pp. 25–31. https://doi.org/10.54941/ahfe1001815
Introduction. The simulators are designed for human-machine systems operator training process. It is more appropriate to estimate current operator efficiency and the operator professional readiness level for operator training process effectiveness. Operator functional state monitoring during training process is useful for detection of operator efficiency decreasing. The biofeedback based of operator functional state monitoring can increase operator training process effectiveness. The work is concern with different approaches to development of simulators for human-machine systems incorporated with biofeedback based of operator functional state monitoring.Hypothesis. The work targeted to experimental validation of hypothesis that biofeedback can significantly increase operator training process effectiveness.Aim. The aim of the work is to select features are used for operator efficiency estimation, and to formalize the concept of operator task complexity.Methods. The measurement procedure is viewed as computer simulator. Simulation consists of functional tests series step by step from low complexity level to high complexity level. There are reach stimuli represented by geometric figures. Each figure is characterized by color, shape, size and method of appearance on the screen. Simple stimulus leads to simple operator deeds, but complicate stimulus leads to complicate operator deeds. Each complicate stimulus can be represented as sequence of elementary stimuli. The set of permissible figures and permissible appearance methods are the description of simulation structure. Each functional test is to presentation of fixed complexity level stimuli. The basic features are used for operator efficiency estimation are: reaction speed and reaction exactness. These parameters objectively decrease as a result of stimulus complexity level increasing. Accordingly, there are more sophisticated features such as tiredness degree and operator functional limit.Discussion. The work is concern with measurement experiment is used for operator efficiency estimation. There are some features such as: reaction speed, reaction exactness, tiredness degree and operator functional limit. These parameters demonstrate a strong variability. Accordingly, we need investigate influence of figures characteristics to measurement experiment results individually for each operator. So, there is requires implementation additional psychology tests (for each operator) and comparison their results with computer simulation. Different methods of stimuli formation for the solving this problem are consider and investigate. The question is required by particular consideration is: can we represent the sequence of simple stimulus as complicate stimulus. Biofeedback introduction to simulation leads to possibility of selection of individual complexity level for each operator, and detection of individual functional limit for each operator. Furthermore, biofeedback guarantees robust operator efficiency estimation. Also, biofeedback can help operator to increase his concentration, and increase operator training process effectiveness.Conclusions. Human-machine systems operator efficiency estimation is need for increase the level his functional readiness to prevent critical cases in real world. The technique of operator efficiency estimation is proposed and proved in the paper. Stimuli are described and formalized. The preliminary measurement experiment results are represented. The future considerations linked with more complicated simulators, which can simulate some real world tasks. Also, there is an interest in clarification of biofeedback role in increasing of operator training process effectiveness.
The simulators are designed for human-machine systems operator training process. It is more appropriate to estimate current operator efficiency and the operator professional readiness level for operator training process effective- ness. There is a big interest in collection of representative experimental data and developing of data processing technique for objective operator efficiency estimation. It can be consider as the main problem formulation for an inve- stigation in human-machine systems development research area. So, the main goal of the investigation is to develop sophisticated simulator environment for operator training process, and technique for modelling operator deeds and operator efficiency estimation. The paper deals with basic aspects of applying of this approach. The beginner level simulator and some important models are proposed in the paper.
Operator functional state monitoring during training process is useful for detection of operator efficiency decreasing. The biofeedback based of operator functional state monitoring can increase operator training process effectiveness. The work is concern with different approaches to development of simulators for human-machine systems incorporated with biofeedback based of operator functional state monitoring.
The paper is organized as follows. There are two sections in the paper. The simulator environment presents in the first section. The modelling technique describes in the second section. In both sections, the role of biofe- edback in development of simulators for human-machine systems considers.
These sections are followed by conclusions involving discussion of future investigations directions.
SIMULATOR ENVIRONMENT AND MEASUREMENT EXPERIMENT TECHNIQUE The measurement procedure is viewed as computer simulator. The user (human-machine system operator) playing some specialized “games”. During these “games” operator observes several visual stimuli and realizes his reacti- ons or deeds. Simulation consists of functional tests series. Each functional test is to presentation of fixed complexity level stimuli. So, if we want to esti- mate operator efficiency, we should organize a sequential procedure ordered step by step from low complexity level to high complexity level. Furthermore, we should propose an exactness and reliable scale for complexity level, and adequate characteristics for operator efficiency estimation.
There are reach stimuli represented by geometric figures. Each figure (elementary stimulus) is characterized by color, shape, size and method of appearance on the screen. Simple stimulus leads to simple operator deeds, but complicate stimulus leads to complicate operator deeds. Each complicate stimulus can be represented as sequence of elementary stimuli. The set of per- missible figures and permissible appearance methods are the description of simulation structure (“game” structure).
For example, let us organize measurement experiment, which consists of three figure types presentation for operator, and operator reactions registra- tion. Operator should press the “mouse” button for each presentation of desired figure type. Figures are demonstrated with certain frequency during each functional test. The “game” is organized as a functional tests sequence ordered from low figure presentation frequency to high figure presentation frequency. In this easy “game” organization figure presentation frequency is the same as complexity level. So, we can organize a “games” sequence, where each separate “game” linked with certain figure presentation fre- quency. In more advanced organized “game” complexity level linked with complex figures characteristics.
The figure color is selected from the certain set of permissible colors. It can be a small set for easy functional tests, and it can be a big set for compli- cated and advanced functional tests. The figure shape selection is based on uniform distribution, so each figure has the same probability of appearance (“triangle”, “square”and “circle”). Also, the figure position on the screen has uniform distribution for each dimension (vertical and horizontal dimension). In easy “game” organization the figure size is fixed, but in more advanced organized “game” figures can dynamic change its size in sequence of figures. Each complicate stimulus can be represented as sequence of simple figure, closely followed by one another, but from the point of view of analysis this sequence considers as singleton.
Each figure has the period time — a duration between two consequence figures presentations. This period is obviously inversely to the frequency fixed in advance. Let be τ a period. Also, each figure has two periods. The first period T is time of figure existence on the screen: the figure is showed in
Modelling and Simulation with Biofeedback for Operators of Human-Machine Systems 27
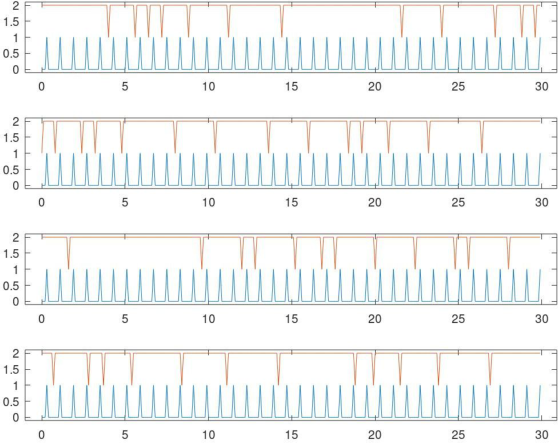
Figure 1: Example of experimental data. Three types of figures (the first top three plots) and operator deeds (the last bottom plot) labeled by red color. The target figure type is 2. Figures sequence is labeled by blue color, and corresponds to time sequence
K t* i
Equation reproduced from the original PDF.Equation reproduced from the original PDF.
the start of this period, and the figure is hided in the end of this period. The second period T∗is duration between two consequence figure’s appearances on the screen. So, τ = T + T∗. In other hand, each figure has a time of appearance on the screen, a time of disappearance on the screen in accordance with standard approach. In more advance “game” organization the display degree is dynamic parameter. In particular, this way is useful for generate pulsation figures.
In example τ is equal one second, there are 30 different figures in test sequence (for 30’s seconds measurement experiment duration). Fixing τ we can variate the parameter T. It can organize a sequence of functional tests for each period T from 100 ms to 900 ms with the step 100 ms. Small period T leads to some difficulties for operator to keep pace with stimulus, but long period T∗can provoke operator’s errors. And, on the contrary, long period T leads to some difficulties for operator to differ one figure from another. So, we can fix period T∗(the real difference between to consequence figures) and variate period T.
Figure 1 demonstrate an example of functional test. Operator should press the “mouse” button after each appearance of figures of type 2. Figures sequ- ence is shown in Figure 1 with the lag. Let ti be a begin time of figure presentation (the time of figure appearance on the screen) for figure num- ber i (i = 1, K), where K is a count of figures. So, let t∗
i be an end time of figure presentation (the time when figure hides from the screen) for figure number i (i = 1, K). As it described below, it is more appropriate to use t∗ i instead of ti for experimental data analysis.
28 Zhvalevsky and Roudnitsky
The basic features are used for operator efficiency estimation are: reaction speed and reaction exactness.
Reaction speed is estimated as time period between the time of figure appe- arance and the times of operator deed. In simple case, operator deed is a pressing keyboard or “mouse” button. Accordingly, reaction deed’s sequence is viewed as a stream of point events. In more advanced “game” more com- plicate operator reactions are required, so operator reactions cannot consider as point events. In particular, operator can press multiple buttons in desira- ble sequence as it occurs in keyboard training programs. Furthermore, we may register not only pressing buttons down but also pressing buttons up, and so on.
h
i
In simple case, each time of operator deed belongs to appropriate time interval [ti, ti + 1]. But, if figure period τ is small and/or reaction time is big (e.g. figure period τ is smaller than reaction time), the reaction event can occur in the next time interval [ti + 1, ti + 2] or later, that leads to difficulty of reaction time determination and construction the exactness map between stimuli and operator deeds. The simple method for solving this problem is a holding the introductory experiment for reaction time determination with long figure period τ and small period T. We can increase period T and/or decrease period τ, and determine the limit, when reaction time stops to cor- rect determination. It is optimally, when only one reaction event belongs to time interval [ti, ti + 1], but indeed it is easy make sure that only one reaction event belongs to another time interval
t∗
. This way allows estimate i + 1
i , t∗
the quality of experimental data, and improve the exactness of data analysis results. Also, it is possible to use a mean values ti = (ti + t∗ i ) 2 as bound points instead of t∗ i . The complicate method for solving the problem is a considera- tion a set of reaction time values and construction the map between stimuli and operator deeds for each reaction time under estimation. The value, which guarantees the most exactness of map construction, can consider as reliable estimation for reaction time.
Exact map between stimuli and operator deeds leads to correct reaction exactness. The simple method for reaction exactness calculation is to calcu- late dismissals. Let as to divide figures into two classes: target “positive”class and “negative” alternate class. Accordingly, there are two types of errors: the first error type is false negative (when operator forgets to press the button), and the second error type is false positive (when operator must not press the button). If we want to have the detailed information about operator decision, we should separately calculate false positive for each nontarget class.
Reaction speed and reaction exactness objectively decrease as a result of stimulus complexity level increasing. Introduction biofeedback leads orga- nize more sensitive estimation of these characteristics. Indeed, in the first step we can change period T and determine the values when the operator exactness became the maximum. In the second step we can decrease period T∗to provoke operator to make errors (when operator ceases to keep pace with stimuli presentation). Al last, in the third step we can increase period T∗ to improve the exactness of construction map between stimuli and operator deeds, and to decrease operator errors. These steps may repeat multiple times
Modelling and Simulation with Biofeedback for Operators of Human-Machine Systems 29
for estimation much more sophisticated features such as tiredness degree and operator functional limit.
PROBABILISTIC MODELS FOR STIMULI GENERATION AND DATA ANALYSIS There are two different (opposite one another) processes. The first process is a process of stimuli generation. It is a primary process, being under full con- trol by experimenter. The second process is a process of operator deeds. It is a secondary process. The first process relatively simpler than the second pro- cess. It is more appropriate to use models based on Poisson distributions and their variations: Poisson Processes, event streams and Point Processes. (Cox & Smith 1961; Cox, 1962; Cox & Isham, 1980) The main idea is to estimate parameters of the second process models and compare them with parame- ters of the first process models. Accordingly, the second process models may consider as data analysis models.
There are several levels of model description stimuli generation. The first level is corresponded to regular streams or event flows. Regu- lar event flows are characterized by event frequency or, on the other hand, intensity of the stream. As soon as figure presentation period T is small in comparison with full period τ, we can consider each stimulus as point event. Also, full period τ must be bigger than operator reaction time. But, if period T is compatible with full period τ then stimulus does not consider as point event.
The second level is corresponded to Simple Poisson Processes. These pro- cesses have some properties: ordinary (simplicity), independence (in time) and stationarity (temporal homogeneity). And, vice versa, each ordinary, indepen- dence and stationarity process is Simple Poisson Processes. Simple Poisson Processes has characterizes by constant intensity.
Another approach to stimuli generation is to consider as a sequence of pairs (T, T∗). These pairs generate alternating process involving two types of time periods. The first time periods T has a distribution independent on a distribution of the second time periods T∗. Operator reaction sequence also can consider as a sequence of the same pairs, but their distributions may not be independent. Introduction biofeedback leads to continuously variate an intensity of event flow due to setting certain operator’s rate.
The third level is corresponded to Nonstationary Poisson Processes. There are proposed many different types of Nonstationary Poisson Processes models: renewal processes, Double Poisson Processes and Cox Processes.
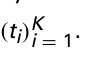
At first, we can consider Simple Poisson Process (ti)K
Equation reproduced from the original PDF.
i = 1. This way is also useful for organize the biofeedback because parameters of increment distribution can change due to changes of current operator characteristics values.
At second, we can use random time periods (Ti)K
Equation reproduced from the original PDF.
At third, we can use mixed distribution functions and dynamical change the main distribution function, which is corresponded to weights of partial distribution, also due to changes of current operator characteristics values.
30 Zhvalevsky and Roudnitsky
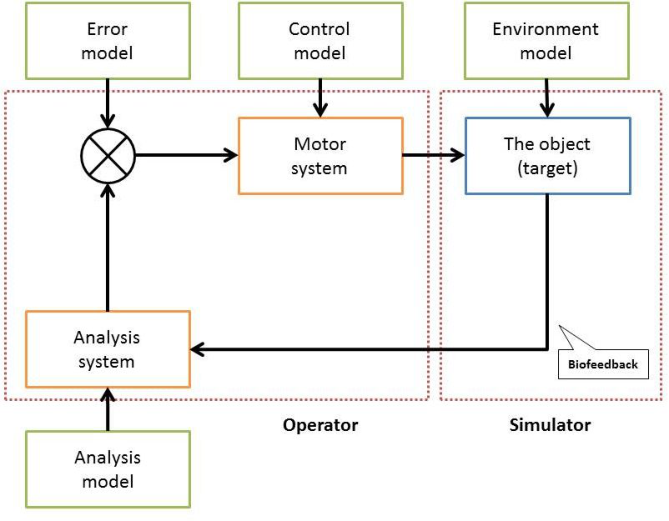
Figure 2: General scheme of simulation and modelling of the human-machine systems with biofeedback.
The high (fourth) level is corresponded to nonordinary processes. Indeed, we can consider each stimulus as a set of events. This approach is more appro- priate for generation complicate stimuli, when each stimulus represents as a sequence of simple stimuli or as a complex of different figure aspects (para- meters and characteristics). In particular, we can random select shape, size, color and appearance method for each separate figure in the different way and combination.
Selection of the model of operator’s deeds flow is determined by current research task. If the event flow model lies on the certain level, then operator’s deeds flow model must select on the next level. In general, we can consider both types of flows as a Poisson Processes with decimation or a composi- tion (summation) of several Simple Poisson Processes. So, operator’s deeds characteristics can define in terms of structure both types of selected models.
Figure 2 summarize the aim of the simulation and modelling of the human- machine systems with biofeedback.
CONCLUSION
Human-machine systems operator efficiency estimation is need for increase the level his functional readiness to prevent critical cases in real world. The paper is concern with measurement experiment is used for operator efficie- ncy estimation. Different methods of stimuli formation for the solving this problem are consider and investigate. The preliminary measurement experi- ment results are represented. In particularly, some features (such as reaction
Modelling and Simulation with Biofeedback for Operators of Human-Machine Systems 31
speed, reaction exactness, tiredness degree and operator functional limit) were estimates. These parameters demonstrate a strong variability. Accordin- gly, we need investigate influence of figures characteristics on measurement experiment results individually for each operator. So, there is requires imple- mentation additional psychology tests (for each operator) and comparison their results with computer simulation. The question is required by particular consideration is: can we represent the sequence of simple stimulus as com- plicate stimulus. Biofeedback introduction to simulation leads to possibility of selection of individual complexity level for each operator, and detection of individual functional limit for each operator. Furthermore, biofeedback guarantees robust operator efficiency estimation. Also, biofeedback can help operator to increase his concentration, and increase operator training process effectiveness.
The future investigations are linked with more complicated simulators, which can simulate some real world tasks. Also, there is an interest in clarification of biofeedback role in increasing of operator training process effectiveness. And, of course, the main direction of future investigation is modeling and development of the experimental data processing technique based on some sophisticated machine learning approaches to reconstruction the exact map between stimuli and operator deeds (Swamidass at al, 2010; Skiena, 2017; Géron, 2017).
The reported study was funded by budget research work number FFZF- 2022-0003.
REFERENCES
Cox D.R., Smith W.L. (1961). Queues. Methuen. Cox D.R. (1962). Renewal Theory, Methuen Cox D.R., Isham V. (1980). Point Processes, Chapman & Hall/CRC. Géron A. (2017). Hands-On Machine Learning with Scikit-Learn and TensorFlow: Concepts, Tools, and Techniques to Build Intelligent Systems. O’Reily, Beijing. Skiena S.S. (2017). The Data Science Design Manual. Texts in Computer Science.
Springer, Cham. https://doi.org/10.1007/978-3-319-55444-0_1 Swamidass S. J., Azencott C., Daily K., Baldi P. “A CROC stronger than ROC: measuring, visualizing and optimizing early retrieval”, Bioinformatics. 2010. N 26 (10). P. 1348–1356.
LISTED IN THE AHFE DIGITAL BOOKSTORE CATALOGUE
Explore the complete digital volume
Neuroergonomics and Cognitive Engineering
Read this individual research paper free through the original publisher, or explore the full digital proceedings book.
ISBN 978-1-958651-18-6
Explore this ISBN in the AHFE Bookstore ↗Listed in the July 2026 bookstore catalogue; search by ISBN to confirm current availability · Digital book purchase optional