Robert Pettys Baker, Jerritt Smith, Megan Clarke, Emily Cook, Baonhia Xiong, Minji Yu, Linsey Griffin (2022). A Contemporary Investigation into Anthropometric Dimensions and Applications for Design 70 Years After the Average Man. In: Design for Inclusion. AHFE Open Access, vol. 45, pp. 37–44. https://doi.org/10.54941/ahfe1001867
In 1952, Gilbert S. Daniels published his seminal report “The ’Average Man’?” which examined the measurements of 4,063 active United States Air Force personnel (Daniels. 1952). This report detailed a profound yet simple finding: that after eliminating for ten common anthropometric measurements, no one person meets the average for all body dimensions. We analyzed Two anthropometric data bases over two studies, following an updated version of Daniels’ (1952) original method. The biggest changes were not eliminating the top and bottom percentiles of the population, and adjusted the calculation to find middle 25-30%. The databases examined were ANSUR II (Gorden et al., 2014) and CAESAR (Robinette et al., 2002), to see how civilian and military populations compare. The results of both studies were generally consistent with Daniels (1952), however we did discover that some individuals were able to meet the criteria for average after ten measurements. The best performance took place in the ANSUR II combined condition, all three individuals were men. This last part is especially important to note, as the combined sample eliminated women out of the sample faster than men. Being eliminated after the sixth measurement. This confirms a potential bias to combining men’s and women’s measurements without great care. Based on our analysis of modern anthropometric databases using Daniels’ original method it is clear that, while we found some “average people”, the significance of its findings holds true. This is not to say we should ignore the average, but we should understand its use in context and strive to go beyond it. Thinking past a formative understanding of how people are shaped, and instead into what is needed to create well-fitting products for a specific population. Examples spanning several industries merely scratch the surface of what needs to be addressed. Looking around as we go through our day, minor and major inconveniences become apparent. They cannot be all fixed at once, but through diligent research and thoughtful design we can use the principles of universal design to our advantage. Looking ahead to the next 70 years, a continued growth in optimizing products for the individual user and helping these users understand why these optimizations matter is not just desirable, but important.
In 1952, Gilbert S. Daniels published his “The Average Man?” and detai- led a profound yet simple finding: there is no person who meets the average measurement of ten common anthropometric measurements (Daniels. 1952). The result of this brief technical note is obvious after hearing them, but it is a seed from which much modern design theory has grown. Principles of univer- sal design, accessible design, and user experience design can all be linked in some way to this work. Beyond design theory, this paper influenced a vari- ety of industries in years both directly and indirectly. Some 70 years after the original publication, multiple fields have had to address the collective non-average nature of people.
Anthropometric methods have also expanded beyond what was available in 1952. New technologies like 3D scanning have revolutionized how mea- surements are taken, and samples have become more diverse, including: the addition of women, civilian data collection, increased racial and ethnic diver- sity, and collection in different areas of the world (Robinette et al. 2002; TC2, 2006; KATS, 2006). This research study recontextualizes the original results through modern databases, discusses what, if anything, has changed, and examines improvements that should be made in the vast fields of design and engineering.
The following research questions guided this study:
1. Does Daniels’ (1952) discovery that there is no average person remain true when repeated with modern, diverse datasets? 2. Has modern design followed the advice provided by Daniels (1952)?
LITERATURE REVIEW
The Average Man The results of the original study are based on measurements taken from 4,063 active flying United States Air Force (USAF) personnel (Daniels, 1952). One of the goals of this massive endeavor was to use the data to redesign and build new airplane cockpits to match the dimensions of the “average pilot” for the United States Air Force. Cockpits at the time were still being designed and built based on the fixed cockpit design and measurements of male pilots dating back to 1926 (Rose, 2015; Randall, 1946).
This methodology for cockpit design however proved to be disastrous resulting in a large number of non-combat related accidents (an occurrence in which an individual(s) suffers death or serious injury or in the case that an aircraft received substantial damage) and incidents (an occurrence other than an accident which could or does interfere with aircraft operation and safety), which at its worst saw seventeen crashes in one day (Rose, 2015; Electronic Code of Federal Regulations, 1988). These mishaps were initially attributed to pilot error, however as these accidents and incidents increased, it became obvious that the cockpit design needed to change (Rose, 2015). This indi- cated an urgent need to address the rapid advancement and development of new aircraft technology in the years following World War II, as well as update cockpit design to match the modern-day pilots’ dimensions.
A Contemporary Investigation into Anthropometric Dimensions and Applications 39
Cultural Importance The notion of looking beyond the average is a concept that found a home in many disciplines of design. Universal design broadly has focused on making design usable and accessible to all, regardless of ability, body size/shape, or other factors that are diverse in the human population (Story, 2001). The clear importance of exploring design alternatives and innovating may perme- ate the design discourse. However, universal design solutions do not always make it to the actual product design/development phase due to long ingrained industry common practices. For example, the apparel industry often relies on rigid grading rules based on standardized, mass-market sizing metrics (Sch- ofield and LaBat, 2005), having moved away from the more custom market that was in place before the 1930’s (Scranton, 1994; Parsons, 1998). This leads to poor garment sizing, which impacts everyone from plus-size con- sumers (Sokolowski, Griffin, & Silbert, 2019) to essential workers (Janson, Clift, & Dhokia, 2021).
METHOD AND DATA ANALYSIS Original Method
Daniels’ original method for identifying the average was a relatively straight forward process. Ten common anthropometric measurements were selected for his analysis. These were: stature (height), chest circumference, sleeve length, crotch height, vertical trunk circumference, hip circumference, neck circumference, waist circumference, thigh circumference, and crotch length. Stature acted as the core measurement. To eliminate outliers, the tallest and shortest 5% of the stature data were removed. All other measure- ments for these individuals were removed from the dataset as well. The mean-average and standard deviation was then calculated for each of the measurements. Daniels defined average as being the middle 25–30% of the different measurements. He calculated this using the following formula:
Mean+/−SD ∗(.3)
Individuals were then eliminated if they did not fall within this range. Starting with stature, this same process was used to evaluate the other measure- ments sequentially in the order listed in above. As participants were elimi- nated, all of their data was removed, winnowing the remaining participants down until none remained.
Alterations to Method To maintain consistency with the original method of analysis, the same mea- surements or equivalent measurements, for each database to be evaluated. Further, the measurements were processed in the same order that Daniels did in the original study. Measurement definitions were not provided in the ori- ginal text, so measurements from the databases were selected based on best fit based on naming and comparisons to Daniels’ (1952) reported average numbers.
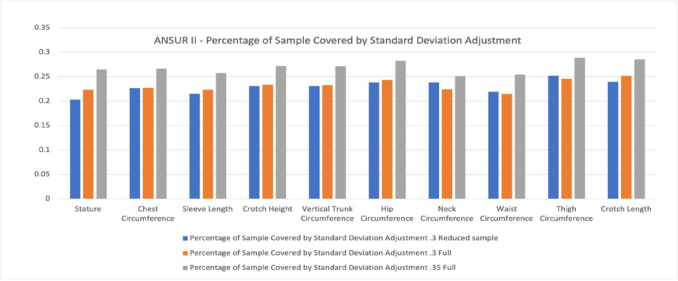
Figure 1: Percentage of Sample Covered by Different Standard Deviation Adjustments.
There were some deviations from the original method in this analysis. Modern design practices seek to cover people of all sizes, and as a result a deviation from the original method was used to reflect this. Rather than remove the top and bottom 5% of the population by stature, the full data sets were included to capture the entire population. Additionally, it tended to provide a better population fit for the average. As stated previously, Dani- els’ method defined the average as 3/10ths the standard deviation added and subtracted from the mean of each measurement to reach approximately 25%–30% of the population (1952, p. 5). However, when replicating this method with ANSUR II data it was discovered that this method only captu- red roughly 20%–25% of the population. Using the full population tended to increase the number of people defined as average, but still did not reach 25%–30%. By changing the standard deviation adjustment to multiplying the standard deviation by 3.5/10ths instead of 3/10ths, all measurements fell into the 25%–30% range. The percentages for each measurement are shown in Figure 1.
Beyond this, Daniels’ original process of adding and subtracting the stan- dard deviation adjustment from each measurement to outline the bounds of the average was repeated. These were then used as the elimination criteria for each measurement. One measurement at a time, the individuals’ whose measurements did not fall within the defined average were removed. For individuals who fell within the average range, it was indicated whether they fell above or below the rounded mean-average, or exactly met the rounded mean-average. This process was repeated for each of the ten measurements winnowing the sample with each measurement. Ultimately, the population was reduced down until all ten measurement eliminations have been passed or until there are no individuals left to compare.
STUDY To extend this study past a mere repetition of the original study, the analysis focuses on comparing the ANSUR II and CAESAR databases by population type: Civilian and Military.
A Contemporary Investigation into Anthropometric Dimensions and Applications 41
ANSUR I & ANSUR II The ANSUR database is composed exclusively of United States military personnel and is one of the largest open-source anthropometric databases available to the public. ANSUR I was first released in 1988, and ANSUR II was published in 2017 (Gorden et al., 2014). ANSUR II data is comparable to the original Average Man paper as they both cover military populati- ons. However, the ANSUR II database contains a larger total sample, and includes women. The database consists of 4082 adult men and 1982 adult women. A total of 93 direct measurements from around the body, as well as 3-dimensional scans of the whole body, head, and right foot are included in the report, as well as demographic data.
CAESAR The Civilian American and European Surface Anthropometry Resource Pro- ject (CAESAR) project began collecting anthropometric data in 1997, with the final reports published in 2002 (Robinette et al., 2002). This database is composed of 4,300 individuals from both North America (United States & Canada) and Europe (Italy & Netherlands) between the ages of 18-65. The CAESAR database contains both three dimensional (3-D) anthropometric scans and standardized length and circumference measurements. CAESAR contains data from 1264 female and 1127 male subjects, with a total of 99 anthropometric measurements, in addition to demographic data. What sets the CAESAR database apart from ANSUR II, is that it represents a civilian population, which one would assume covers a more diverse size population than found in military populations.
The working assumption is that a military population would be more homogenous in size and shape, and that a civilian population would be more heterogeneous in size and shape. Data from all individuals from each dataset were used to maximize the population size for each test. Both datasets were examined individually. Once all data processing was complete, comparisons between the two sets to determine if any individuals were considered average. The percentage of remaining participants after every measurement are com- pared against each other to see changes over time. Individuals that fell into the average were indicated as being within the upper or lower bounds of the average or meeting the mean-average according to the methodology.
RESULTS
Tables 1 and 2 show the breakdown of the analysis for the ANSUR II and CAESAR databases and how well the population fared in trying to find an average person.
Upon evaluation, the first thing detail to stand out is that, unlike Daniels’ (1952) original work, the ANSUR II data showed that multiple individuals met the average for all ten measurements. All three of the individuals were men, but met the exact average of the measurements, and were instead within the upper and lower bounds of the defined average. The CAESAR data was more consistent with the original work, and only had participants meet the
average through nine measurements. Given these results, it is safe to say that the high benchmark of clearing the averages of the ten separate measurements set by Daniel’s (1952) is possible to overcome.
DISCUSSION
The key question that must be asked when reflecting on the results is whether these findings truly discredit the original average man paper (Daniels, 1952). In the ANSUR II analysis, only .049 percent of the population remained. The global population is estimated to be around 7.9 billion people, which would mean that if the percentages hold, somewhere around 387.1 million people could theoretically be considered “Average People”. This is an impressive number when considered in this abstract form, but it is not as simple as this makes it seem.
It should be noted that this calculation doesn’t take into account child and teenage populations who were not included in either database. Therefore, only adults would need to be considered when trying to identify the potential population size. It also doesn’t account for the actual shape of the body these measurements occur. Even people of the “same size”can have their body mass shaped in different ways (Carufel & Bye, 2020). Perhaps most importantly, these hundreds of millions of people are likely not centrally located. Meaning
A Contemporary Investigation into Anthropometric Dimensions and Applications 43
any individual looking for these “average persons” would have to find them at great expense and time. In answer to the first research question, it is still best to heed Daniels’ advice “... that the ‘Average Man’ is usually not the solution to the design problem” (Daniels. 1952, p. 4).
As for the second research question, modern design has come a long way in addressing the variable and differing needs of the global population. Yet, bad habits are hard to shake when it comes to using anthropometric data in design. A key example comes from plus size fashion design. While plus size clothing has been in the zeitgeist for a long time, recent decades have seen body positivity come to the forefront of fashion. Proper sizing and fit are desirable for this population, and it is often their biggest issue with clothing (Chowdhary, & Beale, 1988). While it is exciting to see such prominence, Sokolowski, Griffin, & Silbert (2019) note that mainstream big box retailers are not meeting the needs of this population despite having a market value of 20.4 billion dollars. Reliance on practices like proportional grading continue to leave this population with ill-fitting clothing.
Another major pain point for anthropometrics in design is differences in body shape between genders. Products are typically tailored to the dimensi- ons of cisgender men, even one’s that are meant to be unisex. For example, a study conducted by Stanney, Fidopiastis, and Foster (2020) found that women disproportionately experience VR induced motion sickness as a result of poor headset fit, which was attributed to poor alignment of the user’s pupils with the lenses in the VR headset. Personal Protective Equipment has also seen major fit issues that are further exacerbated by gender-based shape differences (Janson, Clift, & Dhokia, 2021; Regenold et al., 2021). Overall, moving towards more customized and adjustable fit of adaptable products is needed in industries designing and producing product for human wear or use. This suggests that the answer to the second research question is that modern design has not gone far enough. The reluctance to move beyond the average continues to hinder product design and development by focusing on convenience over user experience.
LIMITATIONS/FUTURE WORK In the end, this repetition Daniels’ (1952) original work is limited in several ways. For example, examining other anthropometric databases like SizeUSA or SizeKorea may perform differently based on geographical differences. Additionally, this work didn’t consider other factors such as gender to sepa- rate out for analysis. Given the body differences between sexes, this may produce different results than when they are combined. Moving forward it would be interesting to see what measurements are important to different industries, and see if the elimination process changes when they’re applied. Further analysis of the measurements used in the methodology to see how common they are in design use cases may also yield interesting results. It could be that there are more relevant measurements than the ones used here.
CONCLUSION
As true as it was in 1952, the average person is essentially a myth. While some “average people” were found, the proportion is small enough to be
practically useless in reality This is not to say that averages don’t have their use, but understanding the context of its use and its impact on the end product is essential to good design practice. This will require moving beyond the way bodies and anthropometrics are thought about presently, and instead into what will create well-fitting products for a specific population. Producing products that are adapted to the individual user will be essential to the future to design, as well as aiding users’ understanding of why these optimizations matter. The tools are there, they just need to be utilized. Looking at the people around you, recognizing what makes their product experience unique, and developing design solutions that take these human factors into full account.
REFERENCES
Carufel, R., & Bye, E. (2020). Exploration of the body–garment relationship theory through the analysis of a sheath dress. Fashion and Textiles, 7(1), 1–28. Chowdhary, U., & Beale, N. V. (1988). Plus-size women’s clothing interest, satisfacti-
ons and dissatisfactions with ready-to-wear apparel. Perceptual and Motor Skills, 66(3), 783–788. Daniels, G. S. (1952). The” Average Man”?. Air Force Aerospace Medical Research Lab Wright-Patterson AFB OH. Gordon, C. C., Blackwell, C. L., Bradtmiller, B., Parham, J. L., Barrientos,
P., Paquette, S. P., … Kristensen, S. (2014). 2012 Anthropometric Survey of U.S. Army Personnel: Methods and Summary Statistics. Retrieved from http://tools.openlab.psu.edu/publicData/ANSURII-TR15-007.pdf Janson, D. J., Clift, B. C., & Dhokia, V. (2021). PPE fit of healthcare workers during the COVID-19 pandemic. Applied Ergonomics, 103610. KATS (2015), The 7th Size Korea Report, Korean Agency for Technology and
Standards, Seoul. Randall, F. E. (1946). Human body size in military aircraft and personal equipment.
Retrieved from http://resource.nlm.nih.gov/101708835 Regenold, N., & Vindrola-Padros, C. (2021). Gender Matters: A Gender Analysis of Healthcare Workers’ Experiences during the First COVID-19 Pandemic Peak in England. Social Sciences, 10(2), 43. Robinette, K. M., Blackwell, S., Daanen, H., Boehmer, M., Fleming, S., Brill,
T., Burnsides, D. (2002). Civilian American and European Surface Anthropo- metry Resource (CAESAR), Final Report. Volume 1. Summary. Retrieved from https://www.humanics-es.com/CAESARvol1.pdf Rose, T. (2015). The End of Average: How We Succeed in a World that Values Sameness. New York, NY: HarperCollins. Scranton, P. (1994). The Transition from Custom to Ready-to-Wear Clothing in Philadelphia, 1890–1930. Textile history, 25(2), 243–273. Sokolowski, S. L., Griffin, L., & Silbert, J. (2019, July). The Variability of US
Women’s Plus Size Product Sizing and Self-Identified Size 18 Bodies. In Interna- tional Conference on Applied Human Factors and Ergonomics (pp. 124–133). Springer, Cham. Stanney, K., Fidopiastis, C., & Foster, L. (2020). Virtual reality is sexist: but it does not have to be. Frontiers in Robotics and AI, 7, 4. Story, M. F. (2001). Principles of universal design. Universal design handbook. TC2 (2006), “The US national size survey”, available at: www.tc2.com/what/sizeusa/index.html.
LISTED IN THE AHFE DIGITAL BOOKSTORE CATALOGUE
Explore the complete digital volume
Design for Inclusion
Read this individual research paper free through the original publisher, or explore the full digital proceedings book.
ISBN 978-1-958651-21-6
Explore this ISBN in the AHFE Bookstore ↗Listed in the July 2026 bookstore catalogue; search by ISBN to confirm current availability · Digital book purchase optional