Niels Hinricher, Chris Schröer, Claus Backhaus (2022). Design of control elements in Virtual Reality - Investigation of factors influencing operating efficiency, user experience and presence. In: Human Factors in Virtual Environments and Game Design. AHFE Open Access, vol. 50, pp. 100–109. https://doi.org/10.54941/ahfe1002066
The ergonomic design of control elements in real life has been researched in detail. Various studies exist on the optimal dimensioning, their haptic and acoustic feedback to achieve high control accuracy and user experience. But the development of products is increasingly done with virtual prototypes. Virtual reality (VR) allows these prototypes to be tested in a highly immersive environment. However, the findings from reality cannot be transferred to VR directly. For example, users in VR interact with the prototypes using controllers, which affects haptic feedback. This study investigates how rotary dials and joysticks must be designed and programmed in VR so that control tasks can be performed efficiently and generate a high user experience and perceived presence.In user tests, subjects (n = 25) evaluate the control of a joystick and a rotary dial in VR. In a virtual crane operator's cabin or at a virtual table, the subjects (f = 10, m = 15, age: 24 +- 3) perform four predefined tasks per control element. On two screens in VR, subjects see a vertical bar graph with a scale from 0 to 100 % controlled by the joystick and separately a numerical value between 0 and 100 % which is controlled by the rotary dial. The screens display the task to the subjects, e.g., "Set the value from 0 % to 42 %". According to the method “design of experiments”, 14 factors, such as vibration feedback, acoustic feedback, position of the subject or the sensitivity of the control element are systematically varied on two respectively three levels (e.g., diameter of actuator 40 mm, 80 mm or 110 mm). For each trial, the control accuracy and the time required to complete the task are determined. In addition, the perceived presence is assessed using the Slater-Usoh-Steed-Questionnaire and the user experience is surveyed using the User Experience Questionnaire. The effect of a change of level on the response parameters is investigated using multifactorial ANOVA (α = .05). Linear regression is used to calculate a mathematical relationship between factor and response parameter. These mathematical models are used to calculate which factor values can be used to achieve a high level of control accuracy with a low time requirement and a high level of user experience and perceived presence. The factors angular resolution, inclination, shape of the rotary dial and position of the subject have a highly significant effect (p ≤ .001) on the time required to complete the tasks with the rotary dial. On the control accuracy of the rotary dial, the angular resolution, the VR-controller and the interaction of angular resolution and diameter of the rotary dial have a significant effect. On the user experience, a total of six factors and two interactions have a significant effect. On the perceived presence of the subjects, the VR environment and the diameter of the rotary dial have a significant effect. The calculated optimized design is a rotary dial with vibration feedback, without acoustic feedback, with visualization of a rough knurling, an angular resolution of 10-12 degree/value, a 40 mm diameter and no inclination. Visualization of the hand should be avoided.Sensitivity, size, subject position, VR environment, and the interaction of subject position and VR environment have a significant effect on the time required to perform the control tasks with the joystick. Three factors and one interaction have a significant effect on the control accuracy of the joystick. The interaction of the factors vibration feedback and visualization of the hand has a significant effect on the perceived presence of the subjects. On user experience, nine factors and five interactions have a significant effect. The calculated optimized levels of factors for the joystick are vibration and acoustic feedback, no visual feedback, vertical handle with a height of 20-24 cm, a five-level angular resolution, a maximum deflection angle of +- 15°, a sensitivity of 8 %/sec and a visualization of the hand.The trials show a high degree of scatter. The residuals show outliers in the experiments. These deviations are mainly due to the individual previous experience of the test subjects in handling VR systems. Nevertheless, significant effects could be identified. A screening experimental design was used in this study. In a follow-up study, detailed investigations with a full factorial experimental design must be performed with the significant factors. The factors will be tested at multiple levels and with a significantly increased number of trials to further increase the accuracy of the mathematical models.
In order to discover potential usage problems early in the development pro- cess, user tests are conducted on functional prototypes. The production of prototypes is expensive and time-consuming (Zhou et al., 2019). For this reason, companies are increasingly using virtual prototypes (Bullinger and Dangelmaier, 2003). Virtual reality (VR) technologies provide the opportu- nity to test the usability of virtual prototypes in a simulation of the intended use environment (Salwasser et al., 2019). Components of many prototypes include human-machine interfaces (HMI), such as touchscreens, rotary or rotary-push controls, joysticks, or variations of these. Studies and textbooks exist on the optimal dimensioning of these actuators and their haptic and acoustic feedback to achieve high control accuracy and user experience (UX) (Schmid et al., 2019; Reisinger, 2009; Schmidtke and Jastrzebska-Fraczek,
Design of Control Elements in Virtual Reality - Investigation 101
2013). However, the findings from these studies cannot be applied to virtual prototypes. Parameters such as the detent moment of rotary controls cannot be simulated in VR. Therefore, virtual prototypes are often examined in a mixed reality environment (Bolder et al., 2018). Here, virtual environments are mixed with real controls. Especially in very early development phases, fully virtual prototypes are advantageous. Different HMIs can be tested with- out needing to produce multiple prototypes. However, due to the reduced feedback, controls in VR cannot be operated as precisely as in reality. This leads to a reduction in control accuracy and control speed, which limits the evaluation of the usability and UX of virtual prototypes (Bruno et al., 2010; Stamer et al., 2020).
A major influence on the results of user tests in VR is the feeling of “being there” (presence) of the users (Busch et al., 2014). A low Presence results in a low UX. The user is aware that it is a simulation, which changes their behavior (Lorenz et al., 2018).
It follows that HMIs in VR must be adapted to the changed modalities, but the interactions must still be realistic enough to generate a high presence. Studies that investigate how HMI controls must be designed in VR in order to enable efficient operation with a high level of user experience and presence are not yet available.
This study investigates how rotary controls and joysticks must be designed in VR so that control tasks can be performed as quickly and precisely as possible. In addition, it will be investigated which control parameters have an effect on the UX, the presence and the perceived workload.
METHODS
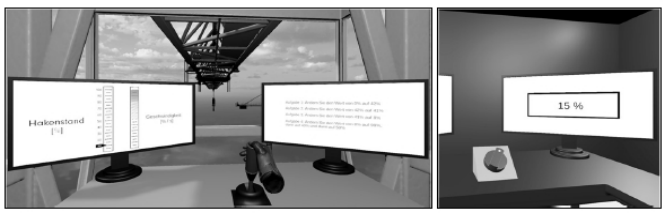
Experimental Setup and Procedure In user tests, subjects (n = 25) test the control of a joystick and a rotary con- trol in VR. The head-mounted display “Valve Index” (Valve Corp., USA) is used to visualize the VR environment. Interaction with the control devices in VR is performed with the Valve Index controllers or with HTC Vive control- lers (High Tech Computer Corp., Taiwan). The subjects (f: 10, m: 15, Age: 24 ± 3 years) perform four tasks per control in VR. There, the subjects see two screens. One screen shows a vertical bar graph with a scale from 0 to 100% for the operation of the joystick or a numerical value between 0 and 100% for the examination of the rotary control (see Fig. 1). On the other screen, the subjects see the tasks shown in Table 1.
Each subject tests both controls in randomized order. The time for proces- sing the tasks (time on task) is measured. In addition, the position accuracy is determined by counting and summing up positioning errors. If, for example, the test person turns the rotary control in task 1 and reaches a value of 14 instead of 12, then turns back to 11 and then to the required value of 12, 3 errors are noted.
After completing the tasks, the subjects evaluate the control device and the user test in terms of perceived presence with the Slater-Usoh-Steed- Questionnaire (SUSQ) in a German adapted version (Wall et al. 2018). In addition, the user experience is surveyed with the User-Experience
Figure 1: Experimental setups in the VR. Left: VR environment crane cabin, joystick, visualization of hand, visual feedback. Right: VR environment table, rotary control with knob, inclination 45°.Table 1. Tasks of the user tests.
Table available in the original PDF paper.
Task Rotary control Joystick 1 “Set the value from 0 to 12”. “Set the value from 0 to 42”. 2 “Set the value from 12 to 11”. “Set the value from 42 to 41”. 3 “Set the value from 11 to 31”. “Set the value from 41 to 8”. 4 “Set the value of 31 to 10, then to 15, then to 8”.
“Set the value of 8 to 98, then to 40, then to 50”.
Questionnaire (UEQ) (Laugwitz et al., 2008) and the perceived workload with the NASA RAW-TLX in the German short version (Hart, 1986).
Design of Experiments In the method of design of experiments, several factors are varied simulta- neously. The factors are varied according to a defined system (experimental design), so that the effect of a single factor can be statistically calculated. The factors and the examined levels are shown in Table 2. The maximum (+) and minimum (−) values are selected to have the largest possible difference within a realistic range.
The inclination of the rotary control describes the angle between the con- trol device and the table (see Fig. 1. Right: inclination 45°). The angular resolution describes the sensitivity of the rotary control. With an angular resolution of 10 °/value, the rotary control must be turned by 10° so that the value displayed on the screen changes by one.
For the examination of the joystick, the maximum deflection angle is varied. I.e. the joystick can be deflected from the zero position (perpendi- cular to the table) e.g. by a maximum of 30° (level 0) to the front and to the back. The factor max. positioning speed describes the maximum possible rate of change in the respective maximum deflection. The factor angular resolu- tion describes the relationship between the deflection angle and the change in the percentage value of the bar graph. In case of a linear (+) angular reso- lution, the change of the positioning value is proportional to the deflection angle. With a 3-stage (−) angular resolution, three angular ranges are defined
Design of Control Elements in Virtual Reality - Investigation 103
Table 2. Factors of the experimental design. After each experiment run, the levels (−, 0, +) of the factors are systematically varied.
Table available in the original PDF paper.
Factor − 0 + Rotary control Angular resolution 10 °/Value — 45 °/Value Diameter 40 mm 80 mm 110 mm Inclination control device 0 ° 45 ° 90 ° Shape Knurling Knob Cylinder Joystick Max. Angle of deflection 15 ° 30 ° 45 ° Max. positioning speed 2,5 %/s 5 %/s 10 %/s Size (vertical / horizontal) 15 / 7 cm 24 / 11 cm 32 / 15 cm Angular resolution 3-Stage 5-stage linear Visual feedback Yes — No Shape horizontal — vertical Rotary control and joystick
Haptic feedback Yes — No Acoustic feedback Yes — No Hand visualization Yes — No Position of the subject Sitting — Standing VR environment Table — Crane Input device used HTC Vive — Valve Index
in which the change in positioning value is the same. A joystick with verti- cal handle (cf. Fig. 1. left) and a joystick with horizontal handle, similar to a thrust lever of airplanes, are tested. Either the test persons see only the bar graph (+) or an additional bar graph is displayed as visual feedback (−) of the current rate of change (cf. Fig. 1. left). For both control devices it is inve- stigated whether haptic or acoustic feedback as well as the visualization of the hand have an effect on the evaluation parameters. If the subject activates for example the joystick, a hand grasping the joystick is visualized in VR. If there is no visualization, the subject only sees the joystick and its deflection. If a value is changed, the subject hears a click and/or feels a vibration of the controller.
The Valve Index Controllers (+) have integrated sensors to detect the hand and finger positions. This makes it possible to “grasp” the control devices similar to reality. For the HTC Vive controllers (−), interaction is done by bringing the controller close to the control device and pressing the “trigger button” on the back of the controller.
In order to determine the effect of a single factor on the evaluation para- meters (time on task, positioning error, UX, presence, perceived workload), a response surface screening experimental design with 25 runs is created. The experimental design is created and randomized using Design Expert 13 software (Stat-Ease, Minneapolis, USA). The effect of a level change on the evaluation parameters is examined using multifactorial ANOVA (α = .05). Linear regression is used to calculate a mathematical relationship between factor and evaluation parameter. These equations are presented in coded form. Thus, the numerical factor values are not used in the equations, but -1 for the lower level and +1 for the upper level. With this equations, the
relative influence of a factor can be determined by comparing the factor coef- ficients. Equation 1 shows an example of a coded equation. The factor x1 is calculated by subtracting the mean value of the evaluation parameter (Y) of all runs with the level (+) from the mean value of runs with the level (−) and then dividing by 2 (Siebertz et al., 2017). In this example, the factor x1 has a positive effect and x2 a negative effect on the evaluation parameter Y.
Equation reproduced from the original PDF.
To verify the accuracy of the mathematical models, Cook’s distance is used. Cook’s distance indicates the change in the regression function when the values of an experimental run are not included. Large differences between Cook‘s distances are an indication of outliers. Cook‘s distances above a value of one are considered critical and can bias the model (Siebertz et al., 2017).
Subsequently, numerical optimization calculations are carried out with the mathematical models. Using the Design Expert software, it is calculated for each control device which factor values can be used to achieve a high level of control accuracy, UX and presence with a low level of time expenditure and perceived workload.
RESULTS
Rotary Control At least one factor has a significant influence on the evaluation parameters Time on Task (ToT), Accuracy (Acc.), Presence (SUSQ) and on the dimen- sions Perspicuity (UEQP), Efficiency (UEQE) and Novelty (UEQN) of the User Experience Questionnaire. Four interactions of factors have a significant influence on the evaluation parameters.
Table 3 shows the comparison of the factors and evaluation parameters, including the significance values calculated using variance analysis. If no significance value is entered, this factor has no significant effect (p ≥.05) on the respective evaluation parameter.
Table 4 shows the mathematical models for the calculation of the evalua- tion parameters. In addition, the adjusted coefficient of determination (R2Adj) and the signal-to-noise ratio (SNR) are shown. Factors shown in italics have no significant influence on the respective evaluation parameter. They are in the model because an interaction with this factor has a significant influence on the evaluation parameter.
For the parameter UEQP, the critical Cook’s distance is exceeded in one test run. All other calculated Cook’s distances are below 0.5.
The calculated optimized design of the factors for the lowest possible posi- tioning time and perceived workload, with high control accuracy, UX and presence is a rotary control with vibration feedback, without acoustic feed- back, with visualization of a knurling, an angular resolution of 10-12 °/value, a 40 mm diameter and no inclination. Visualization of the hand should be omitted. The rotary control should be operated using the Vive controller.
Design of Control Elements in Virtual Reality - Investigation 105
Table 3. Factors with significant effect on the evaluation parameters in the study of the rotary control.
Table available in the original PDF paper.
Factor ToT Acc SUSQ UEQP UEQE UEQN A <.001 .005 — — <.001 — B — — .035 .042 .043 — C <.001 — — <.001 — — D — — — — — — E — — — — — .018 F .001 — — — — — G <.001 — .032 — — — H <.001 — — .043 — — J .001 .049 — — — — K — — — .013 — — AB — .049 — — — — AK .002 — — — — — CH — — — — — .009 FJ — — .008 .002 — —
Table 5 shows the comparison of the factors and evaluation parameters, including the significance values calculated using analysis of variance for the joystick tests. At least one factor has a significant influence on the evaluation parameters Time on Task (ToT), Accuracy (Acc.), Presence (SUSQ), Perceived workload (NASA Raw TLX) and on the dimensions Attractiveness (UEQA), Perspicuity (UEQP), Efficiency (UEQE), Dependability (UEQD), Stimulation (UEQS) and Novelty (UEQN) of the User Experience Questionnaire.
Table 5. Factors with significant effect on the evaluation parameters in the study of the joystick.
Table 6 shows the mathematical models for the calculation of the evalua- tion parameters including the adjusted coefficient of determination (R2Adj) and the signal-to-noise ratio (SNR) for the examination of the joystick.
The critical Cook’s distance is not exceeded for any run. The calculated optimized factors for the joystick are haptic and acoustic feedback, no visual feedback, vertical grip with a height of 20-24 cm, a five-step angular resolu- tion, a maximum deflection angle of ± 15°, a maximum positioning speed of 8 %/sec, and visualization of the hand.
DISCUSSION
Using the Design of Experiments method, it was possible to identify factors that have a significant influence on the control accuracy, time, presence, UX and perceived workload when operating control devices in VR. With the help of the optimization calculations, factor values were calculated with which a high positioning accuracy, presence, UX and a low positioning time and perceived workload can be achieved. However, the results show high scatter in some cases. These are mainly due to the different previous experiences of the test persons with VR systems.
Design of Control Elements in Virtual Reality - Investigation 107
Table 6. Mathematical models of the joystick with coded factors.
A prerequisite for the application of Design of Experiments is that the factor levels can be changed independently of each other. For example, this makes it impossible to include optical hand tracking systems in the experi- mental design, since these do not allow haptic feedback. Changing the haptic feedback factor would therefore require the use of a different controller. A change in the level independent of other factors would not be possible.
The optimization calculation for the rotary control shows that a suitable angular resolution is 10-12 °/value. This value corresponds approximately to the lower level. 10 °/value was defined as the lower level because at a higher angular resolution, the acoustic and haptic feedbacks were no longer suffi- ciently perceptible when the rotary control was turned quickly. According to the optimization calculation, however, acoustic feedback can be dispensed with. In a subsequent experimental design, only the haptic feedback should be considered. Optimized modulation of the haptic feedback could change the lower level of angular resolution to 5 °/value. This will investigate whether an optimal angular resolution is actually 10-12 °/value.
Subjects took about 2 seconds longer to complete the tasks with the Index controller compared to the Vive controller (see Table 4: 1.1J *2). This is mainly due to re-gripping of the control device. With the Index con- troller, the hand must be opened and then the forearm rotated. With the Vive controller, only the index finger has to be released from the trigger button.
The factor max. positioning speed (A) has a negative effect on the positi- oning time and a positive effect on the positioning accuracy of the joystick. This means that an increase in the max. positioning speed leads to a reduction in the positioning time and to an increase in the number of positioning errors.
The 8 %/sec calculated by the optimization calculation is thus a compromise between positioning speed and positioning accuracy.
The factors acoustic feedback (K), haptic feedback (J) and visualization of the hand (M) have an effect on presence and UX. Overall, the subjects rated the joystick better when it had acoustic and haptic feedback and a hand enclosing the joystick was visualized.
A screening experimental design was used in this study. Screening experi- mental designs are used to identify factors that have a significant influence on the evaluation parameters. Thus, the mathematical models created and optimization calculations performed in this study provide only a rough ori- entation. In a follow-up study, detailed investigations will be carried out with the significant factors using a full factorial experimental design. The factors will be tested on several levels and with a significantly increased number of experiments in order to further increase the accuracy of the mathematical models.
REFERENCES
Bolder, A., Grünvogel, S. M., Angelescu, E. (2018). Comparison of the usability of a car infotainment system in a mixed reality environment and in a real car. In: Proceedings of the 24th ACM Symposium on Virtual Reality Software and Technology, Tokyo Japan. Bruno, F., Cosco, F., Angilica, A., Muzzupappa, M. (2010). Mixed prototyping for
products usability evaluation. In: Volume 3: 30th Computers 2010, pp. 1381– 1390. Bullinger, H.-J., Dangelmaier, M. (2003). Virtual prototyping and testing of in-vehicle interfaces. Ergonomics, 46, pp. 1–3. Busch, M., Lorenz, M., Tscheligi, M., Hochleitner, C., Schulz, T. (2014). Being there
for real - presence in real and virtual environments and its relation to usability. In: Proceedings of the 8th Nordic Conference on Human-Computer Interaction Fun, Fast, Foundational - NordiCHI’14, ACM Press, New York, p.117. Hart, S.-G. (1986). NASA Task Load Index (TLX). Volume 1.0; Paper and pencil package. Laugwitz, B., Schrepp, M., Held, T. (2008). Construction and evaluation of a user
experience questionnaire. In: Holzinger, A. (eds.) USAB 2008, LNCS, vol. 5298, pp. 63–76. Lorenz, M., Brade, J., Diamond, L., Sjölie, D., Busch, M., Tscheligi, M., Klimant, P., Heyde, C.-E., Hammer, N. (2018). Presence and User Experience in a Virtual Envi- ronment under the Influence of Ethanol: An Explorative Study. Scientific reports, 8 (1), p. 6407. Reisinger, J. (2009). Parameterization of the haptics of hand-operated actuators. PhD
thesis, Technical University of Munich. Salwasser, M., Dittrich, F., Melzer, A., Müller, S. (2019). Virtual technologies for user-centered design (VR for UCD). Possible applications of virtual reality in user- centered development. In: humans and computers 2019 - usability professionals. Bonn. Schmid, P., Winterholler, J., Maier, T. (2019). Investigation of the Relief Potential of
the Visual Perception Channel by the User-Centered Design of a Rotary Control Element. In: Stuttgart Symposium on Product 2019 Development. Schmidtke, H., Jastrzebska-Fraczek, I. (2013). Ergonomics: system design data and definitions. Germany: Carl Hanser Verlag GmbH & Company KG.
Design of Control Elements in Virtual Reality - Investigation 109
Siebertz, K., van Bebber D., Hochkirchen T. (2017). Statistical experimental design.
Germany: Springer Berlin Heidelberg. Stamer, M., Michaels, J., Tümler, J. (2020). Investigating the Benefits of Haptic Feedback During In-Car Interactions in Virtual Reality. In: Krömker, H. (eds.) HCI in Mobility, Transport, and Automotive Systems. Automated Driving and In-Vehicle Experience Design. Cham: Springer International Publishing, pp. 404–416. Wall, K. (2018). A mixed-methods investigation of the display fidelity of immersive
virtual vehicle prototypes. PhD thesis, Illmenau University of Technology. Zhou, X., Rau, P.-L. P. (2019). Determining fidelity of mixed prototypes: Effect of media and physical interaction. Applied ergonomics, 80, pp. 111–118.
LISTED IN THE AHFE DIGITAL BOOKSTORE CATALOGUE
Explore the complete digital volume
Human Factors in Virtual Environments and Game Design
Read this individual research paper free through the original publisher, or explore the full digital proceedings book.
ISBN 978-1-958651-26-1
Explore this ISBN in the AHFE Bookstore ↗Listed in the July 2026 bookstore catalogue; search by ISBN to confirm current availability · Digital book purchase optional