The paper deals with the analysis the environmental aspect of Urban sustainable transportation. The role of ecological situation in cities for maintenance of urban sustainable transportation is comprehensively examined. The author pointed out that the estimation of the rate emission level Nitrogen dioxide is crucial for im-proving current situation in Urban management. The proposed models were esti-mated using data collected in the cities by World Bank and were compared to de-termine which of them presented the best fit end the variables. The estimated models were useful in highlighting how different urban transportation factor to in-fluence on the rate of Nitrogen dioxide emission level.
Since the 1987 Brundtland Commission report (Our common future 1987) brought global attention to the concept of sustainable development, scholars and policy professionals have worked to apply its principles in the urban and metropolitan context. Sustainable development has proven to be an endu- ring and compelling concept because it points policy in a clear, intuitive direction, yet it is flexible enough to adapt to new technological, economic and social emerging issues. It is appealing to advocates and scholars alike because it implies a systemic view of economy and ecology, and requires comprehensive solutions that protect the interests of future generations. It is a testament to the power and utility of this concept that after nearly two decades, efforts to translate it into the mechanisms of urban policy conti- nue to flourish, despite tremendous political, economic, social, institutional, and technological challenges. Maintenance of the sustainable development of cities depends on a level of urban sustainable transportation. In all cities in the world today, the problem of the automobile and its environmental impact is a major issue (Goldman & Gorham, 2006). The issue of transportation and the environment is paradoxical in nature. From one side, transportation activities support increasing mobility demands for passengers and freight, and these ranges from urban areas to international trade. On the other side, transport activities have resulted in growing levels of motorization and con- gestion. As a result, the transportation sector is becoming increasingly linked
to environmental problems. With a technology relying heavily on the com- bustion of hydrocarbons, notably with the internal combustion engine, the impacts of transportation over environmental systems has increased with motorization (Tahzib & Zvijáková, 2012).
Pardo (Pardo, 2010) points out that the most visible and frequently menti- oned transport problem of a city is its traffic congestion, and it is well known that high levels of congestion create significant impact on local and national GDP. Accessible and affordable public transport service and safe infrastru- cture for non-motorized transport such as cycling and walking are lacking in most developing country cities. The number of private vehicles has been increasing continuously and dominates the roads. As a result, the transpor- tation sector is heavily responsible for public health issues in cities such as air pollution (acidification, smog), noise, greenhouse gas emissions, and road accidents. While transport enables the economy to grow, if not well-managed, it can also retard growth and the efficient delivery of essential social servi- ces. The lack of comprehensive planning of transport systems, without due consideration to social, economic, environmental and cultural.
The aim of the paper is measure the impact of transport indicators on the level urban sustainable transportation (pollution in the city).
Research question of the paper is how factors of urban transportation to influence on urban sustainable transportation trough environment aspect?
In the paper will be demonstrated theory and brief literature review, descriptive data analysis and quantitative analysis regression analysis.
THEORY AND BRIEF LITERATURE REVIEW Urban sustainable transportation has become one the most critical problems in several metropolitans over the world. The Council of Transport Ministers of the European Union adopted a more expansive definition of sustainable transport in April of 2001. This approach, an adaptation of an earlier propo- sal by the Centre for Sustainable Transport (CST) in Toronto, sees sustainable transport as a system that:
- Allows the basic access and development needs of individuals, companies and societies to be met safely and in a manner consistent with human and ecosystem health, and promises equity within and between successive generations; - Is affordable, operates fairly and efficiently, offers choice of transport mode, and supports a competitive economy, as well as balanced regional development; - Limits emissions and waste within the planet’s ability to absorb them, uses renewable resources at or below their rates of generation, and, uses non- renewable resources at or below the rates of development of renewable substitutes while minimizing the impact on land and the generation of noise” (Rahman A, van Grol R., 2005).
It is important to measure urban sustainable transportation. Chapter 40 of Agenda 21 states that ‘indicators of sustainable development need to be deve- loped to provide solid bases for decision-making at all levels and to contribute
to a self-regulatory sustainability of integrated environment and development systems’ (United Nations, 1992). Organization for Economic Co-operation and Development (OECD) defined sustainable transportation indicators as statistical measures that give an indication of the sustainability of social, envi- ronmental and economic development (Joumard and Gudmundsson, 2010). Sustainable indicators for urban transportation Campos et al. (2009) listed the main impacts that can be associated with urban transportation for the three dimensions of sustainability: (i) in the environmental aspect: air pol- lution, noise and natural resources consumption; (ii) in the social aspect: health, equality and justness of opportunities; (iii) in the economic aspect: urban economy, transports costs, competitiveness and subsidies.
Based on such impacts and on the list of possible STI that can be adapted to Urban Freight Transportation (UFT) Bandeira, D’Agosto, Ribeiro, Ban- deira, & Goes selected ten sustainable indicators that can be used to assess UFT alternatives and classified them according to the triple bottom line of sustainability (Bandeira, D’Agosto, Ribeiro, Bandeira, & Goes, 2018). They proposed three types of indicators:
1. UFT environmental performance indicators: UFT contributes to 40% of air pollution in European cities (Lindhome, 2010). The air pollutants of local impact, and thereby with greater impacts in urban areas, more com- mon in the transportation sector, are carbon monoxide (CO), nitrogen oxides (NOx) and particulate matter (PM). Vehicles that run on diesel predominantly contribute to the emission of NOx and PM, while cars and motorcycles, that run on gasoline or ethanol, are mainly responsi- ble for the emission of CO (D’Agosto and Ribeiro, 2009). Therefore, the indicator to measure such impact is ‘emission intensity of air pollutants (CO, NOx, and PM)’ (in g/t.km) (Bandeira et al., 2018). 2. UFT economic performance indicators: Although UFT constitutes a small proportion in the total freight transportation length, it invokes a high proportion of the transportation costs, accounting for 28% of total tran- sportation costs, mainly due to access restrictions (delivery windows and vehicle restrictions) (Shoemaker et al., 2006). Transportation costs are standardized per the momentum of transport (t.km) to be compared through the indicator ‘transportation cost per t.km’. The ‘load factor’ (occupancy rate) is also an economic indicator that reflects the efficiency of transportation operations and hence is associated to their competiti- veness. The ‘average operational speed’ (in km/h) is also considered an economic indicator that is related to traffic congestion, in which UFT plays a key role, decreasing operator productivity, besides causing major disturbance to urban population. 3. UFT social performance indicators: Accidents in UFT impacts traffic flow, both by the difficulties in removing the vehicle and the loads, incre- asing congestion. The indicator ‘fatality and injured of traffic accidents per vehicles’ is used to measure the system’s safety, and thus is related to the impact on health. This indicator is calculated through the ratio between the number of injured and the total of vehicles of the fleet in this operation (Bandeira et al., 2018).
208 Averkyna
It is necessary to point out that there is plenty of information about indica- tors for measuring sustainable urban transportation, but the environment for improvement ecological situation in cities is important to understand what factors influence.
DATA ANALYSIS AND MODELING According to our research, it is necessary to estimate how indicators of urban transportation influence on the rate emission level Nitrogen dioxide (NO2, Mg/m3). NO2 causes adverse effects on human health and causes the brown coloration of hazes and smog. Nitrogen dioxide is an important atmosph- eric trace gas, not only because of its health effects but also because (a) it absorbs visible solar radiation and contributes to impaired atmospheric visibility; (b) as an absorber of visible radiation it could have a potential direct role in global climate change if its concentrations were to become high enough; (c) it is, along with nitric oxide (NO), a chief regulator of the oxidizing capacity of the free troposphere by controlling the build-up and fate of radical species, including hydroxyl radicals; and (d) it plays a critical role in determining ozone (O3) concentrations in the troposphere because the photolysis of nitrogen dioxide is the only key initiator of the photoch- emical formation of ozone, whether in polluted or unpolluted atmospheres (World Health Organization (WHO), 2000). To measure the influence main factors of urban transportation on the level NO2 data presented by World Bank (see appendices Table A1). It is necessary to point out that the report of World Bank include 92 cities, but full data for our research contain only 41 cities.
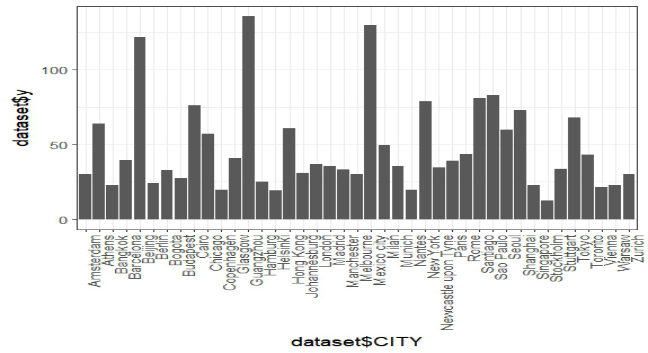
According to the data presented in Table 1, bar chart has been crea- ted which shows the rate of Nitrogen dioxide emission (Mg/m3) in 41 cities (Fig. 1).
The bar chart illustrates that the Nitrogen dioxide emission level in Guang- zhou, Mexico City and Beijing extremely higher, whereas it was the lower in Stockholm. The level of Nitrogen dioxide emission in other ranges 30 to 50 Mg/m3. Based on data of World Bank the it was make a decision that eight independent factors can be used for creation a model such as: X1 – Daily Ridership on Mass Transit; X2 – Total Registered Motor Vehicles; X3 – Average time of journey to work; X4 – Public Transport Energy Usage; X5 – Private Transport Energy Usage; X6 – 4-whls per 1k pop.; X7 – Buses per 1k pop.; X8 – Mass Transit Coverage; Y – Emission levels - Nitrogen dioxide (dependent value) has been chosen to run a regression analysis.
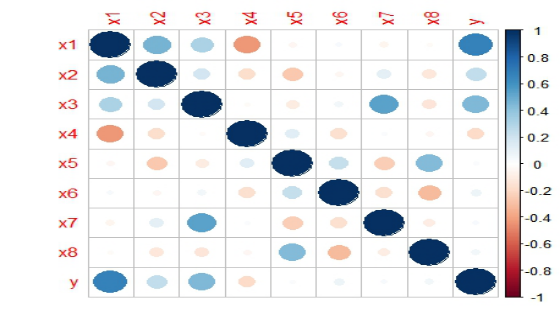
Then correlation analysis between independent and dependent values has been conducted and results are presented in the Figure 2. The data of Figure 2 demonstrates that there is correlation between Daily Ridership on Mass Transit factor and Total Registered Motor Vehicles factor is equal to 0.45, moreover there is correlation between Daily Ridership on Mass Transit and Public Transport Energy Usage factors is equal to -0.4, which is lower than 0.8. It is means that all factors can be used for regression analysis (formula 1).
Equation reproduced from the original PDF.
210 Averkyna
Figure 2: The correlation between independent and dependent values.
Then during the research made a decision exclude Total Registered Motor Vehicles factor, obtained new results (see Table 1) and received new regres- sion model: Yi = −7.95364 + 8.73861 ∗x1 + 0, 88782 ∗x3 + 8.74229 ∗x4
−1.69792 ∗x5 + 0.02675 ∗x6 −−3.70820 ∗x7 + 3.13019 ∗x8 + εi The model illustrates that increasing Daily Ridership on Mass Transit factor by 1 Miil increment the rate of Nitrogen dioxide emission level per 8.73861(Mg/m3), moreover raising Average time of journey to work factor by 1 minutes increment the rate of Nitrogen dioxide emission level per 0,88782 (Mg/m3), increasing Public Transport Energy Usage factor by 1 MJ/Passenger Km decrease the rate of Nitrogen dioxide emission level per 8.74229 (Mg/m3), increasing Transport Energy Usage factor by 1 MJ/Passen- ger decrease the rate of Nitrogen dioxide emission level per 1.69792 (Mg/m3), raising 4-whls per 1k pop. Factor by 1 unit increment the rate of Nitrogen dioxide emission level per 0.02675 (Mg/m3), increasing Buses per 1k pop. factor by 1 unit decrease the rate of Nitrogen dioxide emission level per 3.70820 (Mg/m3), raising Mass Transit Coverage by 1 unit increment the rate of Nitrogen dioxide emission level per 3.13019 (Mg/m3).
R2 means that model is adequate and total dispersion is explained on 54.8% factors. F-statistic (F value > P value) determines that relationship between model and the response variables is statistically significant. Accor- ding to the results t-value and p – value Daily Ridership on Mass Transit and Average time of journey to work factors strong influence on the rate of Nitrogen dioxide emission level. Other factors can be used with some reservation.
CONCLUSION
This study discovers that the relationship between urban transportation value and pollution problem is important and relevant, considering the location of the properties. The work described in this paper specifies the role of quality
of environment considering the urban transportation factors. The proposed models were estimated using data collected in the cities by World Bank and were compared to determine which of them presented the best fit end the vari- ables. The estimated models were useful in highlighting how different urban transportation factor to influence on the rate of Nitrogen dioxide emission level. In these models two the considered variables (Daily Ridership on Mass Transit and Average time of journey) had theoretically correct signs and were significant according to the t-test and P-value, other factors can be used with some reservation. The models had a good fit in both the value of R2, R2adj and F-statistic.
ACKNOWLEDGMENT
The author of the given work expresses profound to professor Peeter Lorents and professor Kaire Põder for the inspiration and support.
REFERENCES
Bandeira, R. A. M., D’Agosto, M. A., Ribeiro, S. K., Bandeira, A. P. F., & Goes, G.
V. (2018). A fuzzy multi-criteria model for evaluating sustainable urban frei- ght transportation operations. Journal of Cleaner Production, 184, 727–739. https://doi.org/10.1016/j.jclepro.2018.02.234 Campos, V., Ramos, R., Correia, D. (2009). Multi-criteria analysis procedure for sustainable mobility 802 evaluation in urban areas. Journal of Advanced Transportation, v. 43 (4), pp. 371–390 Goldman, T., & Gorham, R. (2006). Sustainable urban transport : Four innovative
directions, 28, 261–273. https://doi.org/10.1016/j.techsoc.2005.10.007 Pardo, C. F. (2010). Sustainable Urban Transport. Shanghai Manual: A Guide for Sustainable Urban Development in the 21st Century, 38. https://doi.org/10.3141/2243-05 Rahman A, van Grol R. (2005). SUMMA final publishable report v. 2.0; July 2005.
Available from: http://www.summa-eu. org/control/reports/SUMMA-D8.pdf. Tahzib, I. B., & Zvijáková, I. L. (2012). Environmental impact of land transport, 70–77. United Nations, (1992). Agenda 21: The United Nations Programmer of Action from
Rio. United Nations, New York. World commission on environment and development. Our common future. New York: Oxford University Press; 1987. World Health Organization (WHO). (2000). Chapter 7.1 Nitrogen dioxide. Air Quality Guidelines for Europe-Second Edition, 3(2), 175–180. Retrieved from http://www.euro.who.int/__data/assets/pdf_file/0017/123083/AQG2ndEd_ 7_1nitrogendioxide.pdf
212 Averkyna
(Mg/m3)
Nitrogen dioxide
Coverage Emission levels -
pop. Mass Transit
4-whls per 1k pop. Buses per 1k Energy Usage Private Transport (MJ/Passenger Km)
Human Factors in Architecture, Sustainable Urban Planning and Infrastructure
Read this individual research paper free through the original publisher, or explore the full digital proceedings book.
ISBN 978-1-958651-34-6
Explore this ISBN in the AHFE Bookstore ↗Listed in the July 2026 bookstore catalogue; search by ISBN to confirm current availability · Digital book purchase optional