Felix-marcel Petermann, Ole Andreas Alsos, Eleftherios Papachristou (2023). Interaction between humans and autonomous systems: Human facing explanatory interface for an urban autonomous passenger ferry. In: Intelligent Human Systems Integration (IHSI 2023): Integrating People and Intelligent Systems. AHFE Open Access, vol. 69, pp. 56–65. https://doi.org/10.54941/ahfe1002821
Problem statement During a public trial, over 150 passengers were interviewed about their thoughts and experiences using an autonomous ferry, among over 1500 passengers taking a trip on the world's first autonomous urban passenger ferry in Trondheim. One of the main issues expressed by passengers was a lack of information about the state of the unmanned ferry service. A safety attendant was aboard for the three-week public testing to take over control in the unlikely case of a hazardous event. Observations of passengers revealed a desire for information regarding the functionality of the ferry, the current state of the boat, and the progress of the current journey. Passengers interviewed stated that, especially if no safety personnel are on board, the demand for information is higher because no one can be queried. The absence of information increased the sense of insecurity. Since the space aboard the autonomous passenger ferry is limited, the used option cannot be too spacious; nonetheless, the information must be easily available to users. Research Question What information do passengers require on a self-driving urban passenger ferry? Does the type of information displayed affect passengers' perceptions of safety? Method Two 10-inch high-luminance (1000 nits) screens have been installed on the mast of the autonomous passenger ferry, allowing the user to see information on both sides when embarking, disembarking, and traveling. Two distinct information screen concepts have been visualized for use in a semi-structured interview. First, the passengers were asked what they could see on each of the concepts and what information they thought would be most useful. They should also explain how the information they view influences their sense of safety and trust. In an AB-test, passengers were asked to select a preferred concept for the information screen and describe why they chose that concept in detail. One of the concepts (A) was straightforward and depicted the journey's progress as a linear bar. Furthermore, the traveler could observe the ferry's status with a large illustration, along with the status in one word and a brief description. The second concept (B) should attract those passengers who are interested in details and technical elements. Concept B contained an environment map with the ferry's intended path and present position and heading, details for each single thruster, the speed in kn, system health status, battery levels, compass, object detection, and the ferry's current operation status. All used and previously stated characteristics on both presented screens have been used in a semi-open card sort to determine which information is most valuable to the passengers. The passengers were instructed to prioritize the offered information and fill in blank cards with missing information. Each of the placed cards was awarded points based on their location in the assortation; the further left the things were placed, the more points were awarded; the further right, the fewer points were awarded. Results 15 of the 1500 passengers who participated in the public trial of the urban autonomous passenger ferry were specifically asked about their preference for data visualization and the demand for information on such a ferry. The majority of the passengers (n = 12) indicated that they would prefer the simpler version of the information concept (A), whereas the remainder of the interviewed passengers would prefer the more technical interface because they are more concerned with the ferry's functionality and the reliability of the components. All of the users stated that they would feel less safe if there was no safety attendant or information screens on board. The cart sort analysis reveals that the more technical components have been ranked as less relevant, with the ferry's state, system health, and continuous travel progress being more important than detected objects, thruster details, LiDAR, and radar visualization. Conclusion Both the interview data and the card sort revealed that passengers on autonomous passenger ferries have a higher demand for straightforward and immediately available information. If they cannot obtain it from a human safety attendant on board, they require additional information that is not overly technical in order to maintain a high degree of safety perception.
In the 2030 technology outlook, an international marine shipping registra- tion and classification society (DNV GL, 2020) points out the impact and importance of transformative technology in the future. They underline the high-grade transformational potential of autonomous systems in the fields of logistics and transportation. We can also witness an increase in the number of autonomous systems that are being deployed at various degrees of auto- nomy. Even if we generally lessen human liability and supervision in these autonomous systems, humans have a strong desire to stay in the loop and receive continuous information Veitch et al., 2022). The need of information can vary strongly depending on their affiliation and interest. Persons that
Interaction Between Humans and Autonomous Systems 57
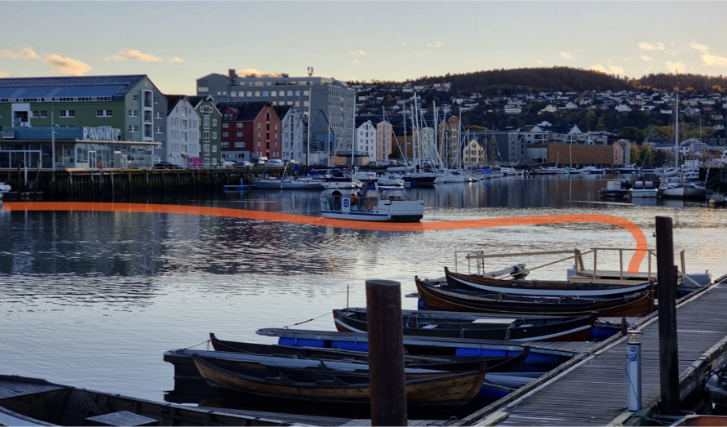
Figure 1: milliAmpere2 during a journey on the intended route.
work with, supervise, or monitor autonomous systems, such as, autonomous ships or buses, may have a different interest in obtaining information than people who only use autonomous systems as a service. This growing demand for information visualization and processing necessitates more research to better inform the design of informational interfaces for autonomous systems. (Krupenia et al., 2014) This study uses a mixed methodology approach that includes a semi-structured interview and a card sort with information items after the passengers have travelled with an autonomous passenger ferry. The study investigates the information needs of urban autonomous passenger fer- ries. During a three-week public trial operation of milliAmpere2 (mA2) - which is as far as we know the world’s first autonomous urban passenger ferry put in operation - around 1500 citizens took the 100-meter crossing of a canal in the Norwegian city of Trondheim (Figure 1). A subset of those, 150 passengers, were interviewed about their impressions of safety onboard and their trust in the autonomous ferry. A safety attendant was aboard the mA2 ferry during the three-week public testing to take over control in the unlikely case of an emergency circumstance or misbehaviour of the autono- mous system. Observations of the passenger and their interactions with the safety host revealed a significant need for information and enquiries about the ferry’s functionality, its current state, and progress of the trip. Many of the 150 passengers that were interviewed during the first week of the trial stated that they would expect more information from the autonomous ferry if no safety personnel were present. A lack of information leads to a greater sense of vulnerability.
Related Work
Even though the informational interface must be easily accessible to pas- sengers, it could not be too large since there is limited space onboard
the autonomous ferry. We did not find previous research on passenger information (PI) and real-time passenger information (RTPI) interfaces in the context of autonomous passenger ferries. Therefore, we investigated research from other, more traditional public transportation services such as railw- ays, air traffic, buses, and ferries. Relevant research in the context of these services is mainly focused on travel planning and transitioning between vari- ous types of public transportation (Anderson 1993; Fonzone 2015; Zografos et al., 2009; McLay et al., 2001). The information gap in traditional forms of transportation is mostly due to a lack of real-time data, incomprehensi- ble timetables, current vehicle positions, and route progress (Beul-Leusmann et al. 2014). Some informational interfaces can be encountered in in-flight passenger information, which focuses on the aircraft’s approximate position on a map, current speed, altitude, and remaining trip time (Lufthansa 2022; United Airlines 2022).
Also, research on informational systems in autonomous cars is partly rele- vant, even though they are usually intended for smaller user groups and have greater customising possibilities compared to those intended for public transportation vehicles. Waymo (2022) provide good inspiration with their information screens, where they show the position of the vehicle on the street, detected pedestrians and other vehicles, as well as the remaining time and destination. But they allow the user to select which information should be displayed. However, we primarily focused our research on autonomous veh- icles for public transportation, such as autonomous bus shuttles, because of greater similarities to the context of autonomous ferries. This body of rese- arch provides a better foundation for examining the information needs of passengers of urban autonomous passenger ferries.
Linnartz et al. (2021) investigated the information requirements of passen- gers in self-driving bus shuttles. This research reports the results of two focus groups. The study’s key finding was that there is a demand for information that is comparable to that shown in regular buses. Passengers would only want technical information if it was explained in detail and provide valuable information. In addition, an accident statistic was provided to demonstrate the safety of self-driving cars. Both reference groups wanted information scre- ens that displayed the current route and position, planned stops, current speed, time, date, and transfer choices to other means of transportation. Auditory cues were only considered useful in rare circumstances, such as service outages or before the vehicle began moving (Linnartz et al., 2021). Another study in the same area identified the necessity for information about the traffic situation, route, and vehicle position, as well as possible connecti- ons. The results of a survey revealed that participants would prefer human operators to be present in the vehicles (Linnartz et al., 2021). Currently, most autonomous vehicles operate at relatively low speeds. However, there may be different informational needs if, in the future autonomous vehicles would operate at higher speeds (Riener et al. 2020). Even though there are some valuable insights in most of the aforementioned studies that can help inform the design of informational interfaces in general, we specifically aim to explore the information needs of passengers of urban autonomous ferries.
Interaction Between Humans and Autonomous Systems 59
In the next section, we provide a presentation of the methodologies we used in our attempt to answer the following questions:
What information do passengers require on autonomous urban passenger ferries?
Does the type of information affect passengers’ perceptions of their own safety?
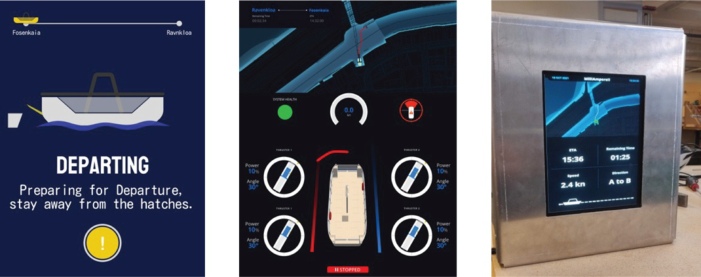
THE INFORMATION SCREENS To answer these research questions, we conducted a study during the trail of the urban autonomous passenger ferry milliAmpere 2 (mA2). Details about the technologies used in this ferry are presented in Alsos et al. (2022). Two 10- inch touch screens with high luminance (1000 nits) were mounted on the mast of the mA2, allowing the user to see relevant information on both sides of the ferry, while embarking, disembarking, and travelling. Two distinct informa- tion interfaces were designed (Figures 3a and 3b) and displayed on the screens (Figure 3c). One of the designs (Figure 3a) was straightforward and depicted the journey’s progress as a linear bar. Furthermore, the passenger could obse- rve the ferry’s status on a graphic combined with information about the ferry status in one word and a brief description. The second proposal (Figure 3b) was aimed at passengers who could be more interested in the specifics and technical aspects of the ferry. Concept B had an environment map that inclu- ded the ferry’s intended path, current position and heading, details for every single thruster, speed in knots, system health, battery level, a compass, object detection, and the ferry’s status of operation.
PARTICIPANTS Out of the 150 passengers who took the ferry over a span of two days, we randomly recruited 15 to participate in our study. Those participants volun- tarily came to the ferry to try out the vehicle, mainly due to curiosity. The passengers (7 female, 8 male), aged between 21 to 53 years (M = 32.87, SD = 10.15) who took part in the public trial of the urban autonomous pas- senger ferry were asked in detail about their preference for data visualization and what information they would want on an autonomous ferry like this.
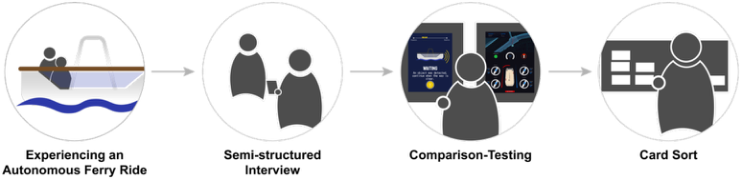
DATA GATHERING AND ANALYSIS The research procedure we followed (Figure 2) included (1) a ferry trip with milliAmpere 2, (2) a post-trip semi-structured interview, (3) a comparison test of the screen concepts, and (4) a card sort exercise.
The study took place after the conclusion of the ferry trip with the mA2, which lasted approximately 3 minutes. First, we asked them about their overall experience during the trip, emphasising on what information they recalled seeing on the screens. The passengers were specifically asked to describe what information they observed on each screen, how they interpre- ted it, and what was most relevant to them. We also asked them to describe what other information they perceived from their surroundings including
Figure 2: Workflow of applied methodology.Figure 3: (a) Design A simple information display; (b) Design B technical information; (c) prototype of the passenger information screen.
observations of the safety host. They were also asked to describe how the information they gathered influenced their sense of safety and trust in the autonomous ferry. We also investigated how passenger safety perceptions were modified by information availability. Some passengers did not seek out any information at all, while some referred to the information screens or the safety host on board. We explored how safety perceptions were affected by these information-seeking approaches. In addition to the safety-related que- stions, the interviewees were asked to explain how this would affect their trust in the autonomous system. The participants were asked to rate their perceptions on a 5-point Likert scale that ranged from 1 (very unsafe or very untrustworthy) to 5 (very safe or very trustworthy). The interviews were first transcribed and analysed using an affinity diagram. The transcripts were coded and then clustered into categories, which were consolidated into higher divisions. In a comparative test, passengers were asked to select their prefer- red design for the previously described information screen and describe in detail the reasons for their choice.
All previously presented information elements from both screens were written on cards to be used in a semi-open card sort to determine which information is most valuable to the passengers. The passengers were asked to prioritize the presented information on a 10-point Likert scale (10 = very important to 1 = very unimportant) and fill in the blank cards with missing information. Each card was assigned points based on its position on the Likert scale. Items that were placed to the left received a higher number of points compared to those placed to the right. With the outcomes of the cart sort
Interaction Between Humans and Autonomous Systems 61
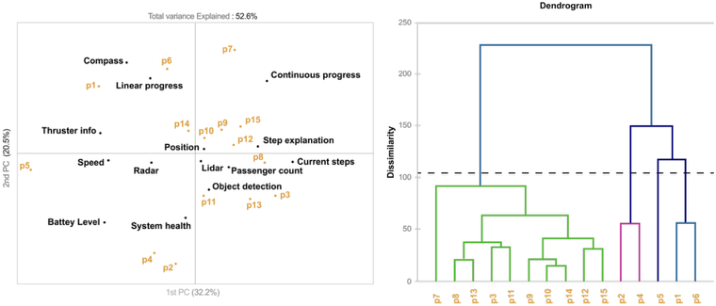
and additional answers from the interviews, we conducted a cluster analysis and principal component analysis (PCA), to see similarities in the preferences of the users, which are displayed in a reference mapping and dendrogram (Figure 4).
Results
The majority of the interviewed passengers (N = 13) stated that they would prefer the simpler version of the information screen using design A, whereas the remaining passengers (N = 2) would prefer the more technical inter- face because they are more interested with the functionality of the ferry and the reliability of the components. After transcribing, coding, and sorting the key statements of the interviews, 28 higher-level categories were disco- vered, which could be classified as journey-related information, technical information, safety, and information overload.
The descriptive analysis of the card sorting exercise (Table 1) shows which things are considered essential by the participants and which are not. The most common items requested by interviewed passengers were journey- related information, such as the current state of the journey, such as whether the ferry is halted, docked, or if an object was detected (M = 9, SD = 1.25), the planned path of the autonomous passenger ferry, including the current position on the path (M = 8.8, SD = 1.26), and continuous journey pro- gress (M = 8.47, SD = 2.61). The elements detailing the visualization of the present status of the autonomous ferry (M = 7.53, SD = 2.61) and the expla- nation of the current condition (M = 6, SD = 1.17) are also relevant but of lower priority. When asked about journey-related information, the intervie- wed passengers stated that the location on the map and the planned course are very important. It was critical for the passengers to monitor the jour- ney’s progress, direction, what course the autonomous system had planned, and whether it was following the initial intended route. “It’s important to see where you are and also recognize if the ferry is on the right track.” (P2). Seven more of our participants emphasized the significance of this informa- tion. Similarly, the linear progress utilized in Design A shows the progress of the voyage, but it does not provide as much helpful information as the map with additional remaining time: “It is more like a loading bar, but it can’t really make a connection without the map and an estimate of time.” (P1).
Some passengers suggested that the traffic around the ferry should be shown on the map as extra information, so they can see why the ferry stop- ped or changed route. It was also mentioned that the screen should reveal information about unexpected objects that were detected on the path. The visualisations of the current steps showed the current process and stage- related information. For example, when preparing for departure, hatches of the ferry were shown in different colours and moving, so users directly knew they should stay away from the hatches and prepare for the imminent start of the journey. According to the passengers, it is also understandable for infants or individuals who cannot read, and it allows for the extraction of vital information from a greater distance, eliminating the need to be in close proximity to the information screen. Some passengers suggested that
Figure 4: Principal Component Analysis (left) - Cluster Analysis Dendrogram (right) representing the main clusters of participants based on their card sorts.
an additional explanation could be added, for example: “It is safe for me to board the ferry” (P3).
“Technical information” was the second, largest, higher-level category. In general, the descriptive analysis (Table 1) indicates that this type of informa- tion was considered less important by the majority of our participants. Less important information includes LiDAR views (M = 1.93, SD = 0.8), radar views (M = 2.60, SD = 1.72), thruster information (M = 2.6; SD = 2.59), and a compass (M = 4.8, SD = 2.76). When the insights from the intervi- ews are considered, it becomes clear that the majority of participants did not understand this type of information or that they did not think it would add significant value. “Thruster, battery level, radar, etc., are too technical for me and have no added value for me”, “I don’t like too much technical informa- tion; when I don’t understand them, then it makes me feel rather unsafe”(P7). A closer look at the cluster analysis also reveals that the major group includes passengers who had a negative predisposition towards technical information. This also corresponds with the dendrogram, where you can see this group on the left (Figure 4) These passengers represent the general population, with diverse interests, backgrounds, and ages.
Nonetheless, even though technical information was considered as less relevant, it is clear that some passengers were interested in this additional information. The autonomous ferry’s travel speed (M = 6.07; SD = 2.31) is among the most interesting pieces of technical information for passengers. It would probably have received a higher preference score if the data were displayed in km/h. Even though km/h is less common in the maritime envi- ronment, it is nonetheless more comprehensible for the average passenger than speed in knots. According to the interviews, those who found the tech- nical information fascinating had a technical background or were engineers. “I enjoy the technical screen, it’s a little nerdy!” (P1). This group is clustered on the right side of the dendrogram. However, the additional information is of high interest for the technically savvy group they don’t really need it or see a purpose for the general passenger; “the technical knowledge doesn’t really matter if I feel comfortable or would board the ferry or not,” says one (P6).
Interaction Between Humans and Autonomous Systems 63
Table 1. Descriptive analysis of 15 items investigated by each study participant in the cart sort.
Table available in the original PDF paper.
Item N Min Max Mean Std. Dev Current State (halted, docking, object detected, journey) 15 6 10 9.00 1 Map with Planned Path and Current Position 15 6 10 8.80 1 Continuous Journey Progress 15 2 10 8.47 2 Visualisation of Current State 15 3 10 7.53 2 System Health 15 1 10 7.40 2 Speed in Knots 15 2 10 6.07 2 Explanation of Current State 15 3 9 6.00 1 Linear Progress of Journey 15 1 10 5.53 2 Battery Levels 15 1 10 5.40 3 Passenger Count 15 2 9 5.27 2 Object Detection 15 1 9 5.20 2 Compass 15 1 10 4.80 3 Thruster Information 15 1 10 2.60 3 Radar View 15 1 8 2.60 2 LiDAR View 15 1 3 1.93 1
The perception of importance of some items would change in the case of anomalies, e.g., in an emergency, which are clustered in the higher-level cate- gory of “safety.” The system health is something that the passengers find interesting (M = 7.4, SD = 2.35). It was stated that it acts as a trust factor when the passenger sees that the system’s health is okay. In the prototype, it was presented as a green status light with no further explanation. Eleven of the passengers we interviewed commented on the significance of the system’s health. They wanted to know how the autonomous system was performing in general and if the behaviour or reliability of the system was changing. Some passengers were interested in receiving more details about system health. They did not think it was required to present more information when the status changed. Here, other facts like battery level and engine state could be useful to explain to passengers what’s the root causes of a prospective service interruption. When the autonomous ferry simply stops because an obstruction is detected, the system’s health and the graphic showing the cur- rent status of the procedure are adequate to retain the users’ trust and safety perceptions. The most important thing in terms of system health is to inform passengers in an easy and understandable manner. As shown in Linnartz’s (2021) it is important to display problems positively, for example, “during the docking process, we are pursuing a lower speed to keep you safe.”. Some passengers stated that they do not care if this type of information is provided, “I just want to know if there is an emergency and if a human operator was notified about the problem, which is good demonstrated in design A.” (P1).
The last category that was revealed by the affinity map was “information overload”. No specific question was asked on the amount of information shown, although a considerable number of participants s (N = 8) stated that they “don’t require much information” (P1, P8, P14). Design B, in particu- lar, has an excessive amount of information. Users like “well-structured and visually appealing content” (P13). They also stated that “the second version
(design B) contains too much information “I like that it is visually appealing but simpler”(P15). The consensus was that they didn’t need that information because it could have a detrimental effect on their trust levels. Some even sta- ted: “I’m not dependent on information”, or “I would enjoy the trip more, and I have a horse sense, so I know when something isn’t right” (P14).
On the subject of how the perception of safety and trust differed between no information, information provided by a human safety operator, and the information screen, the interviewed passengers’ responses were largely consi- stent. 53% of passengers genuinely thought that an unmanned ferry would be less trustworthy, while 33% believe it is neither untrustworthy nor trustwor- thy. A similar finding may be seen in the question about safety perception in the absence of any kind of information. Out of all participants, 40% believe it was somewhat unsafe, while 46% believe it was neither safe nor unsafe. If information is presented by a PI or by a safety operator, none of the passen- gers felt unsafe or had a low level of trust in the system. Passengers indicated that receiving the information from the aforementioned sources made them perceive their experience with the autonomous ferry as safe and trustwor- thy. There was only a minor difference between receiving from the human safety host or the information screen. Some passengers trust the informa- tion screens more. Based on the interviews, some passengers stated that they would rather trust the information screens because a human cannot know everything, and each safety host interprets some data differently.
CONCLUSION
Our study reports similar results to those in the studies of Linnartz (2022) and Riener (2020), indicating that the current location, intended path, estimated time of a trip, and connection possibilities to other means of transportation are most important for passengers of autonomous buses, shuttles, and pas- senger ferries. Less important are technical and specific vehicle information such as system status, battery life, or fuel level. Some of these information requirements may vary in the event of an anomaly, such as an engine bre- akdown or lowered speed to avoid collisions or other harmful situations. Some people may be more interested in technical information because of their background and interests, but even they believe that it may be redundant to show this information to the broader public. It has also been demonstra- ted that providing passengers with less information results in greater trust than providing them with all available information. In general, our partici- pants preferred information interfaces that were cleaner and only show key information. Furthermore, they preferred, visualized data, and continuous progress in the form of a real-time map with the vehicle’s position and an easy-to-understand graphics representing the vehicle’s state.
ACKNOWLEDGMENT
We thank the team of researchers at the NTNU Shore Control Lab (SCL) to support this study. The study was funded by the Norwegian Research Council through SFI AutoShip (grant number 309230) and MIDAS (331921).
Interaction Between Humans and Autonomous Systems 65
REFERENCES
Alsos, O. A., Veitch, E., Pantelatos, L., Vasstein, K., Eide, E., Petermann, F. M., & Breivik, M. (2022, July). NTNU Shore Control Lab: Designing shore control centres in the age of autonomous ships. In Journal of Physics: Conference Series (Vol. 2311, No. 1, p. 012030). IOP Publishing. Anderson, T. N. D. (1993). Real-time passenger information for transit systems:
proposals for the Jubilee Line Extension. In PUBLIC TRANSPORT PLAN- NING AND OPERATIONS. PROCEEDINGS OF SEMINAR H HELD AT THE EUROPEAN TRANSPORT, HIGHWAYS AND PLANNING 21ST SUMMER ANNUAL MEETING (SEPTEMBER 13-17, 1993), UMIST. VOLUME P370. DNV GL (2020, January). Technology Outlook 2030 available at (https://www.dnv.
com/to2030/) Fonzone, A. (2015). What Do you Do with Your App?: Study of Bus Rider Decision Making with Real-Time Passenger Information. Transportation Research Record, 2535(1), 15–24. https://doi.org/10.3141/2535-02 Krupenia, S., Selmarker, A., Fagerlönn, J., Delsing, K., Jansson, A., Sand-
blad, B., & Grane, C. (2014). The ‘Methods for Designing Future Autono- mous Systems’(MODAS) project: Developing the cab for a highly autonomous truck. Advances in human aspects of transportation: Part II, 8, 70. Linnartz, M., Dufner, Y., & Fricke, N. (2021, December). Information Presentation in Autonomous Shuttle Busses:–What and How?. In International Conference on ArtsIT, Interactivity and Game Creation (pp. 413–423). Springer, Cham. Lufthansa. (2022). Lufthansa A350-900: Take off on a new digital travel experie-
nce https://www.lufthansagroup.com/en/newsroom/releases/lufthansa-a350-900- take-off-on-a-new-digital-travel-experience.html Retrieved: 20.11.2022. McLay, G. D., & Lyons, G. (2001). From laughing stock into rolling stock: Can rail passenger information help make a difference?. Riener, A., Appel, A., Dorner, W., Huber, T., Kolb, J. C., & Wagner, H. (2020).
Autonome Shuttlebusse im ÖPNV: Analysen und Bewertungen zum Fallbeispiel Bad Birnbach aus technischer, gesellschaftlicher und planerischer Sicht (p. 206). Springer Nature. United Airlines. (2022). Inflight Entertainment. https://www.united.com/ual/en/de/f ly/travel/inflight/entertainment.html Retrieved: 20.11.2022 Veitch, E., & Alsos, O. A. (2022). A systematic review of human-AI interaction in
https://www.youtube.com/watch?v=B8R148hFxPw Retrieved: 18.11.2022. Zografos, K. G., Androutsopoulos, K. N., & Spitadakis, V. (2009). Design and assessment of an online passenger information system for integrated multimodal trip planning. IEEE Transactions on Intelligent Transportation Systems, 10(2), 311–323.
LISTED IN THE AHFE DIGITAL BOOKSTORE CATALOGUE
Explore the complete digital volume
Intelligent Human Systems Integration (IHSI 2023): Integrating People and Intelligent Systems
Read this individual research paper free through the original publisher, or explore the full digital proceedings book.
ISBN 978-1-958651-45-2
Explore this ISBN in the AHFE Bookstore ↗Listed in the July 2026 bookstore catalogue; search by ISBN to confirm current availability · Digital book purchase optional