Antonia Markus, Esther Borowski, Ingrid Isenhardt (2026). Communicating Uncertainty in AI-Based Decision Support Systems: A Comparative Study of Numerical and Visual Representations. In: Human Factors and Systems Interaction. AHFE Open Access, vol. 230, pp. 145–153. https://doi.org/10.54941/ahfe1007986
AI-based Decision Support Systems (AI-DSS) are increasingly recognized for their significance in professional environments. A key challenge in human-AI interactions is effectively communicating the uncertainty inherent in AI recommendations, as this can influence performance outcomes. Various methods exist for representing uncertainty, primarily through numerical data or visual cues. While users often favor numerical probabilities for their perceived precision, these figures can be difficult to interpret. Conversely, visual representations may enhance understanding but tend to be less accepted by users. The existing literature lacks clear conclusions regarding the impact of these communication designs on user performance and cognitive load. This research examines the effects of two forms of uncertainty communication—numerical (decimal numbers) and visual (traffic light system)—on user performance and cognitive load. An online experimental study was conducted with 104 participants assigned randomly to either condition within an AI-supported customer service context. Participants responded to support request emails using AI-ranked response modules while retaining decision-making authority. Each participant engaged with ten vignettes and completed questionnaires measuring task load afterward; performance was assessed based on correctly answered vignettes. Results indicated no significant differences in task load between groups. However, notable variations in performance emerged when systems made errors, influenced by the communication design used. These findings suggest that effective uncertainty communication strategies may vary based on context and audience, offering valuable insights for designing AI-DSS.
AI-based decision support systems (AI-DSS) enhance decision-making by integrating human expertise with data-driven recommendations. The importance of these systems has grown, as joint human-AI decisions often outperform individual human judgment in various scenarios (Vaccaro et al., 2024). In workplace settings, joint human-AI performance is a critical metric for evaluating the benefits of AI-DSS, leading to its implementation across diverse applications, for example, in healthcare, the finance sector,
or manufacturing. Additionally, employees supported by AI-DSS frequently report reduced mental load (Kong et al., 2023). However, achieving these positive outcomes hinges on users developing appropriate reliance on the system’s recommendations, neither overtrusting nor undertrusting them (Zhang et al., 2020). Overtrust occurs when users blindly follow system suggestions without critical evaluation, while undertrust results in insufficient utilization of the system’s capabilities. Uncertainty communication emerges as a potential solution to foster appropriate reliance by presenting probabilities alongside recommendations to indicate their reliability. Despite its promise, current research provides mixed results regarding its effectiveness (Rechkemmer & Yin, 2022; Zhang et al., 2020). Furthermore, key contexts remain underexplored, including work environments and decision tasks with multiple response options (Lai et al., 2023).
This study aims to examine how uncertainty communication within an AI-DSS affects performance and task load in a work-related decision-making scenario. We designed our investigation around a technical customer support task with multiple response options to address existing research gaps.
RELATED WORK
Uncertainty communication in the context of AI-based decision support systems displays the additional information about the systems’ uncertainty along with the recommendations made as decision support. The goal of uncertainty communication is to raise awareness of the possibility that most systems are not accurate in every case. It should warn the user in cases where the system recommends incorrect options. On the one hand, this can prevent blindly following the system’s recommendations, which is also described as overtrust. On the other hand, it could also affect the tendency for people mistrust the system when they notice that the system made a mistake. This phenomenon is called algorithm aversion.
After the discovery that users had to slow down to process uncertainty communication (Prabhudesai et al., 2023), It was used as a strategy, named cognitive forcing, to slow the users down and to motivate them to consider analytically every recommendation (Buçinca et al., 2021). Although this strategy reduces overreliance on the participants, they needed more cognitive capacity and did not rate their interaction as pleasant (Buçinca et al., 2021; Liu et al., 2021).
Prior research has yielded mixed results regarding the presentation of model uncertainty information and its impact on user reliance on AI suggestions. Some studies found that displaying high uncertainty in model input features can lead to a significant decrease in user confidence and trust in the system (Lim & Dey, 2011). Conversely, other research indicated that presenting model confidence as a percentage had limited effects on user reliance when accompanied by the model’s stated accuracy based on held-out data (Rechkemmer & Yin, 2022). In general, uncertainty communication might affect the performance as well as the task load of the users.
Communicating Uncertainty in AI-Based Decision Support Systems 147 One could conclude that the type of uncertainty communication might be the decisive factor for the mixed results. In numerical uncertainty communication, probabilities are often communicated as percentages, or decimal numbers are used. The challenge with effectively utilizing probabilities lies in users’ ability to interpret these values, a phenomenon known as statistical illiteracy. This issue has been acknowledged since the 2000s, with recommendations suggesting the use of frequencies instead of relative probability scores (Gigerenzer et al., 2007). However, evidence supporting the superiority of frequency-based communication over relative probability scores remains inconclusive (Cao et al., 2024). Furthermore, while some studies advocate for calibrated scores, these too have not consistently outperformed standard relative probability scores (Cao et al., 2024). Also, people want to receive uncertainty information (Gaertig & Simmons, 2018) but find it hard to interpret it (Bussone et al., 2015). Most existing research has focused on binary decisions; however, it raises an important question: how do users interpret probability scores when there are multiple response options? Is it easier to understand probabilities in relation to one another?
Another potential avenue for improving understanding may lie in visual representations of uncertainty. Visuals could mitigate the difficulties associated with interpreting statistical data by leveraging graphical education through imagery. Nonetheless, previous studies have faced criticism for using overly complex graphics, such as violin plots or error bars (Fernandes et al., 2018; Zhao et al., 2024). This leads us to consider what possibilities exist for representing uncertainty when multiple response choices are involved. Can visuals or icons effectively replace traditional numerical representations?
Regarding the variables of performance and task load, we hypothesize: H1: The performance of people working with an AI-based decision
support system who receive visual uncertainty communication differs from the performance of those who receive numerical communication. H2: The task load of people working with an AI-based decision support system who receive visual uncertainty communication differs from the task load of those who receive numerical communication.
METHODS
Sample A total of 104 participants was recruited with a digital flyer that was posted on social media, as well as a university internal system recruiting psychology students who received test subject hours as compensation. Among the participants, n = 72 (69%) identified as female and n = 31 (30%) identified as male, while n = 1 (1%) did not disclose their gender. The average age of participants was 32 years, with ages ranging from 18 to 68. Approximately half of the sample were university students (n = 55, 53%), with a high proportion of psychology students (n = 40, 39%). The other half was employed.
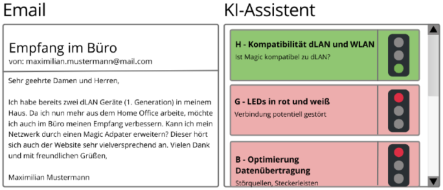
Design The between-subjects design compares two groups regarding the two dependent variables, performance and task load. One group received visual uncertainty communication as a traffic light symbol during their task, while the other group received numerical uncertainty communication as a decimal number (Fig. 1). The participants were randomly assigned to the groups.
Stimuli The study was conducted as an online vignette study via Sosci Survey in two survey periods: 15.06.25 until 02.07.25 and 29.10.25 until 17.11.25. The vignette was used to represent a fictional customer service portal, which provided both customer emails and pre-written response templates for frequently asked questions. Participants were asked to put themselves in the shoes of a customer service representative at a company that sells Wi-Fi adapters. The participants’ task was to match the correct pre- written response template to different e-mail enquiries. The AI support, which was facilitated by a displayed picture of the AI output, was realized by ranking the eight possible response templates according to their likelihood to match the current e-mail. The participants were told that the AI had an accuracy of 80% on the first-ranked response. Consequently, the recommendation of two of the ten AI-supported items was incorrect. The correct answer was not ranked in first place but in second place. As the uncertainty communication should warn the participants in which cases the AI system is not accurate, the first option had a yellow traffic light, and in the numerical variant, the decimal was below 0.80, as displayed in the upper example of Figure 1.
Figure 1: AI output used a stimulus within the experiment. Two e-mail items display the different variants of uncertainty communication. Left the coloured traffic light symbols and on the right side the numerical uncertainty communication.
Communicating Uncertainty in AI-Based Decision Support Systems 149 Operationalization The key dependent variables are performance and task load. Performance is measured as the matching of the correct response option to the emails. Task load is operationalized with the NASA Task Load Index (Hart & Staveland, 1988). The participant rated their task load with items assessing, for example, the mental load or the effort on a scale from 0 to 100.
Procedure The study began with participants reading information about data protection and consenting to participating in the study. They read information about the product relevant to the emails they were tasked with addressing. This information included a product description, potential malfunctions, and corresponding response texts. To familiarize participants with the email system, a practice phase consisting of two emails was integrated. Subsequently, a control block was implemented at the beginning of the test to assess how well participants understood the functionality of the described product. This control block consisted of four emails that participants had to respond to without AI support. The following AI-supported interaction phase comprised two blocks containing five emails each. After participating in this AI-supported interaction phase, participants filled out questionnaires regarding task load. On average, participants required 40 minutes to complete a full trial run.
RESULTS
The statistical analytics were performed with IBM SPSS version 29.0.2.0. Table 1 displays descriptive statistics comparing the visual and numerical uncertainty communication groups. While the performance of the items is displayed by frequency of correct answers per item, the score for task load operationalized by NASA TLX questionnaire is shown as means with standard deviations.
Table 1: Descriptive statistics displaying the performance.
Table available in the original PDF paper.
Performance in the Frequency of Correct Answers Group n
Task load (NASA TLX score 0-100) I II III IV V VI VII VIII IX X Mean s
χ² = Pearson-Chi-Quadrat; a expected cell frequencies below 5; * p-value < 0,05; abbreviations: n = sample size; s = standard deviation.
Comparing the groups regarding their performance, chi-square tests were used; for items where the expected cell frequencies were below 5, the exact test according to Fisher (Mehta & Patel, 1983) was used. In Item X,
the groups could not be compared because in both groups, all participants answered this item correctly. No significant differences were found for Items I, II, III, V, VII, and VIII. Whereas Item IV χ²(1) = 6,38, p = .012, φ = 0.248, Item VI χ²(1) = 4,25, p = .039, φ = 0.202, and Item IX χ²(1) = 7,21, p = .007, φ = –0.263 show a significant difference between the visual and the numerical uncertainty communication. Descriptively, in items IV and VI, the numerical uncertainty led to higher frequencies of correct answers (IV: visual: 41/51; numerical: 51/53; VI: visual: 43/51; numerical: 51/53). In item IX, the visual group had a higher frequency of correct answers (visual: 45; numerical: 35).
The task load between the groups was compared with a t-test. No significant mean difference was found between the visual (mean = 31,93) and the numerical (mean = 27,33) uncertainty communication style t(102) = 1,838, p > .05.
DISCUSSION
This study examined the effect of different variants of uncertainty communication on the performance and the task load of users of an AI-based Decision support system. We compared a visual uncertainty communication as a coloured traffic light symbol, with numerical uncertainty communication displayed as decimal numbers.
Hypothesis 1, stating a difference in performance between the variant of uncertainty communication, was supported by the data in cases where the system did not recommend the correct solution in the first place. Those items were item IV and item IX. Surprisingly, the descriptive values of the frequency of correct answers suggest that the effects of the items point in different directions. While in item VI the numerical group performed better compared to the visual group, it is opposite at item IX, where the visual group performed better than the numerical group. This could be attributed to the fact that the items were different in their design. In item VI, the first- ranked response by the AI-system had a numerical score of 0.50, and the second-ranked response had a score of 0.24. In the visual condition, the first response had a yellow traffic light, and the second had a red traffic light due to the low score. This differentiation could have misled the visual group. In the scenario of the other item, both first responses had a yellow traffic light, and the numerical scores were 0.57 and 0.43, respectively. In this second case, the visual group performed better because the system categorized both answers as equally matching. As expected, the other items were not influenced by the type of uncertainty communication, except item IV. It shows a significant difference between the groups. We are not sure what might led to this effect. But in every interpretation of the occurred effects, it is important to consider the item difficulty since it could have an impact on the decision.
The second hypothesis, focusing on the task load of the participant, stated a difference between the types of uncertainty communication, and was not supported by the data. The suggested relief of the task load that the simpler representation compared to the numerical uncertainty communication should have could not be found. Even the descriptive values point in the other direction since the visual group has a slightly higher mean of task load than
Communicating Uncertainty in AI-Based Decision Support Systems 151 the numerical group. This might indicate that although the decimal number might be more difficult to interpret it recommends in every case a clear first place by always having one option a higher number than the others. While the visual uncertainty communication returns the decision to the user when communicating two options as equivalent likely to match the problem. This responsibility to choose between those two options might have an impact on the task load.
Besides its contribution our study has some limitations: the items were not randomized in their occurrence with a certain and uncertain AI recommendation, as well as in their sequence. This is why we cannot exclude that the item difficulty had an impact on the performance. Furthermore, the sample consisted of a great number of students, especially psychology students, which is not the main target group of such AI-based decision support systems that should support employees. Moreover a problem in this study design is that you need items where the system is correct in order to build trust in the participants that the system is capable of the current task although the interesting cases are when the system errs. This leads to the fact that you have high load for the participants by several item but for the interpretation of uncertainty communication only a few are relevant.
CONCLUSION
This study investigated the impact of different types of uncertainty communication on decision-making performance and task load within a technical customer support context. The results indicate differences in the types of uncertainty communication but point in different directions; therefore, it may be dependent on the item which type of uncertainty communication succeeds. However, the findings regarding task load were inconclusive. The timing of task load assessments may have influenced participants’ perceptions, as they likely experienced relief when supported by the AI system. Future research could address this by employing larger sample sizes or within-subject designs to capture these dynamics more effectively.
The study’s limitations should be explored further. Enhancing the dataset with additional items lacking correct AI recommendations could provide deeper insights into trust dynamics between users and AI systems. Additionally, future investigations should focus on various decision-making contexts involving multiple response options and examine both effective uncertainty communication styles and the consequences of miscommunication.
In summary, while uncertainty communication shows promise in improving joint performance between humans and AI decision support systems under certain conditions, its effects on task load remain uncertain and warrant further exploration.
ACKNOWLEDGEMENT
Funded by Project Human Decision – 543081196 of Priority Programme SPP 2443: Hybrid decision support in product creation.
REFERENCES
Buçinca, Z., Malaya, M. B., & Gajos, K. Z. (2021). To Trust or to Think. Proceedings of the ACM on Human-Computer Interaction, 5(CSCW1), 1–21. https://doi. org/10.1145/3449287 Bussone, A., Stumpf, S., & O’Sullivan, D. (2015, October 21 - 2015, October 23). The
Role of Explanations on Trust and Reliance in Clinical Decision Support Systems. In 2015 International Conference on Healthcare Informatics (pp. 160–169). IEEE. https://doi.org/10.1109/ICHI.2015.26 Cao, S., Liu, A., & Huang, C.-M. (2024). Designing for Appropriate Reliance: The Roles of AI Uncertainty Presentation, Initial User Decision, and User Demographics in AI-Assisted Decision-Making. Proceedings of the ACM on Human-Computer Interaction, 8(CSCW1), 1–32. https://doi.org/10.1145/3637318 Fernandes, M., Walls, L., Munson, S., Hullman, J., & Kay, M. (04212018).
Uncertainty Displays Using Quantile Dotplots or CDFs Improve Transit Decision- Making. In R. Mandryk, M. Hancock, M. Perry, & A. Cox (Eds.), Proceedings of the 2018 CHI Conference on Human Factors in Computing Systems (pp. 1–12). ACM. https://doi.org/10.1145/3173574.3173718 Gaertig, C., & Simmons, J. P. (2018). Do People Inherently Dislike Uncertain Advice?
Psychological Science, 29(4), 504–520. https://doi.org/10.1177/0956797617739369 Gigerenzer, G., Gaissmaier, W., Kurz-Milcke, E., Schwartz, L. M., & Woloshin, S.
(2007). Helping Doctors and Patients Make Sense of Health Statistics. Psychological Science in the Public Interest : A Journal of the American Psychological Society, 8(2), 53–96. https://doi.org/10.1111/j.1539-6053.2008.00033.x Hart, S. G., & Staveland, L. E. (1988). Development of NASA-TLX (Task Load Index): Results of Empirical and Theoretical Research. In Advances in Psychology (pp. 139–183). Elsevier. https://doi.org/10.1016/s0166-4115(08)62386-9 Kong, H., Yin, Z., Baruch, Y., & Yuan, Y. (2023). The impact of trust in AI on
career sustainability: The role of employee–AI collaboration and protean career orientation. Journal of Vocational Behavior, 146, 103928. https://doi. org/10.1016/j.jvb.2023.103928 Lai, V., Chen, C., Smith-Renner, A., Liao, Q. V., & Tan, C. (2023). Towards a Science of Human-AI Decision Making: An Overview of Design Space in Empirical Human-Subject Studies. In 2023 ACM Conference on Fairness, Accountability, and Transparency (pp. 1369–1385). ACM. https://doi.org/10.1145/3593013.3594087 Lim, B. Y., & Dey, A. K. (2011). Investigating intelligibility for uncertain context-aware
applications. In Proceedings of the 13th international conference on Ubiquitous computing (pp. 415–424). ACM. https://doi.org/10.1145/2030112.2030168 Liu, H., Lai, V., & Tan, C. (2021). Understanding the Effect of Out-of-distribution Examples and Interactive Explanations on Human-AI Decision Making. Proceedings of the ACM on Human-Computer Interaction, 5(CSCW2), 1–45. https://doi.org/10.1145/3479552 Mehta, C. R., & Patel, N. R. (1983). A Network Algorithm for Performing Fisher’s Exact
Test in r × c Contingency Tables. Journal of the American Statistical Association, 78(382), 427–434. https://doi.org/10.1080/01621459.1983.10477989 Prabhudesai, S., Yang, L., Asthana, S., Huan, X., Liao, Q. V., & Banovic, N.
(2023). Understanding Uncertainty: How Lay Decision-makers Perceive and Interpret Uncertainty in Human-AI Decision Making. In Proceedings of the 28th International Conference on Intelligent User Interfaces (pp. 379–396). ACM. https://doi.org/10.1145/3581641.3584033
Communicating Uncertainty in AI-Based Decision Support Systems 153 Rechkemmer, A., & Yin, M. (2022). When Confidence Meets Accuracy: Exploring
the Effects of Multiple Performance Indicators on Trust in Machine Learning Models. In CHI Conference on Human Factors in Computing Systems (pp. 1–14). ACM. https://doi.org/10.1145/3491102.3501967 Vaccaro, M., Almaatouq, A., & Malone, T. (2024). When combinations of humans and AI are useful: A systematic review and meta-analysis. Nature Human Behaviour. Advance online publication. https://doi.org/10.1038/s41562-024-02024-1 Zhang, Y., Liao, Q. V., & Bellamy, R. K. E. (2020). Effect of confidence and explanation
on accuracy and trust calibration in AI-assisted decision making. In Proceedings of the 2020 Conference on Fairness, Accountability, and Transparency. ACM. https://doi.org/10.1145/3351095.3372852 Zhao, J., Wang, Y., Mancenido, M. V., Chiou, E. K., & Maciejewski, R. (2024).
Evaluating the Impact of Uncertainty Visualization on Model Reliance. IEEE Transactions on Visualization and Computer Graphics, 30(7), 4093–4107. https:// doi.org/10.1109/tvcg.2023.3251950
LISTED IN THE AHFE DIGITAL BOOKSTORE CATALOGUE
Explore the complete digital volume
Human Factors and Systems Interaction
Read this individual research paper free through the original publisher, or explore the full digital proceedings book.
ISBN 979-8-950676-06-2
Explore this ISBN in the AHFE Bookstore ↗Listed in the July 2026 bookstore catalogue; search by ISBN to confirm current availability · Digital book purchase optional