Eusébio Conceição, Maria Inês Conceição, Maria Manuela Lúcio, João Gomes, Hazim Awbi (2023). Numerical study of the airflow around the occupant using confluent jets system. In: Human Interaction and Emerging Technologies (IHIET-AI 2023): Artificial Intelligence and Future Applications. AHFE Open Access, vol. 70, pp. 171–179. https://doi.org/10.54941/ahfe1002941
In this paper the numerical study of the airflow around the occupant using confluent jets system is made. This study uses a software that considers a coupling between Computational Fluid Dynamics and the Human Thermal Modelling numerical models with the inputs from the Building Thermal Modelling numerical model. The coupling of numerical models is used to evaluate the human temperature distribution, using the Human Thermal Modelling numerical model, the airflow around the occupants, using the Computational Fluid Dynamic numerical model, and the room surrounding temperatures, using the Building Thermal Modelling numerical model numerical model. In this numerical work, developed for winter conditions, the airflow around the occupants and inside the space are evaluated for a confluents jets ventilation system, build with one exhaust and one inlet ventilation systems. The study is made inside a virtual chamber, occupied with two virtual manikins and equipped with one tables and two chairs. The air velocity, air temperature, Draught Risk, carbon dioxide concentration and air exchange rate field around the occupants and inside the space are evaluated.
The confluent jet ventilation system is applied in an experimental chamber occupied by two occupants. Four vertical ducts, located in the corner wall, are equipped with a set of consecutive vertical nozzles: one turned to X and the other turned to Y direction.
This numerical work uses the simulation the Turbulent Airflow Dyna- mic Modeling, which considers the Computational Fluids Dynamics, CFD, and simulates the airflow inside the space and around the occupants, see Conceição et al. (2008), and Conceição et al. (2010), and other software that simulates the Human Thermal Response Modeling and simulates the human and clothing temperature distribution, see Conceição and Lúcio (2010) and Conceição and Awbi (2021). This software, which works in a coupling meth- odology, uses the Turbulent Airflow Dynamic Modeling inputs as the Human
Thermal Response Modeling output and uses the Human Thermal Response Modeling input as the Turbulent Airflow Dynamic Modeling outputs.
The CFD applications can be analyzed in Awbi (1998), Nilsson and Holmér (2014) and Riachi (2014), as examples, and the Human Thermophy- siology application can be seen in Zhang et al. (2010), Zhang et al. (2010) and Tang et al. (2020), as an example.
The surrounding temperatures, used as inputs in the Human Thermal Response Modeling and the Turbulent Airflow Dynamic Modeling, are calcu- lated by the Building Thermal Dynamic Modeling numerical model, see Conceição and Lúcio (2016) and Conceição et al. (2018). The numerical model methodology, namely the energy and mass balance integral equations, is presented in Conceição et al. (2010).
Examples of application of the Building Thermal Dynamic Modeling numerical model can be analyzed in Balaji et al. (2019), Kolokotsa et al. (2011) and Djedjig et al. (2013).
Numerical Methodology This study is made inside an experimental chamber, that simulates the office space, equipped with two seats, one table, one inlet ventilation system and one outlet ventilation system and occupied by two occupants. The experimental chamber has small dimensions (2.7×2.45×2.4 m3).
The inlet ventilation system considers:
four horizontal ducts
four vertical ducts, placed in the wall corner;
four duct ventilators systems connected to the vertical duct;
each vertical duct is equipped with a set of consecutive nozzles.
The outlet ventilation system is made with:
one vertical duct, located in the central area of the space;
one exhaustion ventilator system.
The input data are as follows:
Inlet air velocity is 5 m/s (value associated with the airflow rate);
Inlet air temperature of 19.3
C (value calculated by the Building Thermal Dynamic Modeling numerical model);
The mean internal air temperature is 20
C (value used in the Building Thermal Dynamic Modeling numerical model);
Inlet air turbulence intensity of 10%;
External air temperature of 0
C (winter conditions).
In this numerical simulation, made in winter conditions, the inputs of the Turbulent Airflow Dynamic Modeling and the Human Thermal Response Modeling are calculated by the Building Thermal Dynamic Modeling nume- rical model.
Figure 1 shows the virtual experimental chamber grid generation. The grid generation, presented in the Figure, is refined near the inlet nozzle, near the wall surfaces and in the outlet.
Numerical Study of the Airflow Around the Occupant Using Confluent Jets System 173
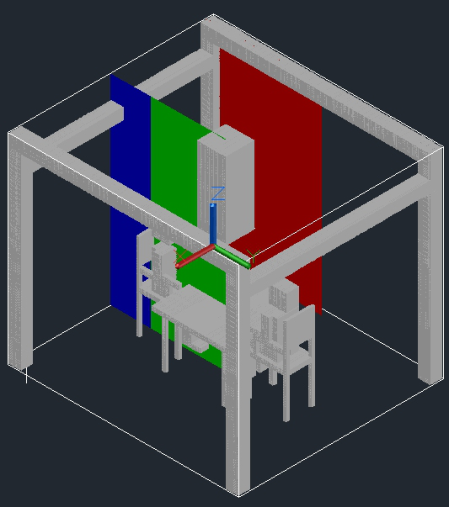
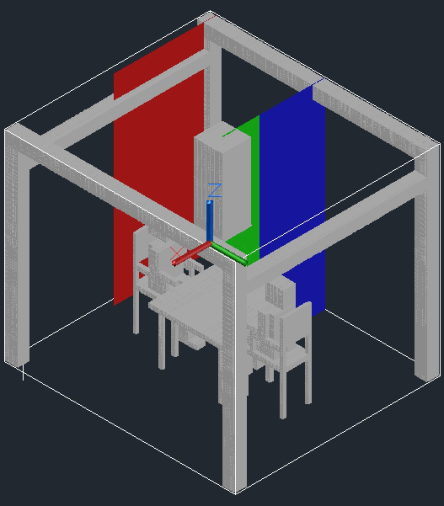
The numerical simulation calculates the internal air velocity, and other variables, in all cells. However, in this work, only four plans are presented: two plans in the X direction and two plans in the Y direction. Thus, Figure 2 shows the representation of two vertical plans in the X direction and Figure 3 shows the representation of two vertical plans in the Y direction. In both directions, two planes are considered: one plan located in the inlet area and one plan located in the office central area. The central area plan is divided into two parts.
RESULTS
In this section, the air velocity distribution, in vertical plans, located near the inlet area and in the office central area are presented.
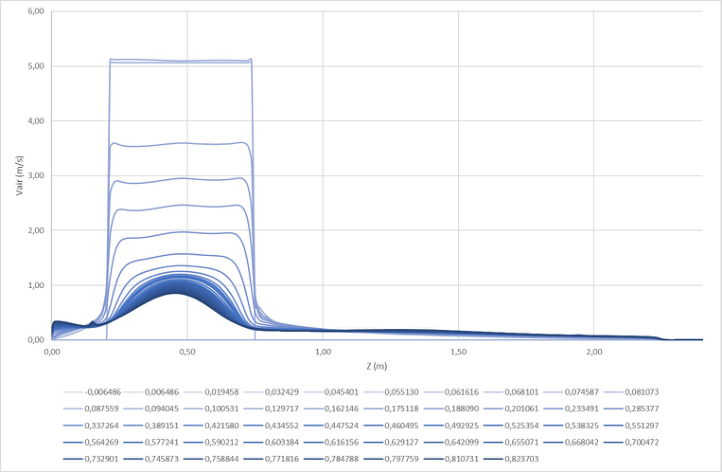
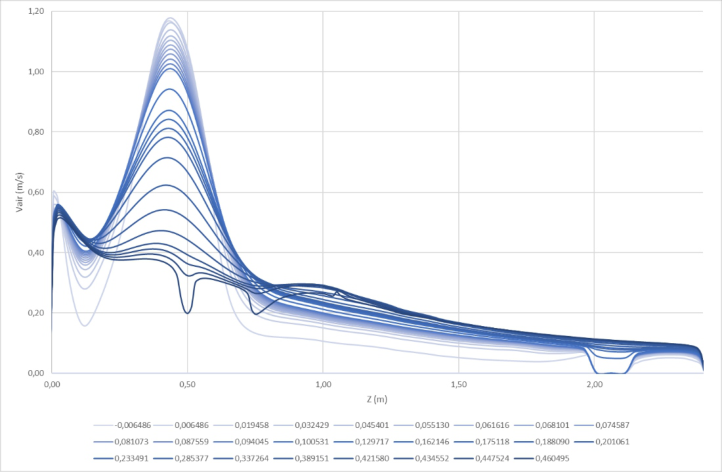
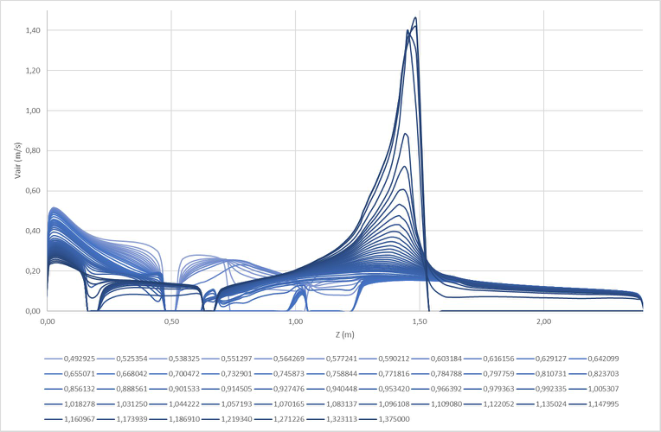
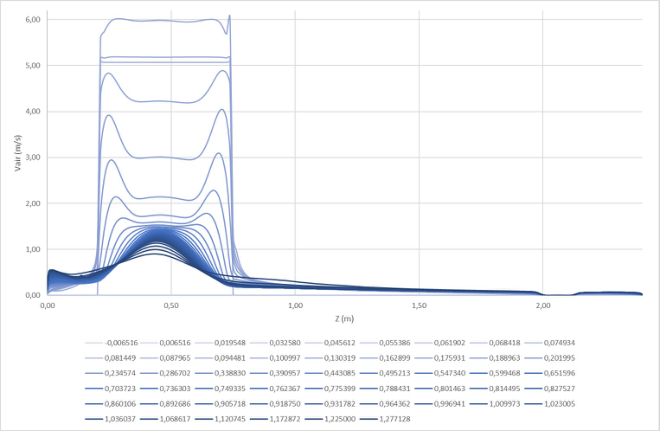
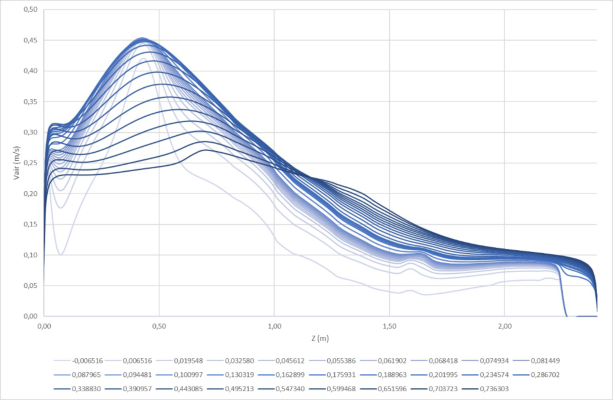
In Figure 4 the vertical plane, in the X direction, located in the inlet area is presented, in Figure 5 the vertical plane, in the X direction, located in the office central area, in a non-occupied area, is shown and in Figure 6 the verti- cal planes, in the X direction, located in the office central area, in an occupied area, is presented.
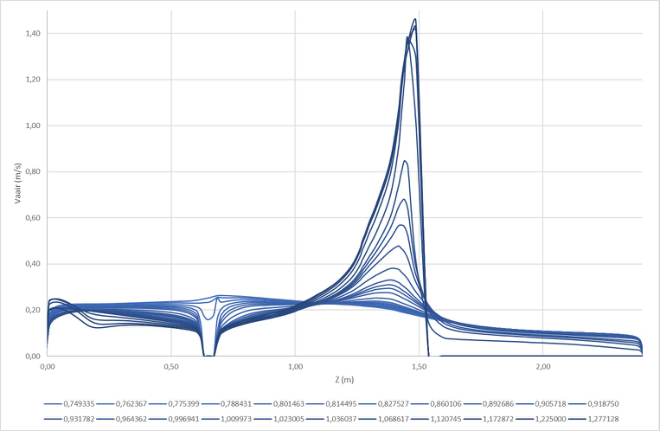
The vertical plane, in the Y direction, located in the inlet area is presented in Figure 7, the vertical planes, in the Y direction, located in the office central area, in a non-occupied area, is shown in Figure 8 and the vertical planes, in the Y direction, located in the office central area, in an occupied area, is presented in Figure 9.
Figure 2: Vertical planes, in the X direction, located in the inlet area (red colour) and one plan located in the office central area (blue colour in the non-occupied area and green colour in the occupied area).Figure 3: Vertical planes, in the Y direction, located in the inlet area (red colour) and one plan located in the office central area (blue colour in the non-occupied area and green colour in the occupied area).
Numerical Study of the Airflow Around the Occupant Using Confluent Jets System 175
Figure 4: Vertical plane, in the X direction, located in the inlet area.Figure 5: Vertical planes, in the X direction, located in the office central area, in a non- occupied area.
Figure 4, for different vertical lines, near the wall surface, in the X dire- ction, shows that the air velocity value decreases from the inlet area (inlet nozzles) to the central area and the highest value is in the low member’s area.
Figure 6: Vertical planes, in the X direction, located in the office central area, in an occupied area.Figure 7: Vertical plane, in the Y direction, located in the inlet area.
The air velocity in the central area, in the X direction, in a non-occupied area, presents the highest air velocity value in the low member’s area (see Figure 5).
The air velocity, in the occupied area, presents a relatively homogeneous air velocity in the human body section. Near the floor, the air velocity level is slightly highest. However, the highest air velocity level increase above the head level, mainly, in the exhaustion area (see Figure 6).
Numerical Study of the Airflow Around the Occupant Using Confluent Jets System 177
Figure 8: Vertical planes, in the X direction, located in the office central area, in a non- occupied area.Figure 9: Vertical planes, in the Y direction, located in the office central area, in an occupied area.
The air velocity, in the Y direction, in the inlet area and near the wall, presents some results that were verified in the X direction (see Figure 7).
The air velocity, in the Y direction, in the non-occupied area, and in the central area, is higher in the human low member’s area and decreases above the head level (see Figure 8).
The air velocity, in the Y direction, in the occupied area (desk), and in the central area, is uniform and increases in the exhaust area (see Figure 9).
CONCLUSION
In this work, the numerical study of the airflow around the occupant using a confluent jet system is made. The study considers the air velocity distribution in the occupied area and the non-occupied area.
In accordance with the obtained results, near the wall surface, show that the air velocity value decreases from the inlet area (inlet nozzles) to the central area and the highest value is in the human low member’s area.
The air velocity in the central area show, in a non-occupied area, presents the highest air velocity value in the low member’s area and the occupied area presents a relatively homogeneous air velocity in the human body section. The highest air velocity level increase above the head level, mainly, in the exhaustion area.
In this system, in accordance with the obtained results, the airflow in the inlet area promotes an air velocity distribution near the wall surface and in the floor area to the occupation area. The airflow is relatively uniform around the occupants and increases above the head level to the exhaust level.
ACKNOWLEDGMENT
The authors would like to acknowledge. The authors would like to ackno- wledge the project (SAICT-ALG/39586/2018) from Algarve Regional Ope- rational Program (CRESC Algarve 2020), under the PORTUGAL 2020 Partnership Agreement, through the European Regional Development Fund (ERDF) and the National Science and Technology Foundation (FCT).
REFERENCES
D. Kolokotsa, D. Rovas, E. Kosmatopoulos, and K. Kalaitzakis, “A roadmap towards intelligent net zero- and positive-energy buildings,” Solar Energy. 2011, doi: 10.1016/j.solener.2010.09.001. E. Conceição and H. Awbi, “Evaluation of integral effect of thermal comfort, air qua-
lity and draught risk for desks equipped with personalized ventilation systems,” Energies, 2021, doi: 10.3390/en14113235. E. Z. E. Conceição and M. M. J. R. Lúcio, “Evaluation of thermal comfort conditions in a localized radiant system placed in front and behind two students seated nearby warmed curtains,” Build. Environ., vol. 45, no. 10, 2010, doi: 10.1016/j.buildenv.2010.03.006. E. Z. E. Conceição and M. M. J. R. Lúcio, “Numerical simulation of passive and
active solar strategies in buildings with complex topology,” Build. Simul., vol. 3, no. 3, 2010, doi: 10.1007/s12273-010-0010-7. E. Z. E. Conceição and M. M. J. R. Lúcio, “Numerical simulation of the application of solar radiant systems, internal airflow and occupants’ presence in the improvement of comfort in winter conditions,” Buildings, vol. 6, no. 3, 2016, doi: 10.3390/buildings6030038. E. Z. E. Conceição, C. I. M. Santiago, M. M. J. R. Lúcio, and H. B. Awbi, “Predicting
the air quality, thermal comfort and draught risk for a virtual classroom with desk-type personalized ventilation systems,” Buildings, vol. 8, no. 2, 2018, doi: 10.3390/buildings8020035. E. Z. E. Conceição, S. P. Rosa, A. L. V. Custódio, R. L. Andrade, M. J. P. A. Meira, and M. M. J. R. Lúcio, “Study of airflow around occupants seated in desks equipped
Numerical Study of the Airflow Around the Occupant Using Confluent Jets System 179
with upper and lower air terminal devices for slightly warm environments,”HVAC R Res., vol. 16, no. 4, 2010, doi: 10.1080/10789669.2010.10390912. E. Z. E. Conceição, V. D. S. R. Vicente, and M. M. J. R. Lúcio, “Airflow inside school building office compartments with moderate environments,” HVAC R Res., vol. 14, no. 2, 2008, doi: 10.1080/10789669.2008.10391003. H. B. Awbi, “Energy efficient room air distribution,” Renew. Energy, 1998, doi:
10.1016/s0960-1481(98)00176-1. H. O. Nilsson and I. Holmér, “Comfort climate evaluation with thermal manikin methods and computer simulation models,” Indoor Air, 2003, doi: 10.1034/j. 1600–0668.2003.01113.x. H. Zhang, E. Arens, C. Huizenga, and T. Han, “Thermal sensation and comfort models for non-uniform and transient environments, part II: Local comfort of individual body parts,” Build. Environ., 2010, doi: 10.1016/j.buildenv.2009.06.015. H. Zhang, E. Arens, C. Huizenga, and T. Han, “Thermal sensation and comfort models for non-uniform and transient environments: Part I: Local sensation of individual body parts,” Build. Environ., 2010, doi: 10.1016/j.buildenv.2009.06.018. N. C. Balaji, M. Mani, and B. V. Venkatarama Reddy, “Dynamic thermal performa-
nce of conventional and alternative building wall envelopes,” J. Build. Eng., 2019, doi: 10.1016/j.jobe.2018.11.002. R. Djedjig, E. Bozonnet, and R. Belarbi, “Integration of a green envelope model in a transient building simulation program and experimental comparison,” 2013. Y. Riachi, “A Numerical Model for Simulating Thermal Comfort Prediction
in Public Transportation Buses,” Int. J. Environ. Prot. Policy, 2014, doi: 10.11648/j.ijepp.20140201.11. Y. Tang, H. Yu, Z. Wang, M. Luo, and C. Li, “Validation of the Stolwijk and Tanabe Human Thermoregulation Models for Predicting Local Skin Temperatu- res of Older People under Thermal Transient Conditions,” Energies, 2020, doi: 10.3390/en13246524.
LISTED IN THE AHFE DIGITAL BOOKSTORE CATALOGUE
Explore the complete digital volume
Human Interaction and Emerging Technologies (IHIET-AI 2023): Artificial Intelligence and Future Applications
Read this individual research paper free through the original publisher, or explore the full digital proceedings book.
ISBN 978-1-958651-46-9
Explore this ISBN in the AHFE Bookstore ↗Listed in the July 2026 bookstore catalogue; search by ISBN to confirm current availability · Digital book purchase optional