Eleonora Bianca, Gianluca Boccardo, Antonio Buffo, Marco Vanni, Ada Ferri (2025). A Multimodal Approach to Predicting Toe Temperature: Experimental, CFD, and LSTM-Based Methods. In: Accessibility, Assistive Technology and Digital Environments. AHFE Open Access, vol. 162, pp. 201–210. https://doi.org/10.54941/ahfe1006027
For technical footwear, such as mountaineering boots, there is currently no official standard for assessing and quantifying their thermal insulation, although this is crucial for footwear designed for use at high altitudes. Thermal insulation is not only important for the comfort of the wearer but also for safety during prolonged exposure to extreme conditions. This study aims to develop a customizable simulation model (based on Computational Fluid Dynamics, CFD) for mountaineering boots that allows the evaluation of their thermal resistance (RcT in m²K/W) according to the UNI EN ISO 15831:2004 standard.The 3D geometry of the boot was reconstructed with the Rhinoceros 7 CAD software based on a realistic reproduction of the considered boot prototype. The model simplifies the design by removing details such as laces, lace holes, and the outer gaiter, which does not contribute to thermal insulation. To increase realism, the model contains an air gap between the foot and the shoe in some specific areas, which reproduces the actual conditions as accurately as possible.The computational framework uses a User Defined Database (UDD), implemented in the CFD software Ansys Fluent to manage the material composition of the boot. The database contains the thermal properties of the materials used, such as thermal conductivity (in W/mK) and thickness (in mm), evaluated according to the UNI EN ISO 9920:2007 and UNI EN ISO 5084:1998 standards. The CFD simulations were validated by comparing the results with experimental data obtained with a Newton Thermal Manikin and showed a deviation of only 12%. This discrepancy is attributed to minor differences between the CAD model and the physical prototype of the boot. The validated CFD results provides the first relevant metric describing the insulation performance of the shoe.The simulation results are also integrated into a SARIMAX machine learning algorithm that predicts the temperature of the big toe over time starting from the average skin temperature (whose strong correlation with big toe temperature has been observed and confirmed through numerous human test experimental campaigns). The data used to train and test the SARIMAX algorithm came from in vivo tests performed in a climate chamber under four different environmental and activity conditions corresponding to different Metabolic Rates (MR). All tests were performed according to strict protocols to ensure reproducibility. This included standardized clothing for all participants and a uniform test time to minimize disruption to circadian cycles in thermoregulation. Core temperature was monitored as an additional control measure.This model is then used in connection to the JOS-3 thermoregulation model, a system of 83 interconnected nodes that calculates human physiological responses and body temperatures using a numerical backward difference method. The thermoregulation model is able to return the mean skin temperature, given as an input to the previously trained SARIMAX algorithm resulting in an otherwise unavailable (to JOS-3) big toe temperature.The predicted big toe temperature serves as a secondary parameter for evaluating the insulation performance of the shoe. The maximum exposure duration is defined as the time (in minutes or hours) required for the temperature of the big toe to reach the safety limit of 15°C. This two-parameter approach improves the evaluation of technical footwear and takes into account both comfort and safety in extreme environments.
Cold protection shoes are a complex system. They are made of many different materials and even in the sports field, they are considered more closely as personal protective equipment (PPE) rather than casual sportswear. Today, there is no reliable standard to assess and correctly differentiate between the various insulation levels of different shoe models. The only existing standard is ISO 20344:2021 (ISO 20344, 2021), which was developed for work environments. However, it only relies on a pass/fail criterion, which brings with it some limitations, such as a deceptive sense of security, a complete lack of distinction between different levels of insulations, and a lack of evaluation of protection in practice (Kuklane et al., 2009).
Especially in cold environments, thermoregulation of the extremities (such as hands and feet) works differently from that of the whole body. It is affected by mechanisms such as vasoconstriction and cold-induced vasodilation, which in some extreme cases can lead to severe hypothermia and frostbite. In the literature, some studies have been carried out to observe
how thermoregulation works on feet (Bianca et al., 2024; Kuklane, 2009; Taylor et al., 2014; Zhang et al., 2024) and it has been found that a crucial condition for feet health that appears at 15
C. In this situation, pain receptors take precedence over the cold receptors and if this temperature is maintained for a prolonged period, tissue death may occur.
As it is important to improve the evaluation of the thermal properties of highly technical footwear (e.g., mountain boots for alpinism and extreme expeditions) in the sports sector, two parameters have been developed in this work with the purpose of allowing the manufacturer to more deeply explore and compare the performance different prototypes in their intended environmental conditions. The first approach is concerned with predicting (using a Neural Network, NN) the maximum duration of exposure (in time, hours) a person could be in the environmental conditions under consideration when wearing the specified insulation before reaching the 15
C threshold for the big toe. The second parameter is the estimation of RcT (m2K/W) for new prototypes of footwear thanks to the development of a CFD model in which the test conditions of ISO 15831:2004 (Clothing - Physiological effects. Measurement of thermal insulation by means of a thermal manikin) (ISO 15831, 2004), were reproduced.
METHODOLOGY
Experimental Tests Human tests were carried out to observe human thermoregulation in different scenarios (all considering cold and hostile environments). The tests were carried out in a climate chamber at the Polytechnic University of Turin and at Loughborough University. The factors that had the greatest impact on human thermoregulation were clothing insulation, environmental conditions (such as temperature and wind speed), and the level of physical activity. For this reason, the tests were carried out in such a way that one characteristic was varied per test. To summarise, the different protocols were carried out as follows:
Simulated mountaineering excursions: Participants were exposed to different environmental conditions (−10
C, −15
C, −17
C, −20
C, −30
C) wearing two different insulation levels of footwear (with different clo values where 1 clo corresponds to 0.155 m2K/W) to simulate real mountaineering activities.
Light walking exercises on a treadmill: Participants walked lightly to maintain a sufficient metabolic rate and avoid shivering. Shivering is an unwanted in these tests as its connected metabolic response would constitute a confounding factor. The tests were carried out under different environmental conditions (−10
C, −15
C, −17
C, −20
C, −30
C) and with different insulation levels of the boots (clo value).
Worst-case scenario tests: Participants were asked to remain in the climate chamber, where extreme conditions were simulated, with different environmental conditions (−10
C, −15
C, −17
C, −20
C, −30
C) and different levels of footwear insulation (clo).
A Multimodal Approach to Predicting Toe Temperature 203
In each test, some parameters were determined, such as mean skin temperature, which was assessed using the 14-point method described in the international standard ISO 9886:2004 (Ergonomics - Assessment of thermal strain by physiological measurements) (ISO 9886, 2008), the temperature of the big toe, the heart rate, the levels of insulation of the different garments worn, which were assessed according to ISO 15831:2004, and thermal images to assess the surface temperature of the boots and to define the cleats that were effectively in contact with the ground.
Computational Models Starting from an existing model of boot designed for extreme alpinism and ice climbing (Phantom Tech HD, produced by S.C.A.R.P.A., Asolo, Italy) a 3D reconstruction was created with CAD software. According to the different areas in terms of composition, the model was split into eleven regions to allow the user to assign different thermal properties according to the subjected area. For this purpose, the materials involved were tested according to ISO 9920:2007 (Ergonomics of the thermal environment — Estimation of thermal insulation and water vapor resistance of a clothing ensemble) (ISO 9920, 2007) to evaluate their thermal properties. A User Defined Database (UDD) was created as a material library. Numerical simulations were set up in Computational Fluid Dynamics (CFD) software to reproduce the same test condition of the ISO 15831:2004 standard. For this reason, the internal volume of the boot structure is constituted by a hot body set at a Tfoot of 34
C. Gaps of quiescent air were interposed between the boot and the “body” in some specific areas (i.e., the lacing area and the contact area between the foot and the insole were excluded supposing a perfect contact in these areas) to mimic the realistic presence of an air layer in the system. The ambient temperature (Ta) was set to 10
C and different boundary conditions were imposed in the different areas of the boots:
Heat transfer coefficient: in the areas in which the boot was in contact with the layer of quiescent air, a convective boundary condition was imposed using a convective heat transfer coefficient (hc) calculated with Ta and a wind speed (ws) of 0.4 m/s as specified in the reference standard. The hc was then evaluated as follows (Parsons, 2014; Santee and William, 2012):
hc = Nu · ka
L (Wm−2K−1)
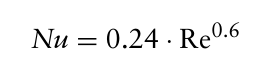
Where Nu is the Nusselt number, ka is the thermal conductivity of air and L is the characteristic length (set as a constant at a value of 0.4 m). Nu was evaluated as (Parsons, 2014):
Equation reproduced from the original PDF.
Re is the Reynolds number given by the ratio between the product of ws and L and the kinematic viscosity of air at the temperature considered, denoted ν (i.e., 1,31·10−6 m2s−2 at 10
C).
The value of ka was calculated with the following method (Kerslake, 1972): ka = 2.41 · 10−2 + 7.8 · 10−5 · Ta (Wm−1K−1)
Ta is the ambient temperature in K.
Prescribed temperature: in the area in which the boot was in contact with the ground a fixed temperature was imposed at the same value of Ta. The cleats that effectively were in contact were observed with the thermal images acquired in the experimental campaigns. The same condition was set in the hot body, fixing his temperature at Tfoot.
In this way, the value of the RcT of the boot was calculated, and the ratio between the temperature gradient between the foot and the environment and the heat flux released by the hot body to keep its temperature constant as follows:
(Tfoot −Ta) (m−2K/W).
RcT = Hf,foot
Data-Driven Model Due to the strong correlation between mean skin temperature and big toe temperature, various approaches have been explored to predict big toe temperature from skin temperature data. Given the strong temporal dependencies in the dataset, the most effective approach identified relies on Recurrent Neural Networks (RNNs). However, a major challenge with these architectures is the vanishing gradient problem: during backpropagation through time (BPTT), gradients can shrink exponentially, leading to near-zero weight updates and the loss of long-term dependencies.
This issue has been effectively addressed with the introduction of Long Short-Term Memory (LSTM) networks, which differ from standard RNNs by incorporating an internal recurrence (self-loop). This mechanism helps regulate the flow of information and mitigates the effects of vanishing and exploding gradients (Lipton et al., 2015; Mienye et al., 2024). Specifically, each LSTM cell includes additional parameters and a system of gating units—input, output, and forget gates—that dynamically control information retention and forgetting, allowing the network to selectively propagate relevant information while discarding less important signals. The neural network was trained on the datasets collected from human experiments. The data were labeled based on the following criteria: temperature (ambient temperature at which the tests were conducted), activity level (0 for rest, 1 for light walking, and 2 for intense activity), and RcT (insulation level of the boot worn). Before training, the dataset was normalized using a Robust Scaler to ensure consistent feature scaling. Furthermore, hyperparameter tuning was conducted to optimize the model’s performance. The parameters adjusted included: the number of units in the first and second LSTM layers, dropout rates for both layers, and the learning rate. Moreover, a custom loss function to monitor the training process was created to evaluate the algorithm
A Multimodal Approach to Predicting Toe Temperature 205
performance based on the difference between the predicted time to reach the threshold and the experimentally measured one.
Once the LSTM was trained, the prediction of big toe temperature was compared with the test datasets (one for each condition) previously excluded from the training and validation ones (splitting of the training dataset in training and validation was done at 20%). The final, most robust, LSTM was then used as a big toe temperature predictor, which uses as input the mean skin temperature given by the thermoregulation model JOS-3 (Choudhary and Udayraj, 2023; Kobayashi and Tanabe, 2013; Takahashi et al., 2021).
RESULTS
The most accurate Long Short-Term Memory (LSTM) architecture, as identified through hyperparameter optimization, consisted of the following configuration:
Two LSTM layers followed by a final dense output layer.
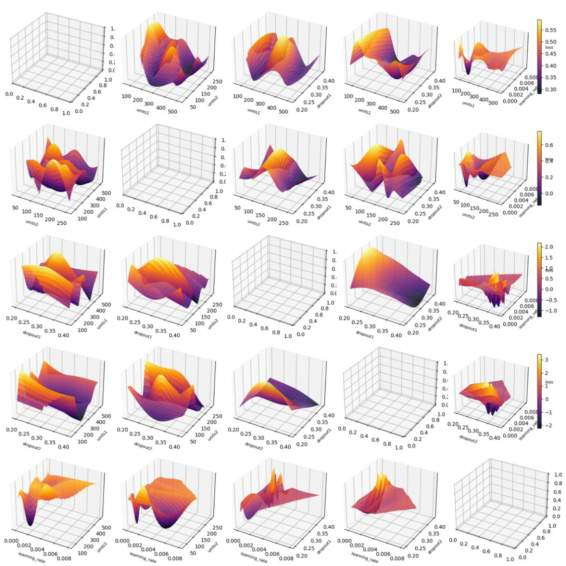
Figure 1 presents a surface plot of the mean absolute error (MAE,evaluated as the distance between the predicted and true temperature time series) on the validation set across all tested hyperparameter configurations, presented as a function of only two of the five explored hyperparameters in each subplot. The effect of changing the number of layers, type of optimizer, and activation function is not shown as the presented choices were quickly identified as the best ones without the need of a structured optimization approach. To ensure clarity in the visualization, only the top 50 performing configurations are displayed.
A custom loss function was also implemented to better reflect the specific prediction objective. Since the primary goal of the model is to estimate the time at which the temperature curve reaches a critical threshold of 15
C, the loss function incorporates a SoftMax component that penalizes discrepancies between the predicted time-to-threshold and the experimentally observed value. The β parameter of the SoftMax function, which controls its sharpness, was also tuned as part of the optimization process.
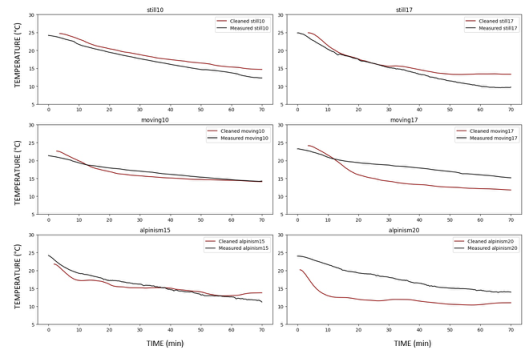
The model’s predictions were evaluated against experimental data in six different scenarios. As illustrated in Figure 2, prediction accuracy tends to degrade in scenarios labeled as Level 2 physical activity (i.e., high-intensity exertion). This reduction in performance may be attributed to inter-individual variability in physiological response to intense activity due to different training levels, which introduces additional complexity to the prediction task.
Figure 1: Surface plot of the best 50 architectures resulting from the hyperparameter tuning.
Despite this, the LSTM model performs well under “critical” scenarios—such as conditions involving sustained stillness for 70 minutes— demonstrating its robustness in predicting temperature dynamics under thermally stressful but physically passive conditions.
Figure 2: Comparison between test and predicted data.
A Multimodal Approach to Predicting Toe Temperature 207
In Table 1 the performance in terms of accuracy of the predicting the time to reach threshold (i.e., 15
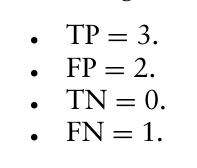
C) is reported. The different scenario is labelled as (ambient temperature, level of activity, and level of boot insulation) where the level of boot insulation is defined as A or B. The model’s predictions were evaluated based on the following classification (Heydarian et al., 2022): True Positive (TP) if the threshold was reached within ±10 minutes of the experimental time, False Positive (FP) if the prediction deviated by more than 10 minutes from the experimental time, True Negative (TN) if neither the prediction nor the experimental curve reached the threshold, and False Negative (FN) if the error exceeded 10 minutes.
Based on the confusion matrix in Table 1, the model results in the following:
Equation reproduced from the original PDF.
Then, the accuracy, precision, and recall are evaluated as follows: Accuracy = TP + TN TP + TN + FP + FN
Precision = TP TP + FP Recall = TP TP + FN
Table 1: Confusion Matrix of the LSTM model.
Table available in the original PDF paper.
Case Ground Truth LSTM Prediction Time Error (min) (−10, 0, A) 1 1 2 (−17, 0, B) 1 1 6 (−10, 1, A) 1 1 10 (−17, 1, A) 1 0 N/A (−15, 2, B) 1 1 5 (−20, 2, B) 1 1 30
The accuracy measures the proportion of correct predictions over the total number of cases, providing an overall indication of model performance. Precision represents the ratio of true positives to the total number of predicted positives, reflecting the correctness of positive predictions. Recall measures the ratio of true positives to the total number of actual positives, indicating the model’s ability to correctly identify positive cases.
The model achieved an accuracy of 0.5, precision of 0.6, and recall of 0.75. These results indicate that while the model is relatively effective at identifying instances where the temperature crosses the 15
C threshold, it also experiences some significant prediction errors.
The high recall (75%) suggests that the model successfully identifies most of the positive cases—when the temperature drops below 15
C. However, the lower precision (60%) indicates that the model incorrectly predicts some events, resulting in false positives. This suggests that the model is more adept at identifying potential threshold crossings but tends to overestimate their occurrence in some cases. The accuracy value of 50% reflects that the model makes correct predictions in only half of the cases. This could be attributed to a high error rate in both positive and negative classifications, possibly influenced by class imbalance or the inherent difficulty of the prediction task. These results highlight the trade-off between precision and recall, which is common in classification problems. In this case, prioritizing recall over precision has led to a model that detects more positive events but at the cost of increased false positives.
Moreover, the development of a standardized system for CFD simulations has significantly enhanced the model’s predictive capabilities. By simulating thermal dynamics in various boot configurations, the model can now predict the temperature decrease over time under different environmental and physical activity conditions. The CFD simulations are particularly valuable in estimating the RcT of new boot models, which is one of the key parameters used by the neural network to make predictions.
The reliability of the CFD system has been rigorously evaluated by comparing the simulation results with experimental data. Specifically, the deviation between the simulated RcT values and those obtained through laboratory tests, conducted according to the ISO 15831 standard, was analyzed.
This comparison ensures that the CFD model accurately reflects the real- world performance of different boot models, thereby validating its use in the overall prediction process.
CONCLUSION
A new method for monitoring and predicting the physiological response in terms of thermoregulation in cold environments, specifically concerning the monitoring of big toe temperature, has been developed. Future improvements could involve fine-tuning the model to strike a better balance between these two metrics, potentially by adjusting the classification threshold or exploring additional techniques for handling class imbalance. Although the model currently operates with a slight bias toward false positives, it is preferable to adopt a more conservative approach in this context. Since the goal is to predict and avoid hazardous conditions, prioritizing the detection of potential threats, even at the cost of increased false positives, ensures a safer outcome, as it helps to prevent dangerous situations before they occur.
CONFLICT OF INTEREST The authors declare the following financial interests/personal relationships which may be considered as potential competing interests: the research has been partially funded by the Italian manufacturing company S.C.A.R.P.A.
A Multimodal Approach to Predicting Toe Temperature 209
s.p.a. within the framework of the “Decreto Ministeriale n. 117 del 02.03.2023 | Ministero dell’Università e della Ricerca”.
REFERENCES
Bianca, E., Dotti, F., Orrico, F., Ferri, A., 2024. Thermoregulation of feet in cold environments: A study on alpinism. Applied Ergonomics 116. https://doi.org/10. 1016/j.apergo.2023.104205 Choudhary, B., Udayraj, 2023. Validity of the JOS-3 model for male tropical
population and analysis of their thermal comfort. S¯adhan¯a 48, 208. https://do i.org/10.1007/s12046-023-02254-5 Heydarian, M., Doyle, T. E., Samavi, R., 2022. MLCM: Multi-Label Confusion Matrix. IEEE Access 10, 19083–19095. https://doi.org/10.1109/ACCESS.2022. 3151048 ISO 9886, 2008. BS EN ISO 9886:2004 Ergonomics. Evaluation of thermal strain
by physiological measurements. [WWW Document]. ISO. URL https://www.iso. org/standard/34110.html (accessed 4.28.23). ISO 9920, 2007. ISO 9920:2007 - Ergonomics of the thermal environment — Estimation of thermal insulation and water vapour resistance of a clothing ensemble. ISO 15831, 2004. BS EN ISO 15831:2004 Clothing. Physiological effects. Measurement of thermal insulation by means of a thermal manikin. ISO 20344, 2021. BS EN ISO 20344:2021 Personal protective equipment. Test
methods for footwear [WWW Document]. URL https://bsol-bsigroup-com.ezpr oxy.biblio.polito.it/Bibliographic/BibliographicInfoData/000000000030382286 (accessed 6.13.23). Kerslake, D. M., 1972. The Stress of Hot Environments. CUP Archive. Kobayashi, Y., Tanabe, S., 2013. Development of JOS-2 human thermoregulation model with detailed vascular system. Building and Environment 66, 1–10. https://doi.org/10.1016/j.buildenv.2013.04.013 Kuklane, K., 2009. Protection of feet in cold exposure. Ind Health 47, 242–253.
https://doi.org/10.2486/indhealth.47.242 Kuklane, K., Ueno, S., Sawada, S.-I., Holmér, I., 2009. Testing Cold Protection According to EN ISO 20344: Is There Any Professional Footwear that Does Not Pass? The Annals of Occupational Hygiene 53, 63–68. https://doi.org/10.1093/an nhyg/men074 Lipton, Z. C., Berkowitz, J., Elkan, C., 2015. A Critical Review of Recurrent Neural
Networks for Sequence Learning. https://doi.org/10.48550/arXiv.1506.00019 Mienye, I. D., Swart, T. G., Obaido, G., 2024. Recurrent Neural Networks: A Comprehensive Review of Architectures, Variants, and Applications. Information 15, 517. https://doi.org/10.3390/info15090517 Parsons, K., 2014. Human Thermal Environments: The Effects of Hot, Moderate,
and Cold Environments on Human Health, Comfort, and Performance, Third Edition, 3rd ed. CRC Press, Boca Raton. https://doi.org/10.1201/b16750 Santee, W. R., William, M., 2012. Evaluation of the thermal environment, in: Military Quantitative Physiology: Problems and Concepts in Military Operational Medicine. Takahashi, Y., Nomoto, A., Yoda, S., Hisayama, R., Ogata, M., Ozeki, Y., Tanabe,
S., 2021. Thermoregulation model JOS-3 with new open source code. Energy and Buildings 231, 110575. https://doi.org/10.1016/j.enbuild.2020.110575
Taylor, N. A., Machado-Moreira, C. A., Van Den Heuvel, A. M. J., Caldwell, J. N.,
2014. Hands and feet: physiological insulators, radiators and evaporators. Eur J Appl Physiol 114, 2037–2060. https://doi.org/10.1007/s00421-014-2940-8 Zhang, M., Li, R., Wu, Y., Song, G., 2024. Thermoregulation of human hands in cold environments and its modeling approach: A comprehensive review. Building and Environment 248, 111093. https://doi.org/10.1016/j.buildenv.2023.111093
LISTED IN THE AHFE DIGITAL BOOKSTORE CATALOGUE
Explore the complete digital volume
Accessibility, Assistive Technology and Digital Environments
Read this individual research paper free through the original publisher, or explore the full digital proceedings book.
ISBN 978-1-964867-38-0
Explore this ISBN in the AHFE Bookstore ↗Listed in the July 2026 bookstore catalogue; search by ISBN to confirm current availability · Digital book purchase optional