Xinyuan Zhao, Yuan Xiang, Shuo Li, Hu Zhao (2023). Analyzing the effects of split-screen animated transition on user experience in In-Vehicle Infotainment Systems. In: Ergonomics In Design. AHFE Open Access, vol. 77, pp. 243–253. https://doi.org/10.54941/ahfe1003382
Enhancing the user experience of IVIS GUI has become increasingly important in the automotive industry. The size of IVIS screen is getting larger and larger, and as time goes by, in the process of using IVIS, because the size of IVIS can usually allow different applications to be displayed at the same time, the screen needs to display the appropriate split-screen animated transition during the user opening split screen status. In this study, we designed quantitative experiments on three basic transition effects: fade, slide, and zoom, and manipulated (9 combinations of transition effects + no transition effects) 10 combinations of transition effects at 9 different interval times in sequence, with 31 users participating in our experiments. The results of the study show that the most suitable combination of transition motion is AzoomBfade, AzoomBslide, AzoomBzoom, and when B delay 150 ms interval is the most suitable interval for split-screen transition effect, and this time should not exceed 400 ms for A application and 430 ms for B. This study provides relevant guidelines for the field of motion design to improve user experience.
Animated transitions have become an integral aspect of graphical user inter- faces since (Chang and Ungar, 1993) pioneering efforts to incorporate ani- mation into screen interfaces. Researches have shown that moving objects capture users’ attention more effectively than static objects (Carmi and Itti, 2006; Pratt et al., 2010; Theeuwes, 1991), and that animation can aid in navigation and understanding of large amounts of information (Bederson and Boltman, 1999; Tversky, Morrison and Betrancourt, 2002; Heer and Robertson, 2007). More recently, as research on animation extends to the user experience (Merz, Tuch and Opwis, 2016), Google’s Material Design (Material Design, 2019; Material Design, 2022) and Apple’s Motion Design (Apple Developer, 2019) derived different screen sizes for optimal values for transition animations, and basic transition motion patterns and used them as a guideline. (Kim et al., 2022) also gave design suggestions related to the perception and user experience of transition motion effects for transition motion performance in automotive environments.
With the rise of autonomous vehicle technology, the era of self-driving cars is rapidly approaching. Animation is no longer limited to the field of mobile and is expected to play a crucial role in the context of vehicles. (Kim et al., 2022) Today, IVIS screens are now getting larger and larger, and over time, the original cluster system will be replaced by the so-called “digital cockpit”(Tesla, 2023) During the use of IVIS, as the size of IVIS can allow different in-vehicle applications to be presented at the same time, the screen needs to show proper split-screen animated transition during the user swi- tching applications. The current research on transition effects is focused on a single application in mobile or car, and there is no research on transition effects for split screen. However, there have been no studies investigating the impact of animated transitioning split-screens within the IVIS screen in vehicles. Therefore, research into the split-screen transition animation for large-screen IVIS in the automotive context is necessary and novel.
Studies on transition effects are currently conducted in basic single-page scenarios. A study by (Avila-Munoz, Clemente-Mediavilla and Perez-Luque, 2021) discussed the different functions that animation serves in mobile interfaces: Identifying Function, Structural Function, Guidance, Feedback, Didactic Function, Aesthetic Function, Emotive Function, Safety. Research (Kim et al., 2020) explored the differences in emotional quality brought about by different animation performances in a car background. (Ma, Chen and Lin, 2018) evaluated the differences in emotional and cognitive load of animation. (Cnattingius, 2021) analyzed the differences among three basic transition animations. (Cnattingius, 2021; Kim et al., 2022) demonstrated the differences in perceived time between different animation effects. At the same time, the design guidelines (Human Interface Guidelines - Human Interface Guidelines - Design - Apple Developer, 2019; Material Design, 2019; Mate- rial Design, 2022; Carbon Design System, 2023), in Apple, Google, as well as IBM designs have not effectively discussed split-screen animated transitions.
Animated Transition Effect An animated movement consists of speed, space, and patterns. First, the speed consists of a duration and a easing function. The duration is the time when the object starts moving and stops. Google’s latest Material3 design (Material Design, 2022) guide offers a wider range of motion design recommendations, with suggestions for different durations and easing functions based on diffe- rent scenarios, motion effects of elements and screen sizes. It is recommended that some emphasis on the duration of the motion can be designed at 500- 700ms, while it is recommended that the admission motion be designed using the curve parameters of (0.05, 0.7, 0.1, 1). The second aspect is space, which refers to the location of an element. The direction of the movement is deter- mined by its initial position. The position of the element and the movement pattern in an animation can be combined in various types of animation transi- tions. The elements of speed, space, and pattern have a significant impact on user satisfaction, emotional quality, and efficiency. In recent years, various transition types have been used in Web and mobile applications by adding
Analyzing the Effects of Split-Screen Animated Transition on User Experience 245
deliberate delays to consider the choreography of animated transition effe- cts. However, there has been no research on the choreography of animated transition effects between two applications with split-screen animation.
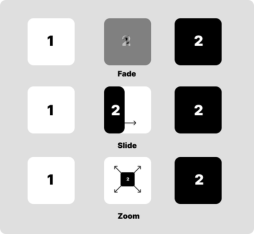
Three Basic Patterns Animated transitions usually achieve the animation by changing different parameters of the final page. The common three transition effects are fade, slide, and zoom.
This study tested animation transitions using three parameters: opacity, position, and size, corresponding to basic animation modes of fade, slide, and zoom. The Fade transition displays the detail page by changing the opacity of the detail card, the Slide transition changes the position from the adjacent edge to the target position, and the Zoom changes the size of the detail card from 0 to covering the full screen size (as shown in Figure 1).
Figure 1: Visualization of the three animation transforms.
The purpose of this study is to explore the impact of split-screen animation transitions on user satisfaction on IVIS touch screens. The study investigates whether the type of transition and the interval between screen transitions affects user experience. Additionally, we aim to discover at what point users start reporting discomfort within animation transition intervals less than 1.0 seconds, and whether the animation transition effect after the delay can change the perception of satisfaction. Thus, our goal is to derive guidelines for appropriate split-screen transition effects and levels of delay that positively impact satisfaction. We hope that our results will contribute to improving user satisfaction by addressing all types of short delays (e.g., processing or artificial delays) and by using appropriate split-screen transition effects in IVIS.
METHOD
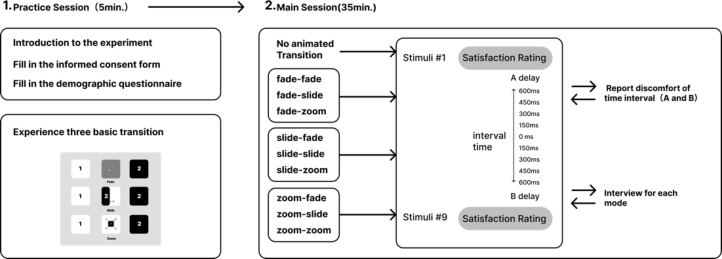
Experimental Design In our experiment design, we used 10 split-screen animated transition patterns and 9 interval times. The 10 split-screen animated transition patterns are basic animated transition patterns combined into transition patterns (3X3) and a no-animation control is used as the baseline. The 9 interval times refer to the order in which two applications appear (as shown in Table 1). The
interval time was manipulated from 0 to 600 ms in five increments of 150 ms for each A and B.
The animation curve and duration were controlled variables. Based on the latest animation design guidelines (Material 3) from Google, considering that the transition belongs to the type of entering the screen, the animation curve adopted Emphasized Decelerate easing (0.05, 0.7, 0.1, 1), and the animation duration was chosen based on the screen size. For a 15.6-inch IVIS screen, the animation duration was selected as 600ms.
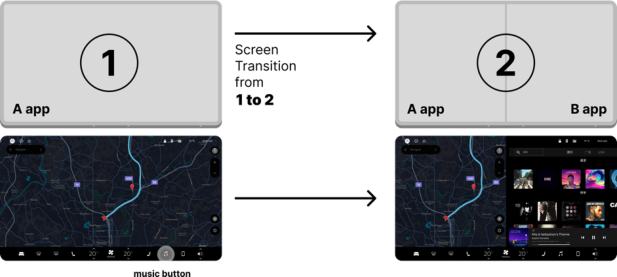
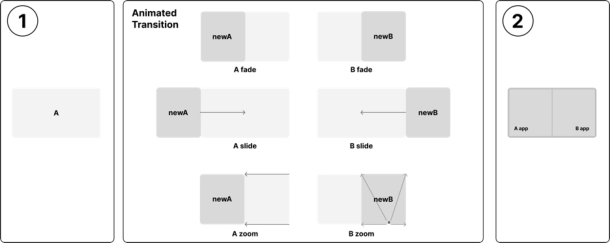
Most IVIS currently use maps as their desktop and the most common in- car applications are music and air conditioning. As shown in Figure 2, we have designed the visual stimulation of the split-screen transition effect from (1) to (2). Based on the current design of in-car systems, we adopt A appli- cation as a map application and B application as a music application in our experiment. At (1) state, the A app (map application) is displayed full screen, while at (2) state, the A app (map) and B app (music) are displayed in split screen. Due to the display differences of the initial state of A and B applica- tions, the experiment summarizes the display state of both using three basic animation effects, as shown in Figure 3.
Participants 31 participants aged 21–39 years old (mean age = 23.61, SD = 1.86) parti- cipated in our experiment. There were 16 male and 15 female participants. The participants had normal visual or corrected-to-normal vision and were able to recognize motion at the millisecond level. As our task was not related to the examination of driving performance, not all participants had a dri- ver’s license. However, they had at least 6 years of experience with mobile and web-based applications, as our task was related to the screen animation
Figure 2: Animated transition stimuli.
Analyzing the Effects of Split-Screen Animated Transition on User Experience 247
Figure 3: Animated transition using three basic dynamic effects to A and B.
transition experience. Participants received a reward of 30 RMB each, and each participant lasted approximately 40 minutes.
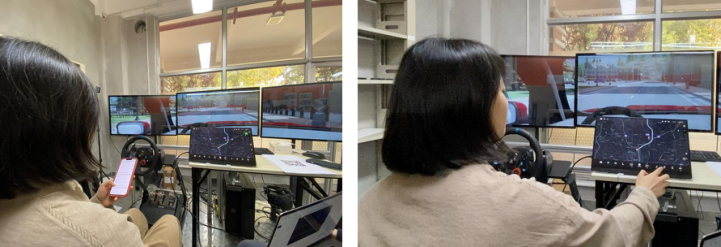
Apparatus and Materials The experiment was conducted in a laboratory using a high-fidelity simulator that included a steering wheel, pedals, seat, display screen, tablet computer, and vehicle model (Figure 4). The steering wheel and pedals were of the Logi- tech G29 model. Three connected display screens provided a 135-degree view of the driving environment. To the right of the front view was an expandable touch display (EHOMEWEI, 15.6-inch, 4K OLED Display) used to depict the 15.6-inch (3840 × 2160 pixels) IVIS screen. The IVIS screen prototype was created using FIGMA v116.5.18 and PROTOPIE v7.4.0 software.
Experimental Tasks In this experiment, participants are asked to perform a task while the vehicle is temporarily stopped on the side of the road and the IVIS system is being manipulated. The task requires the participants to press the music button to initiate a transition from screen (1) to (2), as shown in Figure 2. This transi- tion produces an animated transition effect consisting of the transition type and interval time. Participants are then asked to evaluate each stimulation
using an online questionnaire rating. They can only click on the music but- ton in the lower right corner of the screen. Participants are informed that they can repeat the experience multiple times until they determine their question- naire rating, with satisfaction being measured using the Likert seven-point scale, ranging from 1 “Very dissatisfied” to 7 “Very satisfied”.
Procedure The participants are introduced to the experiment and asked to fill out infor- med consent and demographic questionnaire. They will experience three basic animation modes and the Practice Session will take approximately 3–5 minutes, and questions from the participants will be answered. In the Main Session, the animation modes will be randomly presented at different inte- rval times and the participants will score each experience through an online questionnaire using a 7-point Likert scale (from 1 “Very Dissatisfied” to 7 “Very Satisfied”). After experiencing all interval times, an interview will be conducted for each animation mode combination to identify the point where discomfort begins. Participants will be given short breaks whenever they request it. The entire experiment for each participant lasts for 40 minutes.
RESULTS
The results of repeated ANOVA show that the Pattern combination F(8) = 3.621, P<0.05 and the interval time F(3.677) = 204.698, P<0.05 have significant effects on satisfaction (Table 2). The most satisfying pattern com- bination was AzoomBzoom (M = 4.47, SD = 0.165), with no significant difference with AzoomBfade (M = 4.272, SD = 0.165) and AzoomBslide (M = 4.409, SD = 0.165), but significant differences with all other pat- tern combinations. These three combinations all have the A mode as the zoom mode. According to the satisfaction ranking, others are: AfadeBslide (M = 3.943, SD = 0.165), AfadeBzoom (M = 3.817, SD = 0.165), Asli- deBslide (M = 3.806, SD = 0.165), AslideBzoom (M = 3.792, SD = 0.165), AfadeBfade (M = 3.753, SD = 0.165), AslideBfade (M = 3.577, SD = 0.165), and they have no significant differences between them. At the same time, the non-animation mode (M = 2.423, SD = 0.165) has significant differences
Analyzing the Effects of Split-Screen Animated Transition on User Experience 249
Table 2. Descriptive results for split-screen animated transition effects.
Table available in the original PDF paper.
Variable Factors df F P Significance satisfaction Pattern combination 9 12.301 0.000 Y Interval time 3.765 224.898 0.000 Y PC X IT 33.885 3.674 0.000 Y
F value of Greenhouse-Geisser in test of Within-Subjects effects was used.
with all other animation combinations, proving that animation can effectively enhance user experience.
Pattern Combination Based on the results of a significance test analysis between the A and B motion effect patterns, only the A pattern showed a significant effect (F(2) = 13.206, P < 0.05), while the B pattern and the interaction between A and B had no significant effect on satisfaction. This confirms that the three best motion effect patterns for satisfaction are all A as the zoom effect. This conclusion may be due to the difference in the application of A and B: A is applied when the state (1) is in full-screen display and B is not displayed. It can be inferred that the transition effect of a full-screen display application should be given priority in transition effect design.
According to the results of multiple comparisons, A’s zoom (M = 4.384, SD = 0.097) has a significant difference from the other two patterns (Table 3). This result can also be explained by Google’s motion design guide, which states that zoom is highly effective in creating relationships between elements. Slide implies an equal and reciprocal relationship, which may not accurately reflect the hierarchical structure of the screen. Compared to the other two motion effects, fade may cause jump cuts, which should generally be avoided as a default setting as they can be disorienting. Instantly transitioning from one screen to the next offers no clues to help a user orient themselves.
Interval Time The interval time also has a significant impact on satisfaction. Overall, the most satisfactory interval times were synchronous (M = 4.848, SD = 0.75) and B delay 150ms (M = 4.803, SD = 0.68) with no significant differe- nce. Adelay150ms (M = 4.848, SD = 0.75) and Bdelay300ms (M = 4.848, SD = 0.75) showed no significant difference. In addition, there were signifi- cant differences between the interval time and other interval times.
Table 3. Descriptive results for split-screen animated transition effects.
Table available in the original PDF paper.
Variable Factors df F P Significance satisfaction A’s pattern 2 13.206 0.000 Y B’s Pattern 2 1.069 0.345 N A’Pattern*B’Pattern 4 0.105 0.981 N
F value of Greenhouse-Geisser in test of Within-Subjects effects was used.
The results of the time interval discomfort analysis show that different combination patterns have significant differences in the delay discomfort of A and B. There is a significant difference in the delay discomfort between A (M = 300.00, SD = 139.642) and B (M = 304.84, SD = 152.400) in the no-animation condition, which indicates that the animation significantly improves the tolerance of the time interval. When A is delayed, the longest discomfort time is AfadeBslide (M = 450, SD = 150), and the shortest is AzoomBfade (M = 362.90, SD = 192.773), and there is a significant differe- nce between the two, while there is no significant difference in discomfort for other time intervals. When B is delayed, there is a significant difference betw- een AfadeBfade (M = 396.77, SD = 125.788) and AzoomBfade (M = 474.19, SD = 1169.249), and between AfadeBslide (M = 454.84, SD = 125.403) and AslideBslide (M = 372.58, SD = 168.245).
The results of the paired T-test show that there is a significant difference between A and B in terms of delay discomfort (p = 0.000<0.05). B’s delay discomfort is longer (A delay discomfort (M = 404.30, SD = 162.211), B delay discomfort (M = 431.18, SD = 154.939)). This may be due to two reasons: 1) Based on the visual habit of reading from left to right, when B experiences a delay, it will be visually more coherent; 2) Some users may consider B to be a newly loaded interface, allowing for a slight delay in B (p09).
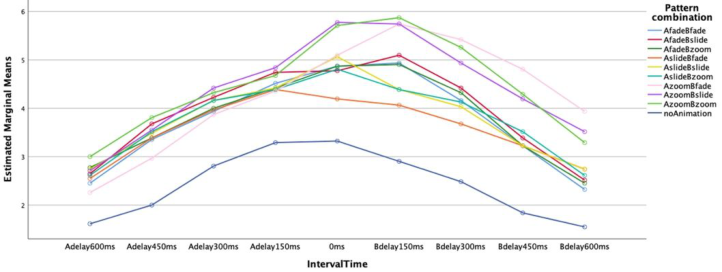
Pattern Combination X Interval Time We found an interaction effect between pattern combination and the interval time F(33.885) = 3.674, p = 0.000 < 0.05. Different pattern combina- tions have varying effects on the satisfaction levels when changing the interval time. (Figure 6) The optimal interval time for each combination pat- tern is inconsistent. AslideBslide (M = 5.065, SD = 0.236), AslideBzoom (M = 4.806, SD = 0.236), AzoomBslide (M = 5.774, SD = 0.236), and noAnimation (M = 3.323, SD = 0.236) performed best at synchronous interval times, with some users perceiving that zoom and slide are more appropriate when both are used in combination. AslideBfade (M = 4.387,
Figure 6: Satisfaction distribution of pattern combination in time interval.
Analyzing the Effects of Split-Screen Animated Transition on User Experience 251
Table 4. Split-screen animated transition guideline for 15.6-in IVIS screen.
Table available in the original PDF paper.
Best Interval time(ms) Time interval discomfort (ms)
SD = 0.240) performed best at Adelay150ms, but there was no signifi- cant difference with synchrony (M = 4.194, SD = 0.238) and Bdelay150ms (M = 4.065, SD = 0.217). AfadeBfade (M = 4.935, SD = 0.214), AfadeBslide (M = 5.097, SD = 0.214), AfadeBzoom (M = 4.903, SD = 0.214), AzoomB- fade (M = 5.742, SD = 0.214), and AzoomBzoom (M = 5.871, SD = 0.214) performed best with Bdelay150ms. When the animation of A is zoom, a delay of A would cause new content B to partially overlap with the old position, which would be perceived as stuttering by some users.
CONCLUSION
In this study, an empirical experiment was conducted to test the effect of split-screen animation transitions (A pattern, B pattern, and inter-stimulus interval) on satisfaction in IVIS. Nine different stimuli were manipulated and 31 participants completed a questionnaire and interview regarding satisfaction using a 7-point Likert scale.
Significant differences in satisfaction were found based on split-screen ani- mation transitions, although the magnitude of significance varied depending on the transition effect. When the A animation effect was zoom, a better user experience was obtained, and we therefore suggest that the zoom animation effect be used for A. Finally, we found that the millisecond-level A and B inter-stimulus intervals had a significant impact on satisfaction. Additionally, through post-interviews, it was confirmed that the inter-stimulus time for negative emotion expression would vary according to certain transition effe- cts. Therefore, based on Figure 6, an animation effect score of 5 or higher was selected as a design guide recommendation(Table 3).
The limitations of this study are as follows: (1) repetitive exposure of the animation may make the animation effect too familiar to the user; (2) par- ticipants were tested in a laboratory environment, which may differ from the real-life environment; (3) consideration was given to a single testing scenario, while in the real environment, we may experience multiple combi- nations of user interface applications to form split-screen scenarios. Despite these limitations, this study clearly demonstrates meaningful results: diffe- rent animation combinations in split-screen animation provide different user experiences and user understanding, and split-screen animation effects appe- aring at the appropriate delay time contribute to increased satisfaction. We
believe this study can provide design guidance in split-screen animation and improve current animation design guidelines.
ACKNOWLEDGMENT
This research is supported by the Philosophy and Social Sciences Fundation of Hunan, China (No. 22YBA038).
REFERENCES
Avila-Munoz, R., Clemente-Mediavilla, J. and Perez-Luque, M. J. (2021) ‘Communicative Functions in Human-Computer Interface Design: A Taxonomy of Functional Animation’, p. 28. Bederson, B. B. and Boltman, A. (1999) ‘Does animation help users build men-
tal maps of spatial information?’, in Proceedings 1999 IEEE Symposium on Information Visualization (InfoVis’99). Proceedings 1999 IEEE Symposium on Information Visualization (InfoVis’99), pp. 28–35. Available at: https://doi.org/ 10.1109/INFVIS.1999.801854. Carbon Design System (2023). Available at: https://www.carbondesignsystem.com (Accessed: 1 February 2023). Carmi, R. and Itti, L. (2006) ‘Visual causes versus correlates of attentional selection
in dynamic scenes’, Vision Research, 46(26), pp. 4333–4345. Available at: https: //doi.org/10.1016/j.visres.2006.08.019. Chang, B.-W. and Ungar, D. (1993) ‘Animation: from cartoons to the user interface’, in Proceedings of the 6th annual ACM symposium on User interface software and technology. PRS93: Parallel Rendering Symposium, Atlanta Georgia USA: ACM, pp. 45–55. Available at: https://doi.org/10.1145/168642.168647. Cnattingius, L. (2021) ‘Analyzing the effect of animated transitions on the user
experience of mobile interfaces’. Heer, J. and Robertson, G. (2007) ‘Animated Transitions in Statistical Data Graphics’, IEEE Transactions on Visualization and Computer Graphics, 13(6), pp. 1240–1247. Available at: https://doi.org/10.1109/TVCG.2007.70539. Human Interface Guidelines - Human Interface Guidelines - Design - Apple Deve-
loper (2019). Available at: https://developer.apple.com/design/human-interface-g uidelines/guidelines/overview/ (Accessed: 1 February 2023). Kim, G. Y. et al. (2022) ‘Effects of Animated Screen Transition in In-Vehicle Infotainment Systems: Perceived Duration, Delay Time, and Satisfaction’, International Journal of Human–Computer Interaction, 0(0), pp. 1–14. Available at: https: //doi.org/10.1080/10447318.2022.2041886. Kim, M. J. et al. (2020) ‘How Motion Graphics Affect Emotional Quality: In the
Context of an In-Vehicle Information System’, in A. Marcus and E. Rosenzweig (eds) Design, User Experience, and Usability. Interaction Design. Cham: Sprin- ger International Publishing (Lecture Notes in Computer Science), pp. 491–500. Available at: https://doi.org/10.1007/978-3-030-49713-2_34. Ma, J., Chen, C.-C. and Lin, Y.-C. (2018) ‘Emotional and Cognitive Assessment of Use of Functional Animation’, p. 5. Material Design (2019). Available at: https://m2.material.io/ (Accessed: 1 February
2023). Material Design (2022). Available at: https://m3.material.io/ (Accessed: 16 January 2023).
Analyzing the Effects of Split-Screen Animated Transition on User Experience 253
Merz, B., Tuch, A. N. and Opwis, K. (2016) ‘Perceived User Experience of Animated Transitions in Mobile User Interfaces’, in Proceedings of the 2016 CHI Confe- rence Extended Abstracts on Human Factors in Computing Systems. New York, NY, USA: Association for Computing Machinery (CHI EA ‘16), pp. 3152–3158. Available at: https://doi.org/10.1145/2851581.2892489. Pratt, J. et al. (2010) ‘It’s Alive!: Animate Motion Captures Visual Attention’, Psych-
ological Science, 21(11), pp. 1724–1730. Available at: https://doi.org/10.1177/ 0956797610387440. Tesla (2023). Available at: https://www.tesla.com/ (Accessed: 1 February 2023). Theeuwes, J. (1991) ‘Exogenous and endogenous control of attention: The effect of visual onsets and offsets’, Perception & Psychophysics, 49(1), pp. 83–90. Available at: https://doi.org/10.3758/BF03211619. Tversky, B., Morrison, J. B. and Betrancourt, M. (2002) ‘Animation: can it facilitate?’,
International Journal of Human-Computer Studies, 57(4), pp. 247–262. Available at: https://doi.org/10.1006/ijhc.2002.1017.
LISTED IN THE AHFE DIGITAL BOOKSTORE CATALOGUE
Explore the complete digital volume
Ergonomics In Design
Read this individual research paper free through the original publisher, or explore the full digital proceedings book.
ISBN 978-1-958651-53-7
Explore this ISBN in the AHFE Bookstore ↗Listed in the July 2026 bookstore catalogue; search by ISBN to confirm current availability · Digital book purchase optional