Li Yujia, Xiaojun Liu (2023). Evaluation of The Impact of Visual Decoration on The Memorable Effect in Big Data Visualization - The Example of Bar Chart. In: Human Factors and Systems Interaction. AHFE Open Access, vol. 84, pp. 37–44. https://doi.org/10.54941/ahfe1003588
In recent years, data visualization has been applied to various scenes, and the memory of data visualization has received widespread attention. Some researchers have studied this. However, the effect of visual decoration is polarized in the research community. Some researchers believe that visual decoration can improve memory effect, while others believe that visual decoration can interfere with memory. This paper takes the bar chart as an example to further evaluate the memory effect of visual decoration in visualization, and puts forward four assumptions: ① the visualization using visual decoration has better memory; ② The position of visual decoration will affect the memory effect; ③ The colour of visual decoration will affect the memory effect; ④ The visual position will affect the memory effect under the same visual decoration. The results show that assumptions 1, 2, 3 and 4 are valid, which proves that visual decoration can improve the memory of visualization, and the location, colour and type of visual decoration will affect the memory of visualization.
Many research experts in the field of data visualization believe that adding visual decoration to the visual design will disturb the user’s attention, reduce the readability and memory of visualization, and formulate the design pri- nciples of visualization must be concise and clear to reduce the generation of visual interference elements. But in practical applications, designers will add visual decoration to visualization, and this trend has been rising in recent years. Some researchers have studied visualization with visual decoration. Bateman (Bateman et al., 2010) carried out an experiment on the effect of decoration on visual memory. By comparing the interpretation accuracy and long-term memory of modified charts and ordinary charts, it is found that modified charts have better memory. But the visual decoration he used in the experiment was exaggerated, and he used a large number of human-readable charts. Borkin (Borkin et al., 2013) has proved through experiments that the visualization including human recognizable images is more memorable
than ordinary data visualization. Kulla-Mader (Kulla-Mader, 2007) resea- rch shows that a small amount of visual decoration will not interfere with the understanding of information. Hockley (Hockley, 2009) research shows that the use of visual decoration affects memory. The research community has not conducted in-depth research on how visual decoration affects human memory. This paper has conducted a comprehensive evaluation of how visual decoration affects the effect of human memory in the way of total score, first from whether visual decoration will improve the memory of visualization, and then from whether the location, colour and type of visual decoration will improve the memory of visualization. Finally, the research results show that visual decoration can improve the memory of visualization.
BACKGROUND AND RELATED WORK (1) Data visualization Big data can provide more opportunities for people to understand the world and society, but it also challenges people to understand such huge and com- plex data. Human beings can obtain information from the outside world by visual system, auditory system, tactile system, etc. 80% of the informa- tion comes from the visual system. When big data is presented in intuitive graphics, human beings can quickly obtain the information behind the data through the visual system. Stuart K. Card, Jock D. Mackinlay and George G. Robertson put forward the concept of data visualization in 1989. As an inter- disciplinary discipline that has been studied for more than 20 years, it plays a huge role in data information presentation. Data visualization refers to filte- ring and filtering the information, displaying the information in a visual form through the corresponding computer algorithm, and providing a humanized human-computer interaction mode, and finally forming a graphical interface. (2) Visual cognition and memory Human’s thinking and analysis of complex data is not streamlined, but a more complex process, which includes different steps, as well as analysis and deliberation through repeated circulation of operation steps and other activities. Visualization should fit the cognitive psychology and behaviour habits of the information audience (Norman, 1988). Experiments on visual memory show that the memory of images is related to the intrinsic pro- perties of images, including the scenes and specific graphics displayed by images. Konkle (Konkle et al., 2010) have confirmed that when human visual images are presented in visualization, such as images with strong semantic meaning and strange images, visualization will be more memorable. In the field of psychology, there is a dual-process model of memory, including a fast “stimulus-driven” process and a slow “memory-driven” process. When some images are presented in the stimulus material, the memory process can be driven to start quickly. (3) Visual decoration in visualization The research on visual decoration in the field of visualization can be divided into two categories: one category supports adding visual decoration in visu- alization, which can enrich visualization and improve its memory; The other type does not support adding visual decoration to visualization, advocates
Evaluation of the Impact of Visual Decoration on the Memorable Effect 39
a minimalist design style, and believes that visual decoration will interfere with users’ understanding of visualization. On the other hand, Tufte (Tufte et al., 1983), in order to improve the richness of visualization, designers still add visual decoration to visualization. The visualization with visual decora- tion can arouse users’ interest more than ordinary visualization, and improve understanding to a certain extent. However, the research community has not conducted in-depth research on the characteristics of visual decoration, such as the location, colour and other characteristics of visual decoration. On the basis of previous studies, this paper has carried out in-depth research on the characteristics of visual decoration, and comprehensively analysed how visual decoration affects visual memory.
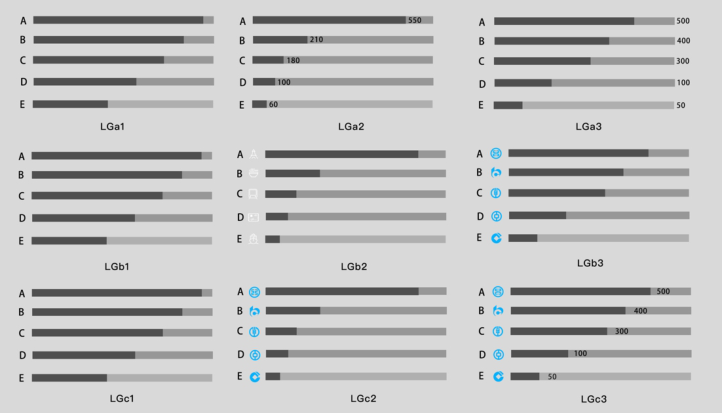
EXPERIMENTAL OVERVIEW This experiment mainly studies the impact of visual decoration on visual memory. The image design of the experiment is mainly divided into two parts: visualization with visual decoration and visualization without visual decoration. The design with visual decoration is divided into two catego- ries: numerical decoration and icon decoration. A total of 9 experimental target images are divided into three groups: LGa represents the numerical decoration group (LGa1 represents no numerical decoration, LGa2 repre- sents the middle of the numerical position, and LGa3 represents the end of the numerical decoration), LGb represents the icon decoration group (LGb1 represents no icon decoration, LGb2 represents colourless icon deco- ration, and LGb3 represents coloured icon decoration), LGc represents icon decoration and numerical decoration group (LGc1 represents no visual deco- ration, LGc2 represents coloured visual decoration, LGc3 represents icon decoration and numerical decoration), as shown in Figure 1. The bar chart
Figure 1: The text overlay image with 1 line spacing.
40 Li and Liu
used in the experiment is not the “field” version directly crawled from the network. These bar charts are usually bright in colour, different in size, and inconsistent in visual decoration, which will cause many interference vari- ables in the experiment. In order to control the influence of interference variables generated in the experiment, each image is designed by the visual designer by extracting the information of the real world. The size of each image is 1920 * 1080, the font is gray, the overall experimental interface presents a simple and unified style, and all chart areas are at the center of the image.
SUBJECTS A total of 15 subjects (6 women and 9 men) were recruited to participate in the experiment, and they were given material incentives after the experiment. The subjects were all graduate students from Southeast University, who majo- red in mechanics, design, psychology and many other related majors. The age range is 24–30 years old. All subjects have normal vision or corrected to normal. Before the experiment, the subjects were not told the purpose of the experiment. Visual stimuli are designed using graphic design software such as Adobe Photoshop. Each visual stimulus is saved as a static image, and a pro- gram written in JavaScript is used to present the stimulus. Using 15.6-inch, 1920 * 1080 resolution, 64-bit RGB colour mode display, Intel6-core PC, 2.21GHz, 8GB RAM and Windows10 system running experiments. Adjust the display to a certain brightness and contrast, and use the mouse to interact. The experiment is carried out in a quiet environment. During the experiment, the subjects need to stay focused and be as little disturbed by the outside world as possible.
In view of the study of previous literature, the experiment proposed four hypotheses:
1. The visualization with visual decoration has better memory; 2. The position of visual decoration will affect the memory effect; 3. The colour of visual decoration will affect the memory effect; 4. The type of visual decoration will affect the memory effect.
PROCESS This experiment explores the effect of visual decoration on visual memory, regardless of the efficiency and accuracy of visual information transmission. The experiment was divided into three groups. The experimental task of each group was divided into two stages: recognition and coding. In the experiment, a total of 9 target visualizations were designed. The target visualization is used to measure the impact of visual modification on the memory ability. In the coding stage, 9 target visualizations are presented for 9 seconds each, and the presentation time of 9 seconds ensures that the subjects have enough time to remember all the elements in the scene, and the presentation order is random. There is a 10-second waiting time before the formal start of the experiment. The researcher explained the experiment rules to the subjects.
Evaluation of the Impact of Visual Decoration on the Memorable Effect 41
In the recognition stage, the interference image of the target image is added. Each target image has a interference image. The data amount of the interfe- rence image is inconsistent with the target image, indicating that the content remains within the same range. In the recognition stage, there are 9 visua- lizations in total, each visualization is presented for 2 seconds, the order of presentation is random, and each image only appears once. When the sub- ject sees the target image appearing in the coding stage, press the select key, and the background will judge whether the selection is correct or not, and record the response time of the subject, but the subject will not be informed to avoid interference with the experiment. After the experiment, the response time from the time the subjects saw the target image to the time they pressed the selection key and the selection accuracy of each visualization task were recorded.
EXPERIMENTAL RESULTS Hypothesis 1: Visualization with visual decoration has better memory
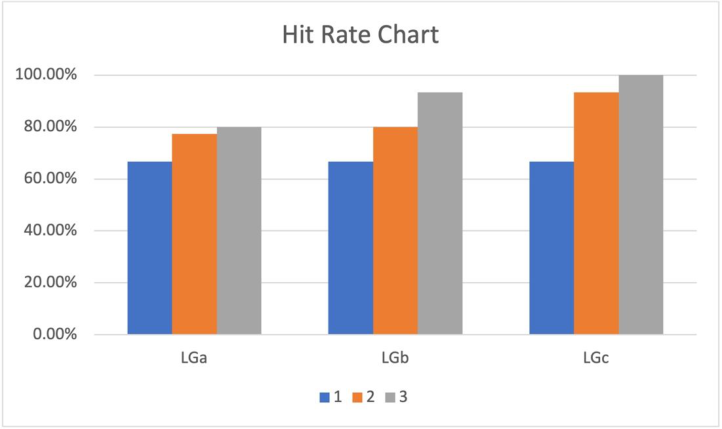
Under the assumption that the visualization using visual decoration has better memory, the accuracy of the target visualization is compared. LGa1 (CR = 66.7%), LGa2 (CR = 77.30%), LGa3 (CR = 80.00%), LGb1 (CR = 66.7%), LGb2 (CR = 80.00%), LGb3 (CR = 93.30%), LGc1 (CR = 66.70%), LGc2 (CR = 93.30%) and LGc3 (CR = 100.00%) in the LGa group, LGb1 (CR = 80.00%), LGb2 (CR = 80.00%) and LGc3 (CR = 93.30%) in the LGc group can be found that the accuracy of the non-icon group is higher than that of the white icon group and the coloured icon group Low, It shows that the visualization of the group with- out icon is less memorable, as shown in Figure 2 and Table 1; Comparing the average response time, LGa1 (M = 1451.00), LGa2 (M = 997.92), LGa3 (M = 824.58), LGb1 (M = 1627.00), LGb2 (M = 1009.86),
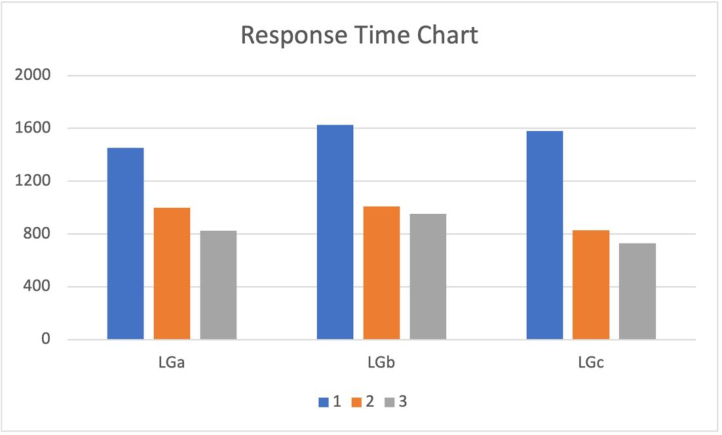
LGb3 (M = 951.50), LGc1 (M = 1580.82), LGc2 (M = 828.17), LGc3 (M = 729.00) in LGa group, LGb1 (M = 1627.00), LGb2 (M = 1009.86), LGb3 (M = 951.50) in LGc group, we can find that the average response time of the group without icon is significantly higher than that of the white icon group and the coloured icon group, indicating that the subjects are visualized for the group without icon, as shown in Figure 3 and Table 2. The response time of is slower. The experimental results show that the visualization of icon group is better reflected from the hit rate and response time, that is to say, adding visual decoration to the visualization can improve the visual memory effect.
Hypothesis 2: The position of visual decoration will affect the memory effect The experimental results have confirmed hypothesis 1, that is, visuali- zation using visual decoration has better memory. In the hypothesis that
Figure 3: Response time chart.Table 2. Three groups of visual response time.
Evaluation of the Impact of Visual Decoration on the Memorable Effect 43
the position of visual decoration will affect the memory effect, LGb2 and LGb3 are mainly analysed in the LGb group. First, the accuracy of compa- rison is compared with LGa2 (CR = 77.30%) and LGa3 (CR = 80.00%) in Figure 2 and Table 1. The results show that the task accuracy of visua- lization with numerical decoration in the middle of the bar chart is higher than that with numerical decoration at the end of the bar chart. Then, the response time of the two groups is compared with LGa2 (M = 997.92) and LGa3 (M = 824.58) in Figure 3 and Table 2. The results show that the task response time of visualization with numerical decoration in the middle of the bar graph is faster than that with numerical decoration at the end of the bar graph. The comparison results show that the location of numerical decora- tion will affect the hit rate and response time of visualization, that is, the location of visual decoration will affect the memory of visualization.
Hypothesis 3: The colour of visual decoration will affect the memory effect In the hypothesis that the colour of visual decoration will affect the memory effect, LGa2 and LGa3 are mainly analysed in the LGa group. First, the accuracy of comparison is compared with LGb2 (CR = 80.00%) and LGb3 (CR = 93.30%) in Figure 2 and Table 1. The results show that the task accuracy of visualization with colourless icon decoration is higher than that with coloured icon decoration, and then the response time of the two groups is compared with LGc2 (M = 1009.86) and LGc3 (M = 951.50%) in Figure 3 and Table 2. The results show that the task response time of visuali- zation with colourless icon decoration is faster than that with coloured icon decoration. The comparison results show that the colour of numerical deco- ration will affect the hit rate and response time of visualization, that is, the colour of visual decoration will affect the memory of visualization.
Hypothesis 4: The type of visual decoration will affect the memory effect In the hypothesis that the type of visual decoration will affect the memory effect, LGc2 and LGc3 are mainly analysed in the LGc group. First, the correct rate of comparison is compared with LGc2 (CR = 93.30%) and LGc3 (CR = 100%) in Figure 2 and Table 1. The result shows that only the visualization of icon decoration has higher task accuracy than that of icon and numerical decoration. Then, the response time of the two groups is compared with LGc2 (M = 828.17) and LGc3 (M = 729.00) in Figure 3 and Table 2. The results show that the task response time of visualization with icon decoration is faster than that with icon and numerical decoration. The comparison results show that the type of numerical decoration will affect the hit rate and response time of visualization, that is, the type of visual decoration will affect the memory of visualization.
DISCUSSION OF RESULTS With the large-scale application of visual decoration in visualization, rese- archers have different opinions on its role. This paper proves that visual decoration can improve the memory of visualization to a certain extent. Through the analysis of task performance and response time, it is found that
44 Li and Liu
the task hit rate and response time of visualization with visual decoration in three groups of visualization (LGa, LGb, LGc) are better than those without visual decoration. For the four hypotheses proposed: x the visualization with visual decoration is better memorable; y The position of visual decoration will affect the memory effect; z The colour of visual decoration will affect the memory effect; { The type of visual decoration will affect the memory effect. The experimental results show that the four hypotheses are valid. Through the verification of assumptions, this paper will give design suggestions for the design of visual decoration in data visualization. Designers need to cho- ose the type of visual decoration in a more visual form when designing data visualization. For the selection of visual decoration colour, the overall style should be considered to keep the interface consistent. For the location, the appropriate location should be selected according to the actual situation to avoid the sense of separation of the whole interface.
CONCLUSION
This paper takes the bar chart as an example to evaluate the impact of visual decoration on visual memory effect, and comprehensively evaluates the posi- tion, colour and type of visual decoration by using experimental methods. The results show that visual decoration can improve the memory of visu- alization. The task hit rate and response time of visualization with visual decoration are significantly higher than those without visual decoration. Different colours and types can also improve the memory of visualization to a certain extent. There are still some shortcomings in this paper. The expe- riment is only for visualization such as bar graph, and the colour and type of visual decoration used in the experiment are limited. I hope that it can be improved in future research.
ACKNOWLEDGMENT
This work is supported by the Natural Science Foundation of Jiangsu Province under Grant No. BK20202007.
REFERENCES
Borkin, M, A. et al. (2013). “What Makes a Visualization Memorable?,” in IEEE Transactions on Visualization and Computer Graphics, Volume 19 No. 12. Hockley, W. E. (2009). The picture superiority effect inassociative recognition.
Memory and Cognition 36, pp. 1351–1359. Konkle, T. Brady, T. F. Alvarez, G. A. and Oliva A. (2010)”Conceptual distinctiveness supports detailed visual long-term memory for real-world objects”, J. of Exp. Psychology: General, Volume 139 No. 3. Kulla-Mader, J. (2007). Graphs via Ink: Understanding How theAmount of Non-
data-ink in a Graph Affects Perceptionand Learning. Master’s Thesis, Dept. of Information and Library Science, UNC, 2007. Norman D. A. (1988). The Psychology of Everyday Things. Basic Books, New York. S. Bateman, R. Mandryk, C. Gutwin, A. Genest, D. McDine and C. Brooks. (2010).
“Useful junk?: The effects of visual embellishment on comprehension and memo- rability of charts”, Proc. Conf. Human Factors Comput. Syst., pp. 2573–2582. Tufte, E. R. (1983). The Visual Display of Quantitative Information. Graphics Press.
LISTED IN THE AHFE DIGITAL BOOKSTORE CATALOGUE
Explore the complete digital volume
Human Factors and Systems Interaction
Read this individual research paper free through the original publisher, or explore the full digital proceedings book.
ISBN 978-1-958651-60-5
Explore this ISBN in the AHFE Bookstore ↗Listed in the July 2026 bookstore catalogue; search by ISBN to confirm current availability · Digital book purchase optional