Jennifer Wu, Doina Bein, Jidong Huang, Sudarshan Kurwadkar (2023). ETL and ML Forecasting Modeling Process Automation System. In: Human Factors in Software and Systems Engineering. AHFE Open Access, vol. 94, pp. 104–110. https://doi.org/10.54941/ahfe1003775
Given the importance of online retailers in the market, forecasting sales has become one of the essential market strategic considerations. Modern Machine Learning tools help in forecasting sales for many online retailers. These models need refinement and automatization to increase efficiency and productivity. Suppose an automated function can be applied to capture historical data and execute forecasting models automatically; it will reduce the time and human resources for the company to manage the forecasting system. An automated data processing and forecasting model system offers the marketing department more flexible market sales forecasting. Proposed here is an automated weekly periodic sales forecasting system that integrates: the Extract-Transform-Load (ETL) data processing process and machine learning forecasting model and sends the outcomes as messages. For this study, the data is obtained for an online women's shoe retailer from three data sources (AWS Redshift, AWS S3, and Google Sheets). The system collects the sales data for 120 weeks, then passes it to an ETL process, and runs the machine learning forecasting model to forecast the sales of the retailer's products in the next week. The machine learning model is built using the random forest regressor. The top 25 products with the most popular forecasting results are selected and sent to the owner’s email for further market evaluation. The system is built as a Directed Acyclic Graph (DAG) using Python script on Apache Airflow. To facilitate the management of the system, the authors set up Apache Airflow in a Docker container. The whole process does not require human monitoring and management. If the project is executed on Airflow, it will notify the project owner to inspect the cause of any potential error.
In today’s e-commerce-driven marketplace, preparation for inventory fore- casting is critical. With proper inventory planning, online retailers can avoid revenue loss due to a shortage of goods or storage and removal problems caused by excess inventory (Hsieh, 2019). Inventory planning tools such as
ETL and ML Forecasting Modeling Process Automation System 105
machine learning methods can discover complex patterns and achieve precise forecasts compared to traditional forecasting methods. Accurate foreca- sting facilitates targeted, demand-oriented production planning and control. Nonetheless, implementing machine learning requires domain-specific know- ledge and involves a complex process of building forecast models. Given the challenges in obtaining domain-specific knowledge, it is economically unat- tractive to apply machine learning to underlying industrial problems (Kramer et al., 2022).
Therefore, automating the machine learning process is a crucial prere- quisite to a successful online retailer. In addition, the machine learning forecasting model needs a large amount of data for training. The automated system can also clean and optimize data through the Extract-Transform-Load (ETL) process. It can automate the most repetitive and cumbersome processes that need to be managed, thereby reducing workforce needs. The automated data processing and machine learning forecasting model system can assist businesses in accomplishing this goal. Therefore, this paper aims to use Apa- che Airflow to build an automated data ETL process and machine learning forecasting model system. The system uses Apache Airflow to set up the entire automation process, create the task in a Docker container to facilitate inde- pendent operation, use Python to write the scripts for the automation process, use Pandas and Numpy to establish the ETL process with prepared data, and use the Sklearn random forest regressor method to build machine learning forecasting models.
The data is collected from an online women’s shoe retailer named Top Shoe. The dataset (Wu, 2023) includes about 10,000 rows of sales history records from 2018-02-05 to 2020-10-26. Below we describe five fields of the database used in this paper are:
Date: this field is the purchase date for each transaction.
Color: this field is the product color; it contains 15 types of colors.
Material: this field is the product material; it contains 5 types of materials
Category: this field is the product category; it contains 5 types of categories.
Sale Quantity: this field is the quantity of each transaction.
BACKGROUND
A study conducted by Lingxian (2019) successfully predicted the data of UK online retail activity in the next 20 hours by analyzing the retail activity data- set of the past 10 hours. In this study, Lingxian first used the K-means method to cluster the activity data of a UK online retailer and chose a long short-term memory (LSTM) model to predict future online retail dynamics through the analysis of historical data (Lingxian, 2019). Karmy and Maldonado reported similar results (2019), showing how real-time analysis of business data is cri- tical for decision-makers of an organization to make strategic decisions and stay ahead of competitors. Real-time availability of information and business- critical reports can be achieved through automated ETL processes. Typically, running a data warehouse in an enterprise requires the coordination of many
operations across multiple teams. Also, it requires human intervention, which is prone to errors. Performing all relevant steps in the correct order under the exact conditions can be a challenge. An automated ETL process can help address all of these issues. Furthermore, pre-processing data is a critical step in preparing the data to be loaded into the data warehouse for analysis. Machine learning-based pre-processing can be used to ensure data quality.
(Alsharef, 2022) reviews ML and AutoML solutions for forecasting time series data. They mentioned that the importance of time series analysis has grown over the past decade after generating large amounts of data. It requires powerful time series modeling tools in different applications and disciplines to identify time series forecasting challenges and other techniques to meet the challenge. Time series forecasting is an important discipline of data modeling in which past observations of the same variable are analyzed to predict future time series values. It identifies gaps in previous work and techniques used to solve forecasting time series problems (Alsharef, 2022).
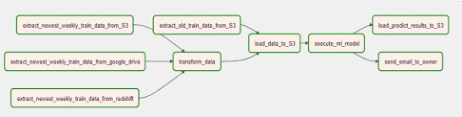
PROPOSED SYSTEM This section will show how the entire system works through the DAG in Apache Airflow and explain how each task is executed. Fig. 1 shows the system DAG established in Apache Airflow. There are nine nodes in this DAG, and each node represents a task, including four for extract, one for transform, one for load, one for executing the machine learning model, and the last one to send the outcomes as a message to the store owner’s email. While running the DAG, the nodes will change color so that users can manage the status of each node according to the color. The most common colors are gray for the node in the queue, light green for the node which is running, dark green for the node that has executed successfully, and red for the node that has failed. When the DAG is initialized, all nodes will be represented in a white state.
Fig. 2 shows the code to set up the DAG for this system. The nodes in square brackets(“[]”) mean they will be executed in parallel, and the signed right shift operator (“>>“) means the direction of data migrating from one node to another node. When the authors designed the DAG flow, they found that a limitation of developing the DAG, namely that a list cannot be connected to another list, which is [NODE, NODE] >> [NODE, NODE] is not allowed in Airflow. This is how to set up the relationship and the order for each node in a Directed Acyclic Graph (DAG). It means that each node has a direction and no loops.
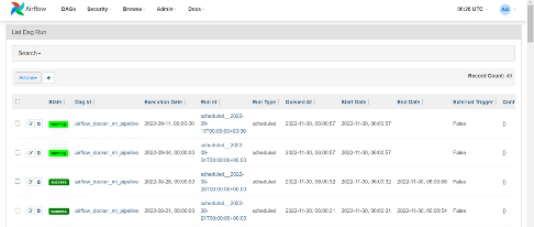
Since the system is designed to execute once a week automatically, as seen from the “schedule” on the green label in the upper right corner of Fig. 3.
Figure 1: The project DAG on Apache Airflow.
ETL and ML Forecasting Modeling Process Automation System 107
Figure 2: System DAG on Apache Airflow.
Figure available in the original PDF paper.
Figure 3: The list records of each schedule DAG in Airflow.
It displays the DAG execution history on Airflow, including DAG status (running/success/failure), dag id, execution date, run id, and operation type (schedule/manually).
To automatically run the DAG every week, we need to set a schedule for the DAG. The way to do it is by using Python with Apache Airflow’s built-in function to write a scheduled script.
This system contains five phases: extract data, transform data, load data, run the ML model, and send results to users. Next, the author will introduce the functions and relationships of these five phases.
Phase 1: Extract refers to the data collected from one or more data sources and loaded into a staging area for temporary storage. The data sources might be files, databases, or data warehouses, and the data type might be text, image, or video (Vassiliadis et al., 2002). The data sources in this system are the AWS S3 bucket, AWS Redshift, and Google Sheets.
The first data source is AWS S3. In this project, the AWS S3 bucket is to store the CSV files. The data in the AWS S3 bucket is the most recent week of sales in Top Shoe online retailers to record the sales history on the Amazon website. The Amazon website is the place that lets the company sell the most products, so there is a lot more data in the AWS S3 bucket as compared to other data sources.
The second data source is AWS Redshift. Given the difference between other data sources, we need to make a SQL query to select the data we need in the database. The data in AWS Redshift is used to record the most recent week’s sales on the company’s website.
The third data source is Google Sheets, in which the data type in this data source is saved as a CSV file. In this system, the data stored in google drive is the most recent weekly sales record in Top Shoe’s physical stores. Physical stores mainly sell the products to the mall’s shops, and the sales quantity is not as large as the other two sales methods. However, it is also a significant data source that we should put into the training dataset.
In data processing, only the first time we run DAG, we need to process the data of the past 120 weeks, and then we only need to process the data of the latest week every time you execute DAG. This action can reduce machine execution time and decrease memory space. After processing the data for the first time, the data will be stored in the AWS S3 bucket to wait for subsequent and latest weekly data to be merged and organized into trainable data.
Phase 2: Transform is a critical step in the ETL process. from the staging area, the original data will be processed and transformed before being stored in the data warehouse. Data is transformed and integrated for its intended analytical use case (Souibgui et al., 2019). There are several standard proces- sing procedures. The first way is the filter, which only retains specific fields or rows. The second way is clean, often appearing in machine learning. It mainly deletes duplicate data, inconsistent data, and Missing values. The third way is to verify the data, which means to find some values that should not exist or the data type does not match as defined. Also, to calculate, translate or sum- marize raw data. This might include changing row and column headings for consistency, converting currencies or other units of measurement, and editing text strings.
We standardize the value of column category, color, and material. The data type of column weeky_sales should be an integer. If there is any missing value in the row, that row will be deleted.
Phase 3: Load is when the data is collected and converted into the correct format. It can be stored in a data lake or warehouse for further use. In this project, the database is stored in the AWS S3 bucket. Since a machine learning forecasting model can directly use this data, it will be transferred from the AWS S3 bucket CSV file to the Pandas dataframe.
Loading the data to the AWS S3 bucket is similar to extracting data from the AWS S3 bucket. To do it, we can call boto3 to connect to the AWS S3 bucket and set up the region, access key, secret access key, and bucket name. The difference is to use the upload_file() function to call to inform the CSV and upload data to be uploaded.
Phase 4: Forecasting ML model to forecast the sales for the next week. The machine learning algorithm is Random Forest Regressor. To build the Random Forest Regressor model, we import ski-learn library. For training, X-set includes the sales date, shoe color, shoe category, and shoe material; Y-set is the sales quantity. After training the model, it will forecast the sales for next week and save the result into a local CSV file for further use. The CSV file will also load to the AWS S3 bucket.
Phase 5: Sent Result is when the system will arrange the forecasted shoes in descending order according to the forecasting sales amount, select the cate- gory, color, material, and forecasting sales of the top 25 most popular shoes and send them to the users’ email.
The authors use the Python function email.mime.text in this step.MIMEText() to connect to the email, fill in the information you want to receive in the receiver People; when the program is executed, it can be sent to the other party’s mailbox. In addition, it can also be sent to multiple people at the same time.
ETL and ML Forecasting Modeling Process Automation System 109
The prediction results are written in a table as an HTML script, which is convenient for readers to read. The order of shoes is sorted from high to low according to the predicted sales volume.
RESULTS AND ANALYSIS We used our proposed system for a store owner when she received the top 25 hot sales forecasting results in her email inbox on 2020-10-05. In the system design, the purpose of the last step is overall to forecast the result from a machine learning forecasting model and package the result as a table format by HTML script. The result table includes the product category, color, material, and product forecast sales quantity. Currently, recipients only set the email address of the store owner, but it is also possible to send mail to multiple recipients. The forecast results for 2020-10-05 and 2020-10-12 are very similar, but there are still some slight differences. For example, the top five best-selling rankings are different between these two weeks, and the fore- casting sales quantity of each pair of shoes is also different. Although the difference between the two results is insignificant, the distance between the two weeks is similar, and external factors (such as climate, festivals) do not influence much. However, the weekly forecasting model is still an indispensa- ble business model for the long-term development of enterprise development tools.
Since the sales data of online retailers change rapidly, if the short-term sales changes can be forecasted in real time based on the latest sales data, the company can adjust inventory storage strategies and update marketing strategies at any time.
Compared with the monthly forecast model, the weekly forecast model can make real-time forecasts to remind the store owner to make business analysis strategies. Therefore, establishing the forecast model can help companies to increase their profits.
CONCLUSION AND FUTURE WORK The automatic forecasting system will become a potential trend in the future. Especially in this paper, the author added the data processing process into the system so that retailers can integrate the latest data quickly and periodically forecast sales to make the relative market strategy rapidly.
The future work involves applying autoML into the automatic system to find the best machine learning method, including additional features to the data set, installing Docker on AWS ECS or other cloud containers, or repla- cing containers from Docker to Kubernetes. These changes will offer more power over their runtime environment, turning Airflow into a more dynamic workflow orchestrator.
ACKNOWLEDGMENT
This material is based upon work supported by the National Science Foun- dation under Grant No. 1832536 for the project, “Advancing Student
Success by Utilizing Relevant Social-Cultural and Academic Experiences for Undergraduate Engineering, Computer Science Students (ASSURE-US).
REFERENCES
Alsharef, A., Aggarwal, K., Garg, S., Kumar, M., Mishra, A. (2022). Review of ML and AutoML Solutions to Forecast Time-Series Data. Archives of Computational Methods in Engineering. 29. 1–15. 10.1007/s11831-022-09765-0. Hsieh, P. H. (2019). A Study of Models for Forecasting E-Commerce Sales During a
Price War in the Medical Product Industry. 10.1007/978-3-030-22335-9_1. Karmy, J. P., Maldonado, S. (2019). Hierarchical time series forecasting via support vector regression in the European travel retail industry. Expert Systems with Applications, 137, 59–73. https://doi.org/10.1016/j.eswa.2019.06.060 Kramer, K, Behn, N., Schmidt, M. (2022). The Potential Of AutoML For Demand
Forecasting. 10.15488/12162. Lingxian, Y., Jiaqing, K., Shihuai, W. (2019). Online retail sales prediction with integrated framework of K-mean and neural network. ICEME 2019: Procee- dings of the 2019 10th International Conference on E-business, Management and Economics. Souibgui, M., Atigui, F., Zammali, S., Cherfi, S., Ben Yahia, S. (2019) Data quality
in ETL process: A preliminary study, Procedia Computer Science, 159:676-687, ISSN 1877-0509, https://doi.org/10.1016/j.procs.2019.09.223. Vassiliadis, P., Simitsis, A., Skiadopoulos, S. (2002). Conceptual modeling for ETL processes. In Proceedings of the 5th ACM international workshop on Data Warehousing and OLAP (DOLAP ‘02). Association for Computing Machinery, New York, NY, USA, 14–21. https://doi.org/10.1145/583890.583893 Wu, J. (2023) https://github.com/Jenniferwyqq/ELT-and-ML-Forecasting-Modelin
g-Process-Automation-System/blob/main/dataset.cs.
LISTED IN THE AHFE DIGITAL BOOKSTORE CATALOGUE
Explore the complete digital volume
Human Factors in Software and Systems Engineering
Read this individual research paper free through the original publisher, or explore the full digital proceedings book.
ISBN 978-1-958651-70-4
Explore this ISBN in the AHFE Bookstore ↗Listed in the July 2026 bookstore catalogue; search by ISBN to confirm current availability · Digital book purchase optional