Lea Berkemeier, Wim Kamphuis, Herman De Vries, Anne-Marie Brouwer, Jan Ubbo Van Baardewijk, Maarten Schadd, Hilbrand Oldenhuis, Ruud Verdaasdonk, Lisette Van Gemert-Pijnen (2023). Towards continuous mental state detection in everyday settings: investigating between-subjects variations in a longitudinal study. In: Neuroergonomics and Cognitive Engineering. AHFE Open Access, vol. 102, pp. 131–140. https://doi.org/10.54941/ahfe1003013
1 The Netherlands Organization for Applied Scientific Research (TNO), Kampweg 55 3769 DE Soesterberg, The Netherlands ↗
2 Research Group Digital Transformation, Hanze University of Applied Sciences Zernikeplein 11,9747 AS Groningen, The Netherlands ↗
3 TechMed Center, Faculty of Science and Technology, University of Twente Drienerlolaan 5, 7522 NB Enschede, The Netherlands ↗
4 Department of Psychology, Health and Technology, Centre for eHealth Research and Wellbeing, University of Twente, Drienerlolaan 5, 7522 NB Enschede, The Netherlands ↗
Maintaining mental health can be quite challenging, especially when exposed to stressful situations. In many cases, mental health problems are recognized too late to effectively intervene and prevent adverse outcomes. Recent advances in the availability and reliability of wearable technologies offer opportunities for continuously monitoring mental states, which may be used to improve a person’s mental health. Previous studies attempting to detect and predict mental states with different modalities have shown only small to moderate effect sizes. This limited success may be due to the large variability between individuals regarding e.g., ways of coping with stress or behavioral patterns associated with positive or negative feelings. A study was set up for the detection of mental states based on longitudinal wearable and contextual sensing, targeted at investigating between-subjects variations in terms of predictors of mental states and variations in how predictors relate to mental states. At the end of March 2022, 16 PhD candidates from the Netherlands started to participate in the study. Over nine months, we collected data in terms of their daily mental states (valence and arousal), continuous physiological data (Oura ring) and smartphone data (AWARE framework including GPS and smartphone usage). From the raw data, we aggregated daily values for each participant in terms of sleep, physical activity, mental states, phone usage and GPS movement. First results (six months into the study at the time of writing) indicate that almost all participants show a large variability in ratings of daily mental states, which is a prerequisite for predictive modeling. Direction, strength and standard deviations of Spearman correlations between valence, arousal and the different variables suggest that several predictors of valence and arousal are more subject dependent than others. In future analyses, we will test and compare different versions of predictive modeling to highlight the potential of wearable technologies for mental state monitoring and the personalized prediction of the development of mental problems.
Maintaining a well-balanced mental health can be quite challenging for employees, especially when they are exposed to stressful or traumatic situ- ations during work. When mental health deteriorates, employees are at risk of developing physical and mental health problems such as cardiovascular diseases (Li et al., 2014), mental disorders (van der Molen et al., 2020) or burnout (Chirico, 2016). There are certain occupations where employees are exposed to especially demanding situations, both physically and mentally. For example, police officers and military service members run a high risk of developing mental health problems due to their exposure to extreme physical and mental demands and possible traumatic situations during work (Collins and Gibbs, 2003). Another at-risk group of employees is PhD candidates. Previous research has shown that one in two PhD students is experiencing psychological distress and that one in three is running the risk of developing a common psychiatric disorder (Levecque et al., 2017). This risk of experi- encing or developing mental complaints may be closely linked to a person’s mental state.
Mental states are a crucial part of one’s mental health, as they shape a person’s way of thinking, feeling and behaving (Gross, Uusberg and Uusberg, 2019). One possible way to define affective experience is with the circumplex model of affect by Russell (1980). In this model, emotions are defined by vale- nce (from pleasant to unpleasant) and arousal (from low to high energy). To which extent these states positively or negatively affect mental health depends on the type, duration, intensity or frequency of the mental states (Gross and Jazaieri, 2014; Gross and Muñoz, 1995). For example, being nervous before a job interview can result in enhanced performance and can be considered as a healthy affect. In contrast, unhealthy affects such as intense nervousness or anxiety can impair performance and lead to an avoidance of similar situ- ations in the future. Previous research has shown that unhealthy affects can be found in 40-75% of mental disorders (Gross and Jazaieri, 2014; Jazaieri, Urry, and Gross, 2013).
By monitoring mental states, it might become possible to determine the point when affect becomes unhealthy and how this can be prevented or treated before it results in mental health deterioration. Monitoring mental states often rely on subjective measurements at sporadic time points (Trull and Ebner-Priemer, 2014). With the current advances in both the availabi- lity and usage of sensor technologies and wearables, it potentially becomes increasingly possible to continually and automatically monitor mental states, which may enable early identification of mental disorders. However, for a proper detection and prediction of mental states, the link between automatic measurements and mental states needs to be clarified.
Certain behavioral patterns are connected to mental states, such as feeling stressed and depressed (Teychenne et al., 2019; Bhugra and Mastrogianni, 2004). For instance, people with depression generally tend to show lower levels of activity duration and intensity (Currier et al., 2020; Mello et al., 2013; Teychenne, Ball, and Salmon, 2008), experience sleep disturbances or disorders (Anderson and Bradley, 2013) or isolate themselves from social
Towards Continuous Mental State Detection in Everyday Settings 133
situations (Bhugra and Mastrogianni, 2004). With wearable technologies and smartphones, it is possible to continuously quantify these behavioral patterns through metrics such as step count, distance traveled, GPS locations, heart rate, heart variability or trends in smartphone usage such as screen time, application usage, call duration or call time (Koinis et al., 2022). Hence, it becomes increasingly possible to unobtrusively monitor changes in these behavioral patterns, such as physical activity, locations, smartphone usage or sleep patterns (Koinis et al., 2022).
Several studies investigated the relation between behavior as measured with wearables and mental health. For instance, it has been shown with wearable devices that people with depression were significantly more seden- tary than the rest of the population (Helgadóttir, Forsell and Ekblom, 2015; Hagströmer, Oja and Sjöström, 2007). Two studies have shown with smart- phone sensors that there was less variability in terms of type and time spent at most-visited locations for people with depression compared to the rest of the population (Saeb et al., 2016; Canzian and Musolesi, 2015). While these and other studies provide first insights into how population-level behavio- ral patterns differ between healthy individuals and those with mental health disorders, little is known about predicting mental health problems in healthy individuals and about individual differences regarding the relation between behavioral patterns and mental well-being.
For a healthy population, it is of particular importance to detect chan- ges or declines at an early stage to prevent severe disorders or outcomes (Wang and Miller, 2019). To do so, it is important to get a detailed and con- textually rich picture of a person’s mental states and mental health, which could be achieved through the combination of several sensors, also called multimodal sensing. Previous research attempting to use multimodal sensing data to detect and predict stress states have only shown limited success with small-to-moderate effects (Booth et al., 2022). This may be due to the use of population-based prediction models (participant-independent) for the dete- ction and prediction of stress states. These models do not take into account the large variability between individuals. Behavioral patterns and physiolo- gical signals, however, can all be impacted by individual differences because each person has an individual network of unique experiences and specific vulnerabilities that can lead to particular problems (Hofmann, 2014). From a clinical perspective, Hofmann (2014, p. 7) concluded that “analyzing such individual, person-specific networks requires methodologies to capture the relevant variables to gather an individual’s thoughts, experiences, and beha- viors in situations with specific triggers”. For example (see Hofmann, 2014), two people may be diagnosed with social anxiety disorder with one person experiencing self-deprecating thoughts and avoiding eye contact in social situ- ations. In contrast, the other person wants to be in control all the time in social situations and experiences a lot of anxiety due to strong physiological symptoms such as heart racing. The question arises whether individual-based models to predict mental states would have a better performance due to the consideration of between-subjects variations. To what extent a behavioral pattern can be connected to a particular mental state and vice versa may
thus largely depend on the individual itself, which does not become visible in population-based models.
In this paper, we describe the study protocol of our longitudinal study and provide preliminary results regarding (individual differences in) predictors of mental states. The overarching goal of our study is to quantify behavioral patterns and their relation with mental states using consumer-available wea- rables, smartphone sensors and an EMA smartphone application. Since we focus on the development of individual models (as opposed to population models), longitudinal data collection was required to get insights into beha- vioral patterns of mental states relevant for one individual and to capture a sufficient number of variability in terms of mental states. The overall aim is to identify behavioral patterns connected to both continuous measures of vale- nce and arousal instead of just unpleasant mental states such as depression or stress. The focus of this paper is on investigating to what extent predictors of mental states vary between subjects. The main research question for this paper is: Which are important predictors of mental states and how do these predi- ctors differ across individuals in terms of their relevance for predicting mental states?
METHODS
Participants A total of 16 PhD candidates currently working in the Netherlands were enrolled in a nine months long study starting at the end of March 2022. Interested applicants were recruited via e-mail. For inclusion into the study, participants had to be interested in the use of wearables and self-monitoring, willing to deliver sufficient data within nine months of data collection, wor- king as a PhD student, experiencing no heart rhythm disorder and have a sufficient level of Dutch proficiency to fill in the questionnaires. Participants were also required to own an Android smartphone due to the compatibility of the AWARE framework (Ferreira, Kostakos and Dey, 2015) with the Android system. Seven (43.75%) of the participants were male, and 9 (56,25%) were female. The age ranged between 24 and 38 years, with a mean age of 30 years (SD = 4.02). At the beginning of the experiment, 2 (12.5%) were in their first year of the PhD trajectory, 6 (37.5%) in their second year, 3 (18.75%) in their third year and 5 (31.25%) in the last year. Participants received a compen- sation of €10 each month for their participation. Additionally, to facilitate participant recruitment and optimize adherence during the participation, par- ticipants who delivered at least 85% of valid data points (days with both subjective and physiological data present) were rewarded with keeping the Oura ring that they used for the data collection.
Outcome: Mental State Assessment At the end of each day, from 5 p.m. until 5 a.m. of the following day, parti- cipants filled in two questions about their mental state during the day in the
Towards Continuous Mental State Detection in Everyday Settings 135
“How am I” Ecological Momentary Assessment (EMA) application develo- ped by TNO. Participants received two reminders/prompts for filling in the mental state questionnaires at self-selected points in time. Participants first rated how pleasant or unpleasant their day was (valence), ranging from 0 (unpleasant) to 100 (pleasant). Secondly, they were asked about how men- tally active or passive they felt during that day (arousal), ranging from 0 (passive) to 100 (active).
Predictor Variables of Mental States Continuous physiological, behavioral and contextual data of participants were captured using two sensing devices. The commercial-grade smart ring from Oura (see Cao et al., 2022) collected data about sleep patterns, resting heart rate, heart variability and physical activity. A customized smartphone application (created with the AWARE framework, see Ferreira, Kostakos and Dey, 2015) collected smartphone usage metrics such as application usage, number of phone unlocks and GPS locations. A more detailed overview of the different types of data collected can be found in Table 1.
Data Collection Protocol The total data collection period is nine months long, targeting a participant period of 276 days per participant. At the beginning of the study, participants provided written informed consent for the different types of data collected. After signing the informed consent, participants took part in an intake inte- rview in which they were asked about their daily routines, most-visited locations and behavioral patterns when they are stressed or not feeling well. Participants were specifically asked to describe their (self-estimated) behavi- oral patterns when feeling stressed or depressed in the following categories: exercise/activity, sleep, movement, app usage, social contacts, smartphone
Table 1. Signals and first order variables extracted from the two sensing devices.
Table available in the original PDF paper.
Sensor Signals Features Oura Ring Motion, heart pulse Sleep start time, Sleep end time, SOL, TST, SE, Fluctuations in TST, Fluctuations in SE, Mean nocturnal heart rate, Lowest nocturnal heart rate, Time to lowest nocturnal heart rate, Nocturnal HRV, HRV during last 30 minutes of sleep, Fluctuations in nocturnal HRV, Sedentary time, MVPA, MET-minutes AWARE framework
Phone usage, GPS, motion
Screen time, Browser app time, Communication app time, Entertainment app time, Gaming app time, Information app time, Social app time, Commerce app time, Total app time, Unique apps per day, Notifications per day, Social notifications per day, Unique social contacts per day, Time at home, Time at work, Time at sports location, Time at other known location, Time spent traveling Distance traveled, SMS messages sent Note. SOL = Sleep Onset Latency; TST = Total Sleep Time; SE = Standard Error; HRV = Heart Rate Variability; MET = Metabolic Equivalent of Task; MVPA = Moderate-to-Vigorous Physical Activity.
usage and communication via smartphone such as calling and SMS. For each participant, a custom-sized Oura ring was ordered. Participants were instru- cted to wear the ring at all times, except when charging the device or when doing sports where the ring could hinder movement or be damaged. After receiving the Oura ring, each participant filled in a longer questionnaire with demographic questions and various validated questionnaires about persona- lity traits, coping strategies, coping self-efficacy, perceived stress, burnout, general health, well-being and other complaints or symptoms. Participants also filled in questions about possible recent changes in their personal life before starting with the daily data collection. At the end of each month, participants filled in a monthly questionnaire, including the validated questi- onnaires from the intake questionnaire and additional questions about recent changes. To stimulate both interest and adherence to the study throughout the months, feedback moment of 30 minutes were planned with the main researcher and each participant every four weeks. Participants received insi- ght into their own personal raw data and could exchange experiences or report problems with the data collection. At the end of the data collection period, when participants had taken part for nine months and delivered at least 85% of valid data points, an outtake interview was planned with each participant. During this outtake interview, several evaluation and feedback questions about their participation in the research were asked.
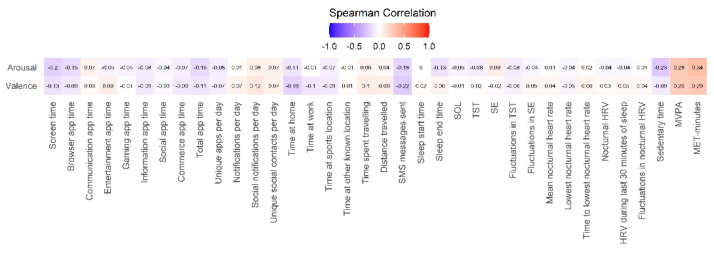
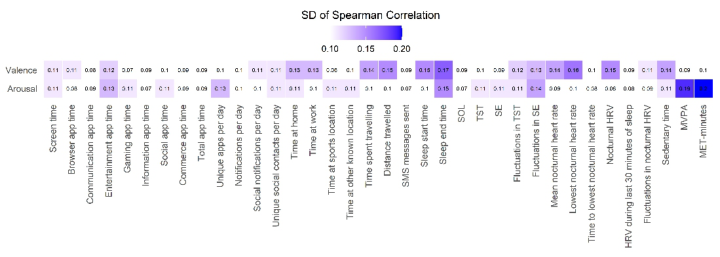
Data Analysis For each variable, daily values were aggregated and merged into one complete dataset. Descriptions of each variable and choices regarding aggregation to daily data, noise and missing data are described per sensor on the following website (http://doi.org/10.17605/OSF.IO/QC9J6). For the data management and statistical analyses, RStudio (Allaire, no date) was used. Spearman cor- relation analyses were conducted to investigate the relationships between predictor variables and the outcome variables valence and arousal. Vale- nce and arousal were each correlated to each predictor variable across the data of all subjects, and the resulting Spearman’s rho averaged across participants for each predictor-outcome combination was depicted in a hea- tmap. These reflect relations between behavior and mental state across the population. Secondly, we calculated the standard deviation of Spearman’s rho for every predictor-outcome combination across participants. The stan- dard deviations were also depicted in a heatmap and reflect the extent to which the correlation of each predictor-outcome combination differs across participants.
RESULTS
Predictor Variables and Correlations With Mental States On a population level, there were weak Spearman correlations between the predictor variables and the outcome variables valence and arousal, ranging from −0.23 to 0.34 (see Figure 1).
Valence correlated most strongly with the predictor variables SMS mes- sages sent, Time at home, Screen time, Total app time, Social notifications
Towards Continuous Mental State Detection in Everyday Settings 137
Figure 1: Heatmap depicting population-level correlations of predictor variables with valence and arousal.
per day, MVPA and MET-minutes, with rho’s ranging from −0.22 to 0.29. Arousal correlated most strongly with the predictor variables Sedentary time, Screen time, SMS messages sent, Total app time, Browser app time, Sleep end time, Time at work, MVPA and MET-minutes, with rho’s ranging from −0.23 to 0.34.
On a population level, the standard deviation of Spearman’s rho for the predictor-outcome combinations ranged from 0.07 to 0.20 (see Figure 2). The extent to which the correlations between the predictors and valence differ across participants was highest for Screen time, Browser Time, Social noti- fications per day, Unique social contacts per day, Fluctuations in nocturnal HRV, Entertainment app time, Fluctuations in TST, Time at home, Time at work, Fluctuations in SE, Time spent traveling, Mean nocturnal heart rate, Sedentary time, Distance traveled, Sleep start time, Nocturnal HRV, Lowest nocturnal heart rate and Sleep end time, with standard deviations of rho ran- ging from 0.11 to 0.17. The extent to which the correlations between the predictors and arousal differ across participants was highest for Screen time, Gaming app time, Social app time, Unique social contacts per day, Time at home, Time at sports location, Time at other known location, TST,SE,Fluctu- ations in TST, Sedentary time, Entertainment app time, Unique apps per day, Fluctuations in SE, Sleep end time, MVPA and MET-minutes, with standard deviations of rho ranging from 0.11 to 0.20.
Figure 2: Heatmap depicting population-level correlations of standard deviations from each predictor variable with valence and arousal.
DISCUSSION
This paper investigated important predictors of daily self-reported valence and arousal and how these differ across individuals in terms of their impor- tance and directional relationship. Preliminary results suggest that several predictors of valence and arousal are more subject dependent than oth- ers, indicated by a higher between-subject variance in the correlations for those predictor-outcome combinations (e.g., SD=.17 for sleep end time and valence) compared to others (e.g., SD=.06 for time at sports location and valence). This is important to know when interpreting correlations at the population level. Overall weak correlations between predictor and outcome variable on a population level, can be a result of strong correlations on the level of the participant that vary in direction. For example, the diffe- rences across the relation of sleep end time and valence may indicate that waking up at a later moment in time is connected to a pleasant mood for one person but to an unpleasant mood for another person. Similarly, the dif- ferences across the relation of lowest nocturnal heart rate and valence may indicate that having a restful night with a low heart rate feels pleasant for one person but does feel unpleasant or does not affect the mood of another person.
Based on these first descriptive and correlational statistics, we found sup- port for the idea that there are differences between individuals in what factors may have an influence on mental states. These between-subjects variations are usually not considered in population-level prediction models and may be one reason why current studies focusing on the prediction of stress states (see Booth et al., 2022) only show small-to-moderate effects. In future analy- ses, the complete data set will be used to create individual-based prediction models of mental states and test these in comparison to population-based pre- diction models. If these individual-based models prove to be successful, these models can be integrated in mental health interventions and applications that create personalized feedback on changes in predictors and, consequently in mental states.
Additionally, it will be explored to what extent there is overlap in self- reported information of participants about behavioral patterns at the begin- ning of the study and the continuously measured predictors of mental states. If the self-evaluation of a participant matches with the collected data, this can be used to minimize the amount and kind of collected data before the actual data collection.
CONCLUSION
This article presented a detailed description of the set-up of a longitudinal study for the detection and prediction of mental states based on wearable and contextual sensing. Preliminary results indicate that predictors of men- tal states and their relation with valence and arousal are subject-dependent. These variations support the need for individual-based prediction models of mental states, which will be created and tested in future analyses of this study.
Towards Continuous Mental State Detection in Everyday Settings 139
ACKNOWLEDGMENT
The authors would like to acknowledge the participants who delivered extensive and important data for this paper and future analyses.
REFERENCES
Allaire, J. J. (no date). The R Project for Statistical Computing. Availa- bleat: http://www.rstudio.com. (Accessed: 13 February 2023). Anderson, K. and Bradley (2013) “Sleep disturbance in mental health problems and neuro degenerative disease,” Nature and Science of Sleep, 5, pp. 61–75. doi: https: //doi.org/10.2147/nss.s34842. Bhugra, D. and Mastrogianni, A. (2004) “Globalisation and mental disorders,” Bri-
tish Journal of Psychiatry, 184(1), pp. 10–20. doi: https://doi.org/10.1192/bjp. 184.1.10. Booth, B. M. et al. (2022) “Toward robust stress prediction in the age of wearables: Modeling perceived stress in a longitudinal study with information workers,” IEEE Transactions on Affective Computing, 13(4), pp. 2201–2217. doi: https: //doi.org/10.1109/taffc.2022.3188006. Canzian, L. and Musolesi, M. (2015) “Trajectories of depression,” Proceedings of
the 2015 ACM International Joint Conference on Pervasive and Ubiquitous Com- puting - UbiComp ‘15 [Preprint]. Available at: https://doi.org/10.1145/2750858. 2805845. Cao, R. et al. (2022) “Accuracy assessment of oura ring nocturnal heart rate and heart rate variability in comparison with electrocardiography in time and frequency domains: Comprehensive analysis,” Journal of Medical Internet Research, 24(1). doi: https://doi.org/10.2196/27487. Chirico, F. (2016). “Job stress models for predicting burnout syndrome: a review”, Annali dell’Istituto Superiore Di Sanità, 52(3), 443-456. doi: https://annali.iss.it/index.php/anna/article/view/276 Collins, P. A. and Gibbs, A. C. C. (2003) “Stress in police officers: A study of the
origins, prevalence and severity of stress-related symptoms within a county police force,” Occupational Medicine, 53(4), pp. 256–264. doi: https://doi.org/10.1093/ occmed/kqg061. Currier, D. et al. (2020) “Physical activity and depression in men: Increased activity duration and intensity associated with lower likelihood of current depression,” Journal of Affective Disorders, 260, pp. 426–431. doi: https://doi.org/10.1016/j. jad.2019.09.061. Ferreira, D., Kostakos, V. and Dey, A. K. (2015) “AWARE: Mobile context instrumen-
tation framework,” Frontiers in ICT, 2. doi: https://doi.org/10.3389/fict.2015. 00006. Gross, J. J. and Jazaieri, H. (2014) “Emotion, emotion regulation, and psychopathology,” Clinical Psychological Science, 2(4), pp. 387–401. doi: https://doi.org/10. 1177/2167702614536164. Gross, J. J. and Muñoz, R. F. (1995) “Emotion regulation and mental health.,” Cli-
nical Psychology: Science and Practice, 2(2), pp. 151–164. doi: https://doi.org/10. 1111/j.1468-2850.1995.tb00036.x. Gross, J. J., Uusberg, H. and Uusberg, A. (2019) “Mental illness and well-being: An affect regulation perspective,” World Psychiatry, 18(2), pp. 130–139. doi: https: //doi.org/10.1002/wps.20618.
Hagströmer, M., Oja, P. and Sjöström, M (2007) “Physical activity and inactivity in an adult population assessed by accelerometry,” Medicine & Science in Sports & Exercise, 39(9), pp. 1502–1508. doi: https://doi.org/10.1249/mss.0b013e3180a 76de5. Helgadóttir, B., Forsell, Y. and Ekblom, Ö. (2015) “Physical activity pat- terns of people affected by depressive and anxiety disorders as measu- red by accelerometers: A cross-sectional study,” PLOS ONE, 10(1). doi: https://doi.org/10.1371/journal.pone.0115894. Hofmann, S. G. (2014) “Toward a cognitive-behavioral classification system for
mental disorders,” Behavior Therapy, 45(4), pp. 576–587. doi: https://doi.org/ 10.1016/j.beth.2014.03.001. Jazaieri, H., Urry, H. L. and Gross, J. J. (2013) “Affective disturbance and psychopathology: An emotion regulation perspective,” Journal of Experimental Psychopathology, 4(5), pp. 584–599. doi: https://doi.org/10.5127/jep.030312. Koinis, L. et al. (2022) “A commentary on the potential of smartphones and other
wearable devices to be used in the identification and monitoring of mental illness,” Annals of Translational Medicine, 10(24), pp. 1420–1420. doi: https://doi.org/10. 21037/atm-21-6016. Li, J. et al. (2014) “Work stress and the risk of recurrent coronary heart disease events: A systematic review and meta-analysis,” International Journal of Occupa- tional Medicine and Environmental Health. doi: https://doi.org/10.2478/s13382- 014-0303-7. Levecque, K. et al. (2017) “Work Organization and Mental Health Problems in Phd
students,” Research Policy, 46(4), pp. 868–879. doi: https://doi.org/10.1016/j.re spol.2017.02.008. Russell, J. A. (1980) “A circumplex model of affect.,” Journal of Personality and Social Psychology, 39(6), pp. 1161–1178. doi: https://doi.org/10.1037/ h0077714. Saeb, S. et al. (2016) “The relationship between mobile phone location sensor data and depressive symptom severity,” Peer J, 4. doi: https://doi.org/10.7717/peerj.2537. Teychenne, M., Ball, K. and Salmon, J. (2008) “Associations between physical activity
and depressive symptoms in women,” International Journal of Behavioral Nutri- tion and Physical Activity, 5(1). doi: https://doi.org/10.1186/1479-5868-5-27. Teychenne, M. et al. (2019) “The association between sedentary behaviour and indicators of stress: A systematic review,” BMC Public Health, 19(1). doi: https: //doi.org/10.1186/s12889-019-7717-x. Trull, T. J. and Ebner-Priemer, U. (2014) “The role of ambulatory assessment
in psychological science,” Current Directions in Psychological Science, 23(6), pp. 466–470. doi: https://doi.org/10.1177/0963721414550706. van der Molen, H. F. et al. (2020) “Work-related psychosocial risk factors for stressrelated mental disorders: An updated systematic review and meta-analysis,” BMJ Open, 10(7). doi: https://doi.org/10.1136/bmjopen-2019-034849. Wang, L. and Miller, L. C. (2019) “Just-in-the-moment adaptive interventi- ons (JITAI): A Meta-Analytical Review,” Health Communication, 35(12), pp. 1531–1544. doi: https://doi.org/10.1080/10410236.2019.1652388.
LISTED IN THE AHFE DIGITAL BOOKSTORE CATALOGUE
Explore the complete digital volume
Neuroergonomics and Cognitive Engineering
Read this individual research paper free through the original publisher, or explore the full digital proceedings book.
ISBN 978-1-958651-78-0
Explore this ISBN in the AHFE Bookstore ↗Listed in the July 2026 bookstore catalogue; search by ISBN to confirm current availability · Digital book purchase optional