Alexandre Marois, Laura Salvan, Noémie Lemaire, Jean-François Gagnon (2023). User-Centered Dashboard for Sensors-Enabled Human State Monitoring: Two Operational Use Cases. In: Usability and User Experience. AHFE Open Access, vol. 110, pp. 189–199. https://doi.org/10.54941/ahfe1003191
Recent developments in sensing technologies make it increasingly feasible to collect physiological and behavioural data that can be exploited to understand operators’ cognitive challenges, health and operational readiness in real-life situations. Our previous work led to the development of a real-time data integration, synchronization, and processing nexus that can be used with multiple sensors and multiple users simultaneously. In turn, this data can be analysed and displayed on a dashboard to monitor one’s state using machine-learning derived or classical algorithms. This study presents how user-centred design can be harnessed to develop context-adapted monitoring solutions in two different use cases, that is space medicine and public safety personnel training. We highlight the steps taken to define context-adapted solutions for the exploitation of physiological and behavioural data. We also outline the necessity to consider end-users and stakeholders to produce usable information that is context relevant and that optimizes the human-system interaction.
Human physiology recording tools have largely improved in the last decade. While new measuring modalities have been developed to cover a larger vari- ety of human state indices, advances in sensors mobility, resolution and edge computing capacities have also opened for new applications of human state monitoring. In fact, the collection of physiological and behavioural data is becoming increasingly accessible. The raw data collected by these tools can lack context and be too low-level to be useful. However, data can be turned into actionable information in order to provide a portrait of a person’s cogni- tive, medical or operational state in a given real-life situation (Friedl, 2008). Human state monitoring techniques relying on actionable sensor-based infor- mation have proven particularly useful in safety-critical domains for many use cases including but not limited to driving (Diaz-Piedra et al. 2021), war- fare land operations (Friedl, 2008), medicine (Majumder et al. 2017), and training (Behneman et al. 2012).
To produce critical information on one’s state, it is imperative to col- lect valid and reliable data that cover measures of human behaviour and psychophysiology related to the state of interest for a given domain of appli- cation. Besides, this data must be collected and analysed in real time or near-real time to provide a portrait of the state of the operator that is up to date and representative of their current state. To this end, our previous work led to the development of the Sensor Hub, a real-time data integration, synchronization, and processing nexus that allows the sampling of data from multiple sensors, on multiple users simultaneously (Gagnon et al. 2014). This technology allows more particularly the following:
1. To integrate and interpret raw data from one or multiple wearable sen- sors to produce features representative of one’s low-level state (e.g. blood pressure, heart rate [HR], heart rate variability [HRV], respiration rate, or spectral power bands of the brain electric activity); 2. To assess high-level dimensions such as workload, stress, fatigue, or attentional tunnelling, from a set of different features using either decision rules or models built using machine learning; and 3. To exploit dimension models in order to develop monitoring capacities that enable to intervene at the behavioural level to support decision or prevent errors, with the flexibility to edit relationships/rules as neces- sary to adjust for new contexts via user-centric calibration/learning capabilities.
The medium by which the operable information is provided to the user (either the operator that is monitored or the person monitoring the indivi- dual) may however largely influence how the data is perceived and compre- hended. Indeed, while models can be used to predict a given state or even notify an operator when they find themselves in a state that might promote error making, the usefulness of such information depends highly on how it is transmitted to end-users. Dashboards and interfaces represent a great tool to display actionable information to users in many different domains and con- texts. Yet, to be useful, the data depicted must be adapted to the context, i.e. presented in relation to the different tasks that the monitored operators must perform. Moreover, the moment where this information is given and the way it can be actually used by the user to intervene and prevent error is also cri- tical and highly depended on the context of application. Finally, information must be shown in a format or with variables that can be understood by the end-users, i.e. while considering their expertise and level of knowledge on the type of data collected. For example, measures of HR and HRV can be collected and analysed to provide estimation on stress level of a person. Still, the way this information is depicted (e.g. on a plot with a level between 0 and 10, or through an alert triggered only when a certain threshold is reached) must be defined according to the context of application.
Several methods can be beneficial to consider the context in which a service or a product is used, especially user-centred approaches. These techniques are centred on users and allow designing a solution tailored to address their needs and challenges. Norman (1988) established four basic suggestions on how
User-Centred Dashboard for Sensors-Enabled Human State Monitoring 191
user-centred design should be: a) making easy to determine what actions can be performed at any moment; b) making visible the conceptual model of the system, alternative actions, and results of these actions; c) making accessible the evaluation of the state of the system; and d) following natural mapping between intentions and actions, actions and effects, and information and interpretation. To do so, many user-centred techniques can be used, including interviews and questionnaires, focus groups, on-site observation, simulations, and usability testing (Preece et al. 2002). To this end, user-centred approaches seem especially relevant for developing context-adapted dashboard solutions designed to provide end-users from different domains actionable information on the state of given operators.
The goal of this study is to present how user-centred design can be har- nessed to develop context-adapted human state monitoring solutions in two different use cases. For both use cases, we describe the steps taken to consi- der users’ needs and challenges and to develop the dashboards accordingly. The first use case presented is focused on space medicine. More particularly, it is applied to the development of a dashboard allowing the follow-up of health and medical data collected in near-real time on astronauts for space missions. The second use case discussed concerns the training of public safety personnel. More precisely, it is associated with the creation of a dashboard that allows following multiple scenario performance-related outcomes that can inform on the potential and readiness of police officers.
USE CASE 1: SPACE MEDICINE This use case concerns the development of a dashboard for monitoring health and medical data of astronauts for the Canadian Space Agency (CSA). Follo- wing a brief literature review and discussions with stakeholders and experts, the medical monitoring dashboard had to support the following three situati- ons: a) passive monitoring of astronauts (i.e. while they do their daily tasks); b) active monitoring of the astronauts (i.e. for a medical examination); and c) medical and health management (i.e. for the mitigation of certain detected conditions).
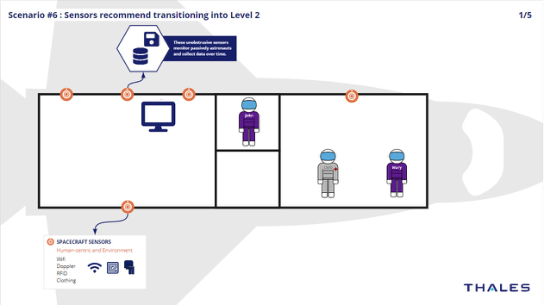
Workshops and Workflows Human factors specialists, designers, academics, as well as end-users, stake- holders and experts from CSA and sensor manufacturers took part in two workshops based on the design thinking methodology. In these workshops, nine scenarios were presented, each encompassing various steps that a space crew could face regarding health management situations. Scenarios were pro- duced while considering the three monitoring/mitigation situations required by the stakeholders and experts. They were shown to the participants in the form of text description and visual representation (see Figure 1). An example of a scenario is a situation where specific sensors-based monitoring models— during passive monitoring—recommend transitioning to active monitoring to go through more specific health check-ups.
Figure 1: Example of a depiction of a scenario during the workshops.
Following the presentation of the scenarios, participants were asked to make edits and comments. With these edits, two user experience (UX) desi- gners used the scenarios and generated a complete conceptual workflow that would cover each one of them. More precisely, the workflow aimed at docu- menting how data flowed through the monitoring system and what were the main functions required on all steps. The general conceptual workflow was broken down into several steps, each comprised with functions that the monitoring system should be able to perform. It included the following steps:
1. Homepage: contains login functions and personal information page for each member; 2. Passive monitoring (Level 1): constant passive monitoring with conta- ctless/unobtrusive sensors and periodic automatic check-ups with wea- rable sensors; 3. Active monitoring (Level 2): has active health monitoring capacities with instructions and procedures for evaluating specific conditions follow- ing either automatic (based on a deviation from a norm) or manual transition; and 4. Medical management (Level 3): concerns the mitigation of some dete- cted conditions following Level 2 evaluation with a treatment plan and procedures.
Workflow Validation and Dashboard Development From the workflow, UX designers produced mock-ups of the dashboard of the monitoring solution, covering all the functions identified. These mock- ups were then showed to the workshops’ participants in order to collect comments and recommendations.
Comments and edits on the mock-ups were collated and the monitoring dashboard was developed accordingly. The monitoring solution relied on a series of different sensors including: a) smart garments with electrocardio- graphy (ECG), respiration, temperature and blood oxygenation measuring components; b) a smartwatch with notification, accelerometer and HR moni- toring capacities; c) millimeter wave (mmWave) system to infer respiration
User-Centred Dashboard for Sensors-Enabled Human State Monitoring 193
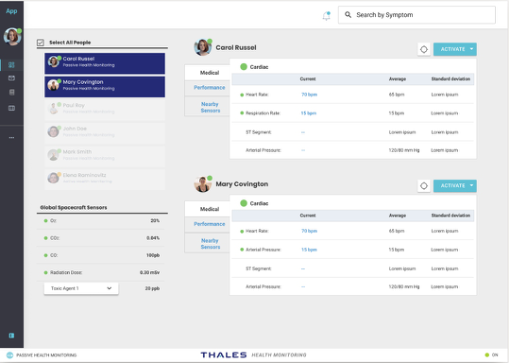
Figure 2: Depiction of the dashboard for space health monitoring with two astronauts passively monitored.
and HR remotely; and d) a mobile eye tracker. These sensors were used to identify the following health challenges: deviation from the cardiac or respiration norm, hypovigilance, stress, and cardiac arrhythmia. The dashbo- ard solution depicted each astronaut monitored with some of their real-time health data (e.g. HR, respiration), performance of health prediction models, and nearby contactless remote monitoring sensors.
By default, each astronaut is passively monitored (Level 1). The system notifies users for changes of monitoring level and the interface displays active monitoring and mitigation procedures for Levels 2 and 3, respectively. For both these levels of monitoring, relevant real-time medical data are depicted on the dashboard and step-by-step procedures (either monitoring or state mitigation) are shown with images and videos, alternating with context- relevant medical questions. Figure 2 displays an example of the dashboard with two astronauts being passively monitored (i.e. Level 1 monitoring). From this solution developed, CSA experts made examinations and tests, and provided feedback for future improvements.
Overall, the dashboard developed for space health monitoring achieved the different functions deemed necessary by the CSA end-users, stakeholders and experts. It allowed monitoring multiple astronauts concurrently, using a set of mobile and contactless sensing technologies, on a series of medical conditions at different management levels (i.e. from passive monitoring to mitigating a detected condition).
USE CASE 2: PUBLIC SAFETY PERSONNEL TRAINING This use case concerns the development of a dashboard that aimed at sup- porting the training of safety personnel (e.g. police officers) during simulated scenarios for two Canadian public safety organizations. Needs from these two organizations, identified through discussions with experts and literature
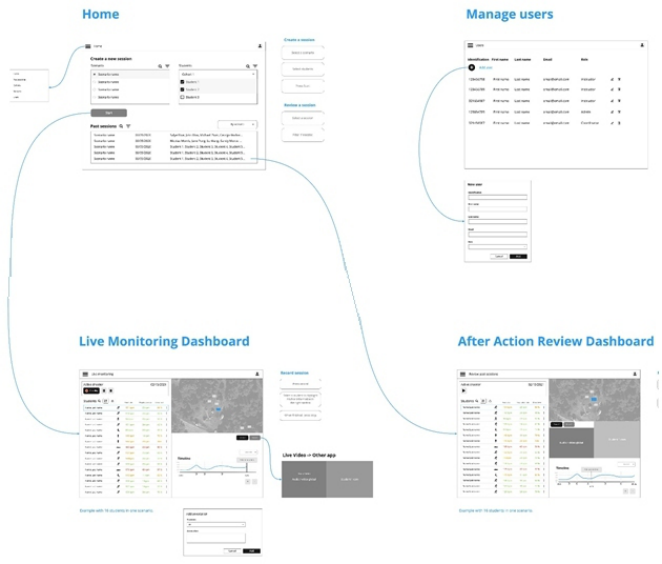
Figure 3: Example of wireframe generated from the user flow diagrams.
review, included the capacity to observe trainees’ behaviour and physiologi- cal activity in order to adapt the training scenario difficulty, and supporting training through the whole pipeline, i.e. before and after the training session.
Interviews and Wireframes Two UX designers interviewed five participants (either instructors or training managers) from the safety organizations. Interviewers collected information about the typical timeline of a training session, including tasks conducted before and after the session. These interviews outlined the necessity for moni- toring capacities even during a baseline period, before the beginning of a scenario. The participants also considered necessary the addition of a label- ling tool to label activities and periods where the data was collected on the users (e.g. baseline period, beginning of a given scenario, occurrence of a specific event). To support the post-training period, participants outlined the necessity for an after-action review dashboard.
From this information, user flow diagrams considering the whole training session pipeline (with tasks before and after) were created. These diagrams were shown to stakeholders for validation, and then used as a starting point for the development of wireframes, i.e. two-dimensional illustrations of a page’s interface focusing specifically on space allocation and prioritization of content, functionalities, and intended behaviours. Figure 3 depicts an example of a wireframe generated.
User-Centred Dashboard for Sensors-Enabled Human State Monitoring 195
Wireframe Validation and Dashboard Development The UX designers conducted a workshop with the participants to show them the different wireframes that were generated to gather comments and poten- tial edits. Each of the wireframe corresponded to a general organization of the information within each page of the training-support monitoring dashboard, as well as a depiction of the functionalities needed for each page.
Following the workshop, modifications were brought to the wireframes. They were then used to produce high-fidelity mock-ups. The monitoring solution relied on the following sensors: a) a smart garment with ECG, respiration, and acceleration components; b) a smartwatch with notifica- tion, accelerometer and HR monitoring capacities; c) a wearable functional near-infrared spectroscopy (either headband or head cap); and d) a phone equipped with a GPS, a camera and a microphone. These technologies were used to evaluate the level of stress, the type of activity performed by the trai- nee, the level of cognitive load, and the context in which the activities were performed. Based on these tools and models, the training-support monitoring dashboard was comprised of three views:
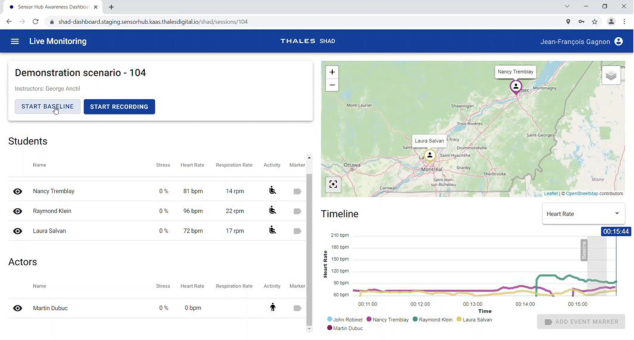
1. Live monitoring: This allows instructors to monitor up to 16 individuals (trainees and actors) during an exercise. The dashboard displays metrics related with the trainees’ stress level and cognitive load, as well as seve- ral contextual information such as geo-location and activity type. The observing instructor can use the interface to add event markers. 2. After action review: The view for after action review is very similar to the one for live monitoring except that it allows for video playback in addition to all other data. The users can add new event markers or replay the scenarios around existing event markers. All data streams including video are synchronized. This view is designed for review with or without the trainees. 3. Analyst view: This view depicts a web dashboard that allows an analyst or scenario designer to download data of multiple past recording sessi- ons. The dashboard allows the user to filter by dates, scenarios, cohorts, trainees, and to select the type of data to download.
The UX designers carried out usability tests with unbiased end-users (i.e. users uninvolved in the design process) to detect usability issues and oppor- tunities of improvement. The tests were done with two users from each organization with different level of experience and different roles related to the administration of scenarios. These tests allowed the UX team to identify necessary improvements for the tool that were then prioritized and deve- loped within the tool. Figure 4 displays an example of the live monitoring dashboard that was developed.
The dashboard developed to support the training of safety personnel was thus coherent with the typical workflow of training of the users. Besides, per the stakeholders’ requirements, it enabled the follow-up of trainees’ beh- aviour and physiological activity during scenario completion as well as the support of training before, during and after a training session.
Figure 4: Depiction of the live monitoring dashboard for training-support monitoring with three trainees and one actor being monitored.
GENERAL DISCUSSION The goal of this study was to document how user-centred design can be utili- zed to develop context-tailored operator monitoring dashboard solutions in two different use cases, i.e. for space medicine and public safety personnel training. For both use cases, feedback from stakeholders, experts and future end-users from the respective use cases was collected via workshops or inte- rviews. Then, user workflows and mock-ups were generated for each use case to define the structure and functions of the dashboards. These were shown to end-users, experts and stakeholders and, following their feedback, the dash- boards were developed while ensuring that the main needs for each domain were respected.
The user-centered approach privileged herein allowed to cover most of the basic design requirements raised by Norman (1988), from a user point of view. Indeed, all the steps taken (i.e. literature review, user workshops and interviews, workflow definition, mock-ups creation and feedback from users) aimed at ensuring that the solution would be usable, understandable and predictable by the end-users in each respective use case. The steps of the user-centred approach were also consistent with other methods privileged in the literature in similar use cases. For instance, Smaradottir (2016) proposed a list of user-centred design steps relevant for health information technology development, specifically for telemedicine and remote monitoring. For a full user-centred pipeline, from initial end-user requirement elicitation to final deployment of technology, the author recommended to go through the fol- lowing sequence of steps: a) field study; b) user workshops; c) design and development; d) user evaluations; e) field trial; and f) final deployment. In our case, the dashboards developed for the remote monitoring of astronauts (Use case 1) and public safety personnel trainees (Use case 2) are not yet to be deployed and research and development is still ongoing. Yet, our method capitalized on relevant literature, workshops and interviews, as well as back and forth validation between design/development and end-users. As outlined
User-Centred Dashboard for Sensors-Enabled Human State Monitoring 197
by Smaradottir (2016), such approach is key to develop practical and usable health technologies that end-users consider intuitive. Besides, this approach is consistent with the ISO standard on ergonomics and human-system intera- ction (International Organization for Standardization, 2018), which further supports the relevance of this method.
From a broader perspective, our work took advantage of different mobile, wearable and contactless sensing technologies to develop systems that would provide higher-level types of information on the real-time state of users. This is in line with recommendations made by Friedl (2008) in terms of practical sensing data. Among the different challenges posed by real-time physiologi- cal status monitoring, data management and human factors considerations are particularly related to the current work. In these two use cases, we deve- loped a system that could analyse raw data, aggregate it in high-level state measures, and display them in a way that would be logical for end-users in an understandable form. Such approach is also in line with principles of cogni- tive systems engineering where the technology system must be tailored to the cognitive requirements emerging when the operator interacts with the mach- ine, including how people think and act in their work environment (Militello et al. 2010). From a human-system interaction perspective, the dashboard design step is also key in the sense that interfaces are essential for transferring “lingual, programmized and virtual information [i.e. the data] into recogni- zable visual information” (Gong, 2009, p262). Globally, this means that the dashboards developed for both use cases are optimized not only from a design perspective (i.e. for usability by end-users), but also at the level of the human- system interaction (i.e. data communicated from machine to human) and the cognitive demands it may pose (i.e. interface consistent with the cognitive tasks/actions incurred by the use case). Therefore, the present work highlights the necessity to include end-users and stakeholders into the design steps.
While the current work describes the development of two human state monitoring dashboards specifically designed for space medicine and public safety personnel training, other applications can be envisioned. The dashbo- ard developed for the space medicine use case could be adapted and used for telemedicine applications, for instance on Earth with remote popula- tions. Dashboards similar to the one focusing on public safety personnel training could also be transferred into actual operational environments, e.g. for improving situation awareness of personnel in action. This could be espe- cially relevant during police operations or even in warfare land operations among the military (Friedl et al. 2016; Salvan et al. 2022). Both components of the two dashboards developed (i.e. healthcare follow-up and operatio- nal/performance monitoring) could also be combined for defence use cases. Indeed, these two capabilities would serve useful for evaluating multiple aspe- cts while soldiers/police officers are deployed, including the activity they are performing, the stress, workload or level of fatigue they experience, and even their vitals and health information. Such would not only provide supervisors and commanding personal a closer look to the ongoing situation, but could also contribute to better manage risks for health and survival during combat operations. Indeed, such enhanced awareness of the situation might contri- bute to reducing delays and optimizing the nature of medical interventions on
the field (e.g. for improved medical triage; Marois et al. 2021). User-centred research and design would again be relevant for adapting the solutions to all these new situations. Ultimately, this could even promote adoption of the solution by end-users (Chilana et al. 2015).
CONCLUSION
In conclusion, our work presented a series of steps performed to develop sensor-based human state monitoring dashboards applicable to space medi- cine and public safety personnel training use cases. It outlined how adopting a user-centred approach can contribute to designing a solution that is more adapted to the context of use and that may improve usability and understan- ding from the perspective of end-users, reducing simultaneously any cognitive challenge or communication issues when interacting with the sensor-based monitoring system. In fact, the involvement of end-users and experts during the design and development phases (i.e. through interviews, workshops and validation) was key for the success of the solutions. Future work will focus on further refining the solutions by conducting users’ tests and, ultimately, testing the solutions in real-life situations or in near-real-life simulations.
ACKNOWLEDGMENT
The authors would like to thank all users, stakeholders and experts that took part in the workshops and interviews for scenario, workflow and wire- frame definition and validation. Special thanks are due to the Canadian Space Agency and to the Canadian Safety and Security Program (CSSP) for their financial support. We also want to acknowledge the work of the Thales development team and of the Thales Design Centre.
REFERENCES
Behneman, A., Berka, C., Stevens, R., Vila, B., Tan, V., Galloway, T., Johnson, R. R.
and Raphael G. (2012) ‘Neurotechnology to accelerate learning: During mark- smanship training’, IEEE Pulse, 3(1), pp. 60–63. Available at: https://doi.org/10. 1109/MPUL.2011.2175641 Chilana, P. K., Ko, A. J. and Wobbrock, J. (2015) ‘From user-centered to adoptioncentered design: A case study of an HCI research innovation becoming a product’, CHI’15: Proceedings of the 33rd Annual ACM Conference on Human Factors in Computing Systems, pp. 1749–1758. Available at: https://doi.org/10.1145/ 2702123.2702412 Diaz-Piedra, C., Rieiro, H. and Di Stasi, L. L. (2021) ‘Monitoring army drivers’ wor-
kload during off-road missions: An experimental controlled field study’, Safety Science, 134, 105092. Available at: https://doi.org/10.1016/j.ssci.2020.105092 Friedl, K. E. (2008) ‘Military applications of soldier physiological monitoring’, Journal of Science and Medicine in Sport, 21(11), pp. 1147–1153. Available at: https://doi.org/10.1016/j.jsams.2018.06.004 Friedl, K. E., Buller, M., Tharion, W. J., Potter, A. W., Manglapus, G. L. and Hyot,
R. W. (2016) Real time physiological status monitoring (RTPSM): Accomplish- ments, requirements, and research roadmap (Technical Note Repot No. TN16-2).
User-Centred Dashboard for Sensors-Enabled Human State Monitoring 199
Natick: U. S. Army Research Institute of Environmental Medicine. Available at: https://apps.dtic.mil/sti/citations/ADA630142 Gagnon, J.-F., Lafond, D., Rivest, M., Couderc, F. and Tremblay, S. (2014) ‘Sensor- Hub: A real-time data integration and processing nexus for adaptive C2 systems’, ADAPTIVE 2014, Sixth International Conference on Adaptive and Self-Adaptive Systems and Applications, pp. 63–67. Gong, C. (2009) ‘Human-machine interface: Design principles of visual information
in human-machine interface design’, 2009 International Conference on Intelligent Human-Machine Systems and Cybernetics, pp. 262–265. Available at: https://do i.org/10.1109/IHMSC.2009.189 International Organization for Standardization. (2018) The ISO standard ISO/DIS 9241–11 Ergonomics of human-system interaction, Part 11: Usability: Definiti- ons and concepts. Available from: http://www.iso.org/iso/catalogue_detail.htm?c snumber=63500 Majumder, S., Mondal, T. and Deen, M. J. (2017) ‘Wearable sensors for remote
health monitoring’, Sensors, 17(1), p130. Available at: https://doi.org/10.3390/ s17010130 Marois, A., Kopf, M., Salvan, L., Lafond, D., Archambault, P. M., Pollock, N. W.
and Gagnon, J.-F. (2021) ‘Evaluation of policy capturing to model judgements of medical experts for triage applications’, 2021 IEEE International Conference on Systems, Man, and Cybernetics (SMC), pp. 2450–2456. Available at: https: //doi.org/10.1109/SMC52423.2021.9658634 Militello, L. G., Dominguez, C. O., Lintern, G. and Klein, G. (2010) ‘The role of cognitive systems engineering in the systems engineering design process’, Systems Engineering, 13(3), pp. 261–273. Available at: https://doi.org/10.1002/sys.20147 Norman, D. (1988) The psychology of everyday things. New York: Basic Books. Preece, J., Rogers, Y. and Sharp, H. (2002) Interaction design: Beyond human-
computer interaction. New York: John Wiley & Sons. Salvan, L., Marois, A., Kopf, M. and Gagnon, J.-F. (2022) ‘Sensors-enabled human state monitoring system for tactical settings’, 2022 IEEE Conference on Cogni- tive and Computational Aspects of Situation Management (CogSIMA), pp. 55–61. Available online at: https://doi.org/10.1109/CogSIMA54611.2022.9903277 Smaradottir, B. F. (2016) ‘The steps of user-centered design in health information
technology development: Recommendations from a PhD research study’, 2016 International Conference on Computational Science and Computational Intel- ligence (CSCI), pp. 116–121. Available at: https://doi.org/10.1109/CSCI.2016. 0029
LISTED IN THE AHFE DIGITAL BOOKSTORE CATALOGUE
Explore the complete digital volume
Usability and User Experience
Read this individual research paper free through the original publisher, or explore the full digital proceedings book.
ISBN 978-1-958651-86-5
Explore this ISBN in the AHFE Bookstore ↗Listed in the July 2026 bookstore catalogue; search by ISBN to confirm current availability · Digital book purchase optional