Lorena Olmos Pineda, Jorge Gil Tejeda (2023). Correlation Between Dominant Sensory Mechanisms and Emotional Responses in Virtual Products. In: Usability and User Experience. AHFE Open Access, vol. 110, pp. 395–400. https://doi.org/10.54941/ahfe1003213
Through the exploration of Human Behavior with the use of networks as well as the tetrachoric coefficient, we sought the relationship between the active Dominant Sensory Mechanisms (DSM) during the processes of interaction with 3 Virtual Products in 3 groups of users., and the Emotional Responses generated in this process. The results obtained suggest the existence of a strong dependence on the dichotomy: Dominate Sensory Mechanisms and Emotional Response (Em). However, the results obtained from the Tetrachoric Coefficient (TC) show an inversely proportional relationship between the activation of the DSM and the Em. In this sense, the results show that the greater the domain of a DSM, the less influence of the Em response, and the greater the influence of the Em response, the less domain of a DSM. This was perceived in all 3 groups of users analyzed.
We can find researches focused on the effects of emotion on memory, such is the case of studies developed by Clifford and Hollin (1981); Edelstein, Ale- xander, Goodman and Newton, (2004); Houston, Clifford, Phillips, Memon (2012). Likewise, studies related to qualities of emotion exposed by Frijda (1988), the classification of Emotion conceptualized by Ekman (1992); the differentiation of emotions made by Kant (1790); the study of emotional responses generated by some artifacts developed by Picard (1999), approa- ches in defining an emotion such as Plutchik (1965), among others. One of the factors that contribute in the generation of an emotional response from a person like user, in addition to those mentioned above, is the interaction with a group of sensory mechanisms. However, explorations continue developing in relation to the Emotional Responses given by a certain person linked to behavior of the Sensory Mechanisms during the processes of interaction with a specific product. In this study we focus on the emotional response derived from human interaction with 3 Virtual Products.
In this sense, the study aimed to investigate the effects of Dominant Sensory Mechanisms (DSMs) in relation to an Emotional Response (Em) during the process of interaction with Virtual Products (VPs). The experience of emotion was classified in the dichotomy: positive and negative in Groups of mixed users (G), likewise three VPs with three different work systems were used, all of them with flat screen technology. Further the DSMs were identified during the processes of interaction with three groups of users, on this process a similarity was found in the process of interaction and was a sensory mech- anisms’ dyad and a variation in its dominance during the process linked to the characteristics of the VP.
GENERAL ATTRIBUTES IN SENSORY MECHANISMS In general terms, interaction processes with mass-distribution VPs can be conceived as complex and cyclical (Pineda and Tejeda, 2021). On this pro- cess the activation of certain sensory mechanisms has been observed, which variation depends on the qualities of VP. In this sense, the maximum sensory mechanisms that have been detected are Proprioception (Prop), gross motor Interaction (Img), visual Interaction (Iv), fine motor Interaction (ImfD), digital Pressure (Pd), sonor Interaction (Is). As can be seen, the sensory mech- anisms that are most involved in the interaction with virtual products are the photoreceptors and the mechanoreceptors. Also, an important factor is that the processes of interaction with VPs do not occur in isolation, but in a mini- mum range of dyads. These dyads depend on human factors, VP and the work system.
METHODOLOGY
The process was integrated by two phases. In the first phase, 3VPs were expo- sed in a local environment with a general task assigned in 3 groups of mixed users: integrated by sectors of Men and Women with an average age of 25.16 years, with 12 persons in each group, without cognitive problems, comor- bidity or visual problems also without recent medication use. Group 1 was exposed to a personal Flat Screen Technology device with a VP that showed the highest demand for the spatial-fine location (G1). Group 2 was expo- sed to a non-personal Flat Screen device with a VP that showed the highest demand for the spatial-general location (G2) (Olmos and Gil, 2022). Group 3 was exposed to a work system considered as emerging technology because it is not common on a great diversity of environments, this VP not only had the longest time registered in focal attention (G3), but also the highest demand for the spatial-fine location. The method used to obtain data -once the task was assigned- was non-participant observation, from which the observable factors of the interaction were registered in a matrix and visualized in a program package of large networks. Data of interest were those related to obtain the DSMs starting out with the registration of iterations generated by each SM in every user. Likewise, the Human Interaction Cycles were deter- mined from the breakdown of Focal Attention, which was associated with the greatest times of visual interaction. It is important to remember that the
Correlation Between Dominant Sensory Mechanisms 397
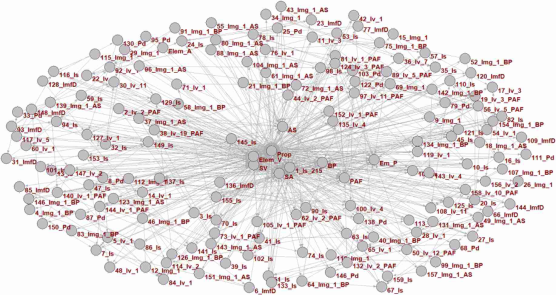
Figure 1: Shows an example of the all Process of interaction realized by one Woman. 300 secs. G2. Normal Vision User. (Elaboration Olmos P.L & Gil T.J. 2022).
interaction processes with this type of virtual products are carried out with basically two types of sensory mechanisms: photoreceptors and mechanore- ceptors. Both sensory mechanisms require that a person have an important level of control in the process as a product of cognitive processes described by Posner & Petersen (1990), so it can be deduced that VPs require a high level of controlled action by the user during their interaction. The use of networks helped to visualize the correlations between SM as well as processes involved in the user’s interaction.
In the second phase, data was analyzed from the tetrachoric coefficient in order to explore the relationship between the active DSMs during the intera- ction processes in the user groups with each VP, and Emotional responses of each user. It is important to comment that the processes of human interaction with VPs involve various Temporal Micro-Processes of Interaction (M-PTI). However, in these studies only the behavior in the relationship DSMs and Emotional responses were observed.
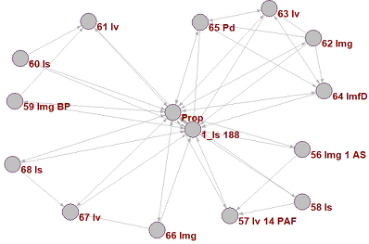
PROCESS DESCRIPTION Network 1 shows an example of one user and the correlation between sensory mechanisms (SMs) during the interaction process with a VP, as well as the fra- gmentation of network in the maximum time. Network 2 shows an example of relationship between DSMs in men’s sector, the Emotional response and the attentional process. In networks, it is possible to observe the correlations that exist between factors of human interaction with emotional responses. In this sense, the SMs that contributed throughout the process in a greater extent were detected: Gross motor interaction (Img), Visual interaction (Iv) in both sectors.
However, for these studies we focused on the detection of SMs with the highest number of iterations considered as dominant ones during the process and the relationship with Emotional Responses. Table 1 shows the DSMs of each group of users and the emotional response given by each user.
398 Olmos Pineda and Tejeda
Figure 2: Shows an example of the Cycle of interaction on T. Max. Normal Vision User. G2. (Elaboration Olmos P.L & Gil T.J. 2021).Table 1. Total Time 300 secs. U=User; SM=Sensory Mechanism; G1=Group 1; G2=Group 2; G3=Group 3. Gen=Gender; Em=Emotion (Elaboration Olmos P.L. & Gil T. J. 2022).
Table available in the original PDF paper.
G1 G2 G3 U SM DSM Em U SM DSM Em U SM DSM Em
1 Img 42 −1 1 Iv 201 1 1 Iv 234 1 2 Iv 136 −1 2 Img 247 1 2 Iv 472 1 3 Img 107 −1 3 Img 212 1 3 Prop 117 1 4 Iv 69 −1 4 Iv 160 1 4 Iv 726 1 5 Iv 128 1 5 Iv 249 1 5 Img 310 1 6 Img 68 −1 6 Img 233 1 6 Iv 108 1 7 Iv 43 1 7 Img 291 1 7 Img 189 1 8 Iv 162 1 8 Img 219 1 8 Img 57 1 9 Img 65 1 9 Img 128 1 9 Iv 148 1 10 Iv 94 −1 10 Img 244 1 10 Img 371 1 11 Iv 82 −1 11 Img 143 1 11 Iv 484 1 12 Iv 113 −1 12 Iv 308 1 12 Iv 528 1 G1 was integrated by 50% Women (W) and 50% Men (M), G2 was inte- grated by 41.66% W and 58.33% M, while G3 was integrated by 33.33% W and 66.66% of M. The DSMs on the three groups were very consistent, being Img and Iv the ones with the highest number of correlations with other SMs in the 3VP. However, differences were observed in relation to the dominance of each SM by sector. In G1 in W sector a balanced on SM activation was observed, the women’s sector in this group made a total of 550 correlations with the two active DSMs in 300 secs, in M sector a similar interaction was observed to W sector with the two active DSMs throughout the process with a total of 559 correlations, however in this last sector the dominance of Iv was remarkable. In G2, in W sector, a balanced activation was again observed between the 2 DSMs detected in the process with a total of 1069 correlations, in M sector the domain of a single mechanism was again observed, the total of correlations made by this sector with the 2 detected DSMs was 1566. In G3, both in the W sector and the M sector, two active DSMs were observed however the dominance of one of them was clear in this case was the Iv in both sectors. Likewise, W sector made a total of 1,225 correlations with the
Correlation Between Dominant Sensory Mechanisms 399
Table 2. Total Time 300 secs. U=User; SM=Sensory Mechanism; G1=Group 1; G2=Group 2; G3=Group 3. Gen=Gender. (Elaboration Olmos P.L. & Gil T. J. 2022).
Table available in the original PDF paper.
G1 G2 G3 U SM DSM Em U SM DSM Em U SM DSM Em
1 Img − + 1 Iv − + 1 Iv − + 2 Iv + + 2 Img + + 2 Iv + + 3 Img + + 3 Img − + 3 Prop − + 4 Iv − + 4 Iv − + 4 Iv + + 5 Iv + − 5 Iv + + 5 Img − + 6 Img − + 6 Img + + 6 Iv − + 7 Iv − − 7 Img + + 7 Img − + 8 Iv + − 8 Img − + 8 Img − + 9 Img − − 9 Img − + 9 Iv − + 10 Iv + + 10 Img + + 10 Img + + 11 Iv − + 11 Img − + 11 Iv + + 12 Iv + + 12 Iv + + 12 Iv + +
two active DSMs, while M sector made a total of 2,402 correlations with the two active DSMs.
With these results, subtle differences were observed in relation to DSMs, the spatial qualities of VP and gender. In this sense, M sector had a greater domain in fine spatial localization processes with a clear domain of a SM, while W sector showed a balance in the activation of 2DSMs. This was obse- rved in VPs of G1 and G2 that generated the longest time in Focal Attention. On the other hand, to analyze the tetrachoric coefficient (rt), the average of dichotomy considered for this study was obtained for each group of users based on Guilford and Fruchter (1984), the results for each G were: G1 Iv = 92.4166, Em = −0.3333; the G2 Img = 219.583, Em = 1; the G3 Iv = 312, Em = 1. According to data, information was visualized based on Abascal and Grande (2014) and was described below (see Table 2).
Based on these results and using the Abascal and Grande method, the rt for each group was obtained., The results were: G1 rt = −1; the G2 rt = −1; the G3 rt = −1.
The results suggest the existence of a strong dependence on the dichotomy: Dominant Sensory Mechanisms and Emotional Response (Em). The results obtained from the Tetrachoric Coefficient (rt) showed an inversely proporti- onal relationship between DSMs activation and Em response. In this sense, the results showed that the greater the domain of a SM the less influence of the Em response, and the greater the influence of the Em response the less domain of a SM. This was perceived in all groups of users. Therefore, it can be perceived that the Emotional Response is affected directly by the number of active SM in general.
CONCLUSION
From the exploration of relationship: activation of the Dominant Sensory Mechanisms and the Em response given by the users, four interesting findings
400 Olmos Pineda and Tejeda
were obtained: A) These studies showed a strong dependence in relation to the number of active sensory mechanisms during the interaction process with certain virtual products and emotional responses. B) It was detected that Emotions are not necessarily linked to the SM with the highest number of correlations during the interaction process in both sectors. C) A variation was observed in relation to the active DSMs, where the women’s sector seems to have a tendency to use two SMs during the interaction processes, while the men’s sector seems to have a tendency to have dominance in one SM during interaction processes at least with virtual products. D) Likewise, a trend was observed in the men’s sector to a better adaptation in activities that require fine spatial location.
REFERENCES
Abascal, E., & Grande, I. (2014). Fundamentos y Técnicas de investigación comercial. (12a Edición ed.). Madrid: ESIC. Clifford, B., & Hollin, C. (1981). Effects of the type of incident and the number of
perpetrators on eyewitness memory. Journal of Applied Psychology, 66, 364–370. doi: doi:10.1037/0021-9010.66.3.364 Edelstein, R., Alexander, K., & Goodman, G. (2004). Emotion and eyewitness memory. Memory and emotion. (I. D. (Eds.), Ed.) New York, NY.: Oxford University Press.. doi: doi:10.1093/acprof: oso/9780195158564.003 Ekman, P. (1992). An argument for basic emotions. Cognition and Emotion, 6,
169–200. Frijda, N. H. (1988). The laws of Emotion. American Psychologist. 43(5), 349–358. Guilford, J., & Fruchter, B. (1984). Estadística aplicada a la Psicología y a la Educación. Mc. Graw Hill. Houston, K., Clifford, B., & Phillips, L. (2013). The emotional eyewitness: The
effects of emotion on specific aspects of eyewitness recall and recognition per- formance,. Emotion, 13(1), 118. Kant, I. (1790). The Critique of Judgment. (T. J. Amherst, Trad.) N. Y.: Prometheus Books. Olmos, Pineda., L., & Gil, Tejeda., J. (2022 c). ‘Geometrical Construction of
Shape by a Weak-Visual Person in a Physical Medium’. Lecture Notes on Data Engineering and Communications Technologies, 146, 221–227. Picard, R. (August de 1999). Affective Computing for HCI. (HCI, Ed.) Vol. 1, 829–833. Picard, R. (1999). Affective Computing for HCI. HCI, 1, 829–83. Pineda, L., & Tejeda, J. (2021). The Hierarchy in the Temporary Interaction Microprocesses that Precede the Breaking Points of Focal Attention in an Object of the New Media. (I. N. (eds.), LNNS. Springer, 265, 63–68. Plutchik, R. (1965). What is an emotion?. J. Psychology, 61, 295–303. Posner, M., & Petersen, S. (1990). The Attention System of the Human Brain. Annual
Review of Neuroscience, Vol. 13, 25–42. doi: https://doi.org/10.1146/annurev.ne .13.030190.000325
LISTED IN THE AHFE DIGITAL BOOKSTORE CATALOGUE
Explore the complete digital volume
Usability and User Experience
Read this individual research paper free through the original publisher, or explore the full digital proceedings book.
ISBN 978-1-958651-86-5
Explore this ISBN in the AHFE Bookstore ↗Listed in the July 2026 bookstore catalogue; search by ISBN to confirm current availability · Digital book purchase optional