Martin Jung, Axel B. Classen, Florian Rudolph (2023). Post-Pandemic Impact Analysis for airport processes from security to boarding – How to respond to the next pandemic. In: Human Interaction & Emerging Technologies (IHIET 2023): Artificial Intelligence & Future Applications. AHFE Open Access, vol. 111, pp. 34–43. https://doi.org/10.54941/ahfe1004007
The COVID-19 pandemic globally affected the complete transport sector and especially passenger air transport with nosediving traffic numbers, wide-ranging travel restrictions and long-lasting uncertainties (see IATA, 2020). As air travel starts to recover cautiously from severe losses of traffic volumes over the pre-pandemic year 2019 and travel restrictions are relaxing, air transport providers have to ensure that passengers as well as people working within the air transport sector will remain safe and be prepared for the next Pandemic. For Example, arboviruses have the potential to spark the next epidemic, warns the World Health Organisation (WHO) and it might only be a question of time when the next pandemic will rise. Airports need to prepare to cope with the next pandemic efficiently and effectively. For this purpose, we develop a toolbox to analyse and evaluate operational measures along the process chain of travelling at an airport.This paper examines the contamination risks at airports covering the travel process from security checks to aircraft seat. In our study we examine the possibility of an infection by dint of simulation with the Pandemic Simulation Model (Pandemic SiM). For this purpose, we advanced an earlier version of Pandemic SiM that only covered the security check area by adding typical boarding processes of a medium sized European airport. The model is based on a real European airport serving around 12 million passengers per year (in 2019). The simulation model incorporates a new algorithm calculating the probability of spreading a virus (like COVID-19) via droplet, airborne or contact transmission during different airport travel processes along the travel chain. The algorithm considers different infection situations and incidence values and allows for a quantification of infection risks per individual simulated passenger. Based on the output of the simulations of the process chain in combination with that algorithm we can show the effectiveness of measures like social distancing and their consequences to minimize contamination risks along travel processes at airports. The paper describes the modelling, the algorithm to calculate contamination risks, as well as results and findings of the simulation runs. It will show how contamination risks, capacity, waiting times and waiting space are affected. This will provide airport operators with decision support for challenges arising from the need to be prepared for the next pandemic.
Post-Pandemic Impact Analysis for Airport Processes From Security to Boarding 35
INTRODUCTION
The COVID-19 pandemic globally affected the complete transport sector and especially passenger air transport with nosediving traffic numbers, wide- ranging travel restrictions and long-lasting uncertainties (see IATA, 2020). As air travel starts to recover cautiously from severe losses of traffic volu- mes over the pre-pandemic year 2019 and travel restrictions are relaxing, air transport providers have to ensure that passengers as well as people wor- king within the air transport sector will remain safe and be prepared for the next Pandemic. For Example, the World Health Organisation (WHO) warns against arboviruses as having the potential to spark the next epi- demic and it might only be a question of time when the next pandemic will rise (Balakrishnan, 2022). Airports need to prepare to cope with the next pandemic efficiently and effectively. For this purpose, we develop a toolbox to analyse and evaluate operational measures along the process chain of travelling at an airport. This paper examines the contamination risks at airports covering the travel process from security checks to aircraft seat.
The paper describes the modelling, the algorithm to calculate contamina- tion risks, as well as results and findings of the simulation runs. It will show how contamination risks, capacity, waiting times and waiting space are affe- cted. This will provide airport operators with decision support for challenges arising from the need to be prepared for the next pandemic.
METHODS
In order to examine consequences resulting from changes in passenger mana- gement at airports we compare the results of simulation runs. In our study we examine the possibility of an infection by dint of simulation with the Pan- demic Simulation Model (Pandemic SiM). For this purpose, we advanced an earlier version of Pandemic SiM (Classen and Jung, 2022) that only covered the security check area by adding typical travel processes at a medium sized European airport from security check area to the aircraft seat. The simulation model incorporates a new algorithm calculating the probability of spreading a virus (like COVID-19) via droplet, airborne or contact transmission during different airport travel processes along the travel chain. The algorithm con- siders different infection situations and incidence values and allows for a quantification of infection risks per individual simulated passenger. Based on the output of the simulations of the process chain in combination with that algorithm we can show the effectiveness of measures like social dista- ncing and their consequences to minimize contamination risks along travel processes at airports.
In a first step we examine the behaviour of Pandemic SiM by simulating the original baseline traffic scenario and measure the contamination risks along the travel processes. In a second step we compare the resulting figures of the baseline with those of the Pandemic Scenario where we use social distancing with different distances of one meter and one and a half meter. In the follo- wing section we describe how we built and extended Pandemic SiM in detail and show what kind of protective measures are in the toolbox to be assessed.
The baseline that we used was elaborated and validated under pre-COVID-19 conditions in a former project (Jung et al., 2015) together with airport practitioners of an international medium sized Europe serving 12 million passengers p.a. (as of 2019). For modelling and simulating we use the simulation software Anylogic. It is a multi-methods simulation softw- are supporting system dynamic, discrete events and agent-based modelling. It is even capable of mixing these simulation methods within one model. The pedestrian library inside Anylogic that is responsible for the pedestrian flow inside the airport and aircraft is a social force model based on the ideas of (Zainuddin et al., 2010) to simulate the pedestrian dynamics inside the simu- lation. We tailored and extended the behaviour of the library in combination with agent-based modelling to fit both general and local conditions of the air- port process chain. Based on operational observations we developed a queue selection algorithm for the security lanes that matched the simulation with the real behaviour of passengers in waiting queues and before the security che- cks. The Simulation maps the process chain from a passenger arriving in the terminal, entering security waiting area through boarding pass checkpoint, queuing and waiting before security checks, divesting at entrance of security check, the security check procedure as such with appropriate re-inspection rate, both for passenger and hand luggage, until leaving the security check area. We then completed the modelled travel process by incorporating pas- senger movement through the terminal from the reclaim of security to the waiting gate, the waiting time at the gate and boarding process until all pas- sengers of the considered flight are seated. For the traffic scenario we selected a representative day of operations with well over 80% utilization of the air- port infrastructure and with two peaks with a slight overload. The traffic scenario represents a real day’s flight plan (16 March 2015) of the menti- oned airport stating the schedule of the flights, the number of passengers booked on every flight, opening periods of every security lane and the pro- cess times per security lane. In sum the traffic scenario runs from 1:00 am to 15:30 pm – representing the critical operational times in terms of capa- city and operational workload for the considered terminal – and comprises 4,936 passengers booked on 54 flights. This input data was received from the European airport described above. Also, the terminal layout is based on this real airport. We aggregated the scenario inputs and parameters in an Excel table from where it is dynamically fed into the simulation. The arrival distribution of passengers per flight is based on passenger survey data and historical observed patterns. The process parameters, e.g. details of the hand luggage handling, conveyer speed and also re-inspection rates, are based on (Alers et al., 2013).
ALGORITHM TO CALCULATE CONTAMINATION RISKS In order to calculate the contamination risk, the algorithm applied in the Corona Warning App (CWA) is used which combines insufficient distance and duration of distance underrun (CWA, 2023).
Post-Pandemic Impact Analysis for Airport Processes From Security to Boarding 37
The Corona Warning App is an application for smartphones published by the Robert Koch Institute (RKI), which is intended to help track and inter- rupt infection chains of the Corona virus in Germany. It is available for both Android systems from version 6 and iOS from version 12.5 and can be downloaded and installed on smartphones via corresponding download options of the App Store and Google Play for the respective systems. The app is based on technologies with a decentralized approach and informs people when they have been in contact with an infected person. This means that if the user gets too close to other people, pseudonymous codes are exchan- ged via Bluetooth and stored in the app. As soon as an encounter in the last 14 days anonymously reports a positive test result, the user is warned. The data transfer between users to be logged is done via Bluetooth wireless tech- nology using the Exposure Notification Framework (ENF) (Apple&Google, 2023) as an interface. The ENF was developed by Apple Inc. and Google as a protocol specification to facilitate digital contact tracking during the COVID-19 pandemic. All detection events are captured internally by the fra- mework and divided into so-called “exposure windows”, representing all cases where another specific device (with no known identity) was detected within a 30-minute time window. Each of these exposure windows contains the following information (CWA, 2022): infectiousness and report type - these parameters are appended to the respective diagnosis code by the sending app to determine the infectiousness of a COVID-19 infection.
day of the exposure - this parameter is determined by the ENF based on the time when the respective Rolling Proximity Identifier (RPI) was received. It should be noted that exact timestamp information is available in the ENF, but only the tag itself is specified.
multiple scan instances - this parameter represents events where the other device was actively identified during the scan. A scan instance consists of “seconds since last scan”, i.e. how long the other device was identified, and attenuation information as a measure of the distance between the devices.
For determining whether the contact captured in the exposure window of the ENF is classified as a risk contact, a risk calculation is performed that consists of the duration of the contact, the signal attenuation for distance calculation, and the transmission risk level (TRL) estimated based on the time of upload of the identification keys and the indication of the day of first symptoms.
The following parameters apply to the weighting of a signal for the signal attenuation. Times with an attenuation <63 dB are weighted with 80%. Times with an attenuation >= 63 dB and <73 dB are weighted with 100%. And times with attenuation >= 73 dB and <79 dB are weighted with 10%. Times with attenuation >79 dB are not considered. This results in a sum product for calculating the signal weighting.
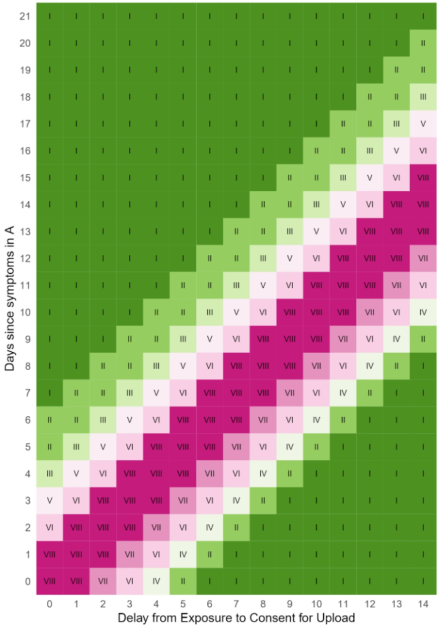
In addition, the transmission risk level (TRL) is determined (CWA, 2022). The respective risk level can be derived from the table in Figure 1. It considers the risk contacts of the past 14 days in relation to infection incidence and the symptoms of the user of the Corona Warning app within the past 21 days. In case a user enters a positive test result and the time of first symptoms in
the CWA the individual transmission risk for all contacts recorded in the last 14 days is computed. As an example, we assume that a user has received a positive PCR test 4 days after the first symptoms and it is immediately entered in the CWA. Then, in the row labeled 4, for the number of days since the first symptoms, it can be directly read which TRL the contacts had on the respective days of the previous two weeks. Thus, contacts recorded directly on the current day have a TRL of 3, for the day before the TRL is 5, for two days before the TRL is 6. For the period of 4–6 days before the test result was entered, the transmission risk has the highest value of 8. From the 7th day on, the TRL decreases again until it reaches the value 1 as a minimum at 10 days before.
The TRL determined in this way is then used to derive a further factor for determining the risk assessment, the Transmission Risk Value (TRV). This value can then be read from the following Table 1.
Table 1. Transmission risk value dependant on TRL.
Post-Pandemic Impact Analysis for Airport Processes From Security to Boarding 39
The “risk_value” will the describe whether a recorded encounter is a risk contact or not. This value is calculated from the sum of the produ- cts between the contact duration and the attenuation, the signal weigh- ting thus determined. It is then multiplied by the transmission risk value determined as described above. This then results in the following for- mula for determining the risk contact in the CWA, where count(K) corre- sponds to the number of encounters with a contact in an exposure window (i.e. within 30 minutes).
[Equation or mathematical symbol available in the original paper PDF]
Equation reproduced from the original PDF.
count (K)= Encounter count ti = Encounter duration att = attenuation TRV = Transmission Risk Level (TRL) to Value (TRV)
If this value is 9 or greater, it was an encounter with a high risk of infe- ction. If the value is between 5 and 9 this encounter is considered a low risk encounter. If the value is less than 5, this contact is interpreted as a non-risk encounter.
For the determination, the flow of people in the terminal and in the aircraft cabin is simulated and extended with an algorithm for a pseudonymous mes- sage exchange (so-called code_shares), based on the description of the CWA. It is reasonable to assume that there is a causal relationship between the num- ber of code_shares and the detection of risk contacts. If fewer warnings are generated in the CWA from fewer captured code_shares, this will in turn sug- gest fewer risk contacts. Generated code_shares are stored in the database in the following list format for further evaluation: [(sim_time), (Pax_ID_1), (Pax_ID_2), (dist), (run_nr)]
sim_time : simulation time at which the code_share occurred.
Pax_ID_1 and Pax_ID_2: passengers involved in the code_share.
dist : distance between passengers.
class : in which simulation module the code_share took place.
SIMULATION RUNS As a first step, we simulated the original baseline traffic scenario that we called “doNothing-scenario” without any restrictions or pandemic influe- nces to analyse waiting times and possible infections along the travel chain. Based on this we created two example scenarios to show the capabilities of PandemicSim by calculating and comparing contamination risks, wai- ting space in dependence on different restrictions and procedural changes. In the two scenarios we implemented the requirements from the “guidance
for the management of air passengers and aviation personnel in relation to the COVID-19 pandemic” (EASA, 2021) like in Classen and Jung, 2022. For the boarding procedure we introduced an additional measure that passen- gers receive oxygen masks as soon as they are seated in their designated seat inside the aircraft to prevent further infections during the flight. The- refore, the exchange of warning messages stops as soon as a passenger is at his seat in the aircraft. We simulate boarding of an Airbus A320 aircraft with a typical configuration of 180 seats in 30 rows and an occupancy of 158 passengers. The two scenarios differ in the social distancing. One scenario requires a distance of 1.0 meter and the other scenario requires 1.5-meter distance.
Following the experience of our previous simulation runs (Classen and Jung, 2022) we had to massively increase waiting areas to large parts of the terminal in order to meet capacity requirements. In the “doNothing” scena- rio a passenger has usually occupied a circle shaped area with a radius of 0.5m resulting in a space consumption of 0.2 m2 per simulated passenger. This approximates an elliptic form with a diameter of 0.3 m for the flat side and 0.5 m for the wide side (Weidmann, 1993). For the “1.0 m” distance scenario we used an elliptic of pure body radius of 0.25 m plus 0.5 m sup- plemental distance, which is half the required social distance of 1 m and for the Scenario “1.5 m” 0.25m + 0.75 m. This is sufficient provided that two persons “meeting” in the simulation are each surrounded by half the requi- red distance which adds up to the full required minimum distance in each scenario.
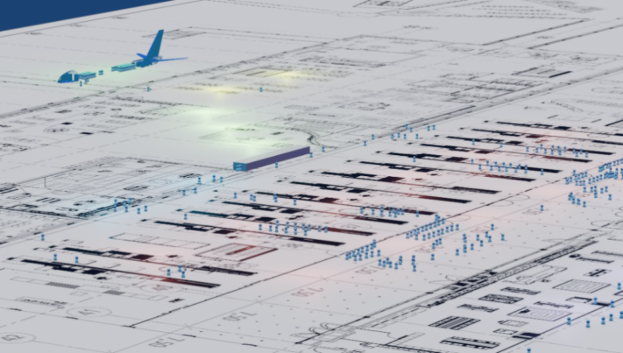
Figure 2 shows a screenshot of a 3D-Animation of the simulation that we created for validation. With the floor plan of the simulated security area and adjoining areas of the airport and the aircraft at the gate. The lower part of the figure depicts the increased waiting area upstream of the main security waiting area and the security check lines. Blue dots are representing simulated passengers.
Figure 2: Screenshot of the simulation.
Post-Pandemic Impact Analysis for Airport Processes From Security to Boarding 41
RESULTS
Initial trial simulations showed significantly higher space requirements. To even accommodate the two new social distancing scenarios in the simulation we had to increase the size of the waiting area in front of the security. In the “1.0 m” scenario the area was enlarged by about 60% from 950 m2 to 1,500 m2 and in the “1.5 m” scenario by 90% from 950 m2 to 1,800 m2 to be able to handle the traffic load of the respective scenario.
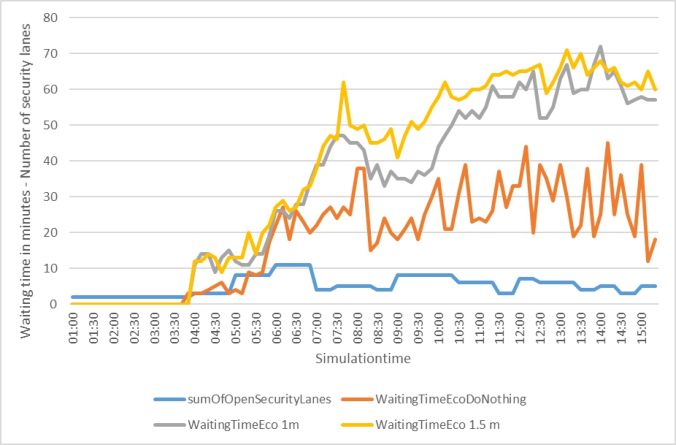
The simulation results show significant higher waiting times for the pan- demic scenario. Figure 3 shows a comparison of the average total process times – from entering the queue at the security until leaving the security area – of the three simulation runs where we used the original baseline traffic scenario in all simulations. It illustrates the total average results of 30 Monte Carlo simulation runs with a rather small standard deviation of 1.6. The baseline scenario represented with the orange line shows the typical waiting time peaks between 5:00 - 7:30 and 9:30 – 11:00 and also around 13:00.
This matches well the real-world experiences of the airport employees during real operations of the simulated airport. The “1.0 m” scenario is shown in gray and “1.5 m” scenario in yellow. The graphs match the peaks but both can not absorb the second peak so that the waiting times stay high until 14:20. For comparability reasons, we kept the number of active secu- rity lanes in all scenarios at same levels (see blue line). The average waiting times of the simulated passengers in the baseline scenario is 18.4 minutes and increases to 33.81 minutes in the “1.0 m” and 37.9 minutes in the “1.5 m” scenario.
The number of exchanged Messages to calculate the contamination risk is 24,204 in the “DoNothing” scenario, 11,879 in the “1.0 m” and 13,059
Figure 3: Comparison of the total process times.
in the “1.5 m” scenario. At first glance, the figures seem relatively high, but on closer inspection, the high values can be well explained. The messages are exchanged every 30 Seconds. In our Simulation we incorporate persons who are allowed to stay closer to each other, e.g. families. For this purpose, we applied a passenger segmentation with real historic data from our baseline traffic scenario and we used an agent-based mapping of the simulated pas- sengers. Attributes of each passenger are assigned on an individual basis in our model. In this way exemptions of the distance rules are incorporated on a realistic basis. For example, a family of four persons waiting 40 Minutes at the security already exchange 320 Messages. It was interesting for us to see that there are more messages exchanged in the “1.5 m” scenario than in the “1.0 m” scenario. We expected the opposite. Reason for this is a longer exposure of passengers with potential vectors due to longer waiting times at security check in the “1.5 m” scenario.
CONCLUSION
In this paper we investigated the potential of using simulation to provide a toolbox for airport operators with decision support for challenges arising from the need to be prepared for the next pandemic. We compared the results of simulation runs in order to examine the consequences resulting from chan- ges in passenger management and pandemic measures at airports as well as to assess contamination risks in the airport travel chain. This will provide airport operators with decision support for challenges arising from the need to be prepared for the next pandemic. The simulation results show significant higher waiting times for the pandemic scenario as average waiting times are up to 149% higher than in the baseline scenario. Space requirements increase, as waiting areas in the simulated model need to expand by up to 90%. Our results also show that it is important to keep process times as short as possible in order to reduce contamination risk and potential exposure. Higher process times – on the other hand – lead to higher vulnerabilities through increased infection opportunities when many passengers are waiting in a queue.
As a consequence, this will put airports under stress where space limits do not allow for the necessary enlargement of waiting areas and will also cause higher cost for airport operators. An improvement potential to reduce waiting times could be a higher number of opened security lanes which again results in higher cost.
One next step in our research and modelling therefore will be to involve the optimization software OptQuest in the model and to determine an optimum resource management by balancing waiting times and operating cost. It also seems worthwhile to dive deeper into the data and to analyse where and when most infections take place as well as to incorporate incoming and transfer passengers in the simulation model for further research.
REFERENCES
Alers, T., Kellner, S. & Classen, A. More input-generic data for microscopic airport simulation. 2013 Aviation Technology, Integration, and Operations Conference, 2013. 4208.
Post-Pandemic Impact Analysis for Airport Processes From Security to Boarding 43
Available: https://blog.google/documents/69/Exposure_Notification_-_Cryptogr aphy_Specification_v1.2.1.pdf/ [Accessed 05.2023 2023]. Balakrishnan, V. S. 2022. WHO launches global initiative for arboviral diseases. The Lancet Microbe, 3, e407. Classen, A. B. & Jung, M. Pandemic SiM-Impact analysis and improvement poten-
tials for pandemic airport security processes. Human Interaction and Emerging Technologies 2022: Proceedings of the 8th International Virtual Conference on Human Interaction and Emerging Technologies, IHIET 2022, 2022. Springer Nature. CWA. 2022. Epidemiological Motivation of the Transmission Risk Level [Online].
Available: https://github.com/corona-warn-app/cwa-documentation/ [Accessed 05.2023 2023]. CWA. 2023. Available: https://www.coronawarn.app/de/ [Accessed 2023]. EASA 2021. Aviation Health Safety Protocol. Operational Guidelines for the Management of Air Passengers and Aviation Personnel in Relation to the COVID-19 Pandemic. 2021. Cologne. IATA. 2022. Impact of COVID-19 on European Aviation [Online]. Availa-
ble: https://www.iata.org/contentassets/2dc66fdff10d455a84535184d206d132/ covid-europe-june2020.pdf [Accessed 05.2023 2023]. Jung, M., Classen, A. B. & Rudolph, F. 2015. Creating and validating a microscopic pedestrian simulation to analyze an airport security checkpoint. Weidmann, U. 1993. Transporttechnik der fußgänger: transporttechnische eigensch-
aften des fußgängerverkehrs, literaturauswertung. IVT Schriftenreihe, 90. Zainuddin, Z., Thinakaran, K. & Shuaib, M. Modification of the social force model for pedestrian dynamic using a dynamic respect factor. International Conference on Intelligence and Computing (ICINC 2010), 2010, 313–315.
Read this individual research paper free through the original publisher, or explore the full digital proceedings book.
ISBN 978-1-958651-87-2
Explore this ISBN in the AHFE Bookstore ↗Listed in the July 2026 bookstore catalogue; search by ISBN to confirm current availability · Digital book purchase optional