Martin Jung, Florian Rudolph, Axel Classen (2024). Coupled passenger simulation to optimise the turnaround process and passenger flow. In: Human Systems Engineering and Design (IHSED2024): Future Trends and Applications. AHFE Open Access, vol. 158, pp. 308–316. https://doi.org/10.54941/ahfe1005554
The turnaround process at an airport is a crucial part of flight operations. It is a precisely choreographed sequence of activities and events to ensure aircraft depart on schedule. The individual turnaround processes with passenger movements of boarding and deplaning play a pivotal role, as they are on the critical path of the turnaround. Delays in any of these processes have an immediate impact on the duration of the entire process. If the delay is long enough to cause the flight to miss its scheduled departure slot, the delay will increase even more as a new available slot must be allocated. This in turn will cause further delay. Nevertheless, individual processes in the terminal and within the aircraft cabin are already operating at their local optimum. Our approach is to couple a passenger flow simulation of an airport terminal with a boarding simulation of an aircraft cabin. Aim of this coupling is to investigate how possible developments and restrictions in one of these areas can affect the overall process of the passenger's travel chain. In addition, this coupled simulation can be used to asses, in the long term, whether measures that can already be prepared in the terminal can help make cabin boarding more efficient.For this purpose, we developed a toolbox to analyse and evaluate operational measures along the process chain of travelling at an airport. This paper covers the travel process from security checks to aircraft seat. For this purpose, we refined and coupled an earlier version of a simulation that only covered the airport security check area by adding typical boarding processes of a medium sized international airport. The model is based on a real European airport serving around 12 million passengers per year (as of 2019). The simulation model incorporates a new algorithm calculating the passenger density and contact rate for each passenger in terms of their time and space requirements. Based on the output of the simulations of the process chain in combination with our algorithm we can show the effectiveness of measures like social distancing and their consequences to minimize contact rates along travel processes at airports. The paper describes the modelling, the algorithm to calculate the passenger density and contact rate, as well as results and findings of the simulation runs. It will show how passenger density, capacity, waiting times and waiting space are affected. Finally, we depict the technical visualisation resulting from the coupling of the simulations. For this purpose, common interfaces are defined and parameterised in order to enable a standardized import to a downstream visualisation software. The holistic simulation is used to simulate a wide range of process optimisations and define their impact on the entire process.
Coupled Passenger Simulation to Optimise the Turnaround Process and Passenger Flow 309
INTRODUCTION
The turnaround process at an airport is a crucial part of flight operations. It is a precisely choreographed sequence of activities and events to ensure aircraft depart on schedule. The individual turnaround processes with passenger movements of boarding and deplaning play a pivotal role, as they are on the critical path of the turnaround. Our approach is to couple a passenger flow simulation of an airport terminal with a boarding simulation of an aircraft cabin. Aim of this coupling is to investigate how possible developments and restrictions in one of these areas can affect the overall process of the passenger’s travel chain. In addition, this coupled simulation can be used to assess whether measures that can be prepared in advance in the terminal can help to make cabin boarding more efficient in the long term. To this end, we developed a toolbox to analyse and evaluate operational measures along the process chain of travelling at an airport. This paper covers the travel process from security checks to aircraft seat. For this purpose, we refined and coupled an earlier version of a simulation that only covered the airport security check area by adding typical boarding processes of a medium sized international airport. The model is based on a real European airport serving around 12 million passengers per year (as of 2019). The simulation model incorporates a new algorithm calculating the passenger density and contact rate for each passenger in terms of their time and space requirements. The paper describes the modelling, the algorithm to calculate the passenger density and contact rate, as well as results and findings of the simulation runs. Finally, we depict the technical 3D visualisation of the simulation.
METHODS
To investigate the implications of modifications in airport passenger operations, we compared the outcomes of various simulation runs. For the development of the simulation framework, we augmented an earlier passenger simulation model of the security check at a European airport under restrictions during the Corona pandemic, the Pandemic Simulation Model “Pandemic SiM” (Classen et al., 2022) that only covered the security check area by coupling the simulation of a typical boarding processes of a medium sized European airport. Now we implemented a new algorithm in the simulation model that enables us to quantify the crowd density and contact rate of each simulated passenger from an individual perspective. This algorithm is an enhanced version of the algorithm calculating the probability of spreading a virus (like COVID-19) inside the simulation which is described in detail in Jung et al. (2023). Together with the capacity values of the simulation, this algorithm allows to assess the effectiveness of measures such as social distancing and other procedural changes along the travel chain. We will show how capacity, density, waiting times and waiting space are affected.
Three simulation scenarios were created for analysis and evaluation. The first scenario is a baseline scenario with process times and regulations that were in common use prior to the pandemic. The resulting values were then compared to two pandemic scenarios with social distancing and the corresponding regulations. In these scenarios, social distancing is simulated
with two different distances of one metre and one and a half metres. The basic scenario itself was empirically developed in earlier works (Jung, 2015) under the conditions before the COVID-19 pandemic and validated together with airport employees at an international medium-sized European airport serving 12 million passengers per year (as of 2019). For modelling and simulating we use the simulation software “Anylogic”. It is a multi-methods simulation software supporting system dynamic, discrete events and agent- based modelling. It is even capable of mixing these simulation methods within one model. The pedestrian library inside Anylogic that is responsible for mapping the pedestrian flow inside the airport and aircraft is a social force model based on the principles of Zainuddin et al. (2010) to simulate the pedestrian dynamics inside the simulation. We tailored and extended the behaviour of the library in combination with agent-based modelling to fit both general and local conditions of an airport’s process chain. The simulation maps the process chain of a passenger arriving in the terminal, entering security waiting area through boarding pass checkpoint, queuing and waiting before security checks, divesting at entrance of security check, the security check procedure as such with appropriate re-inspection rate, both for passenger and hand luggage, until leaving the security check area. We then completed the modelled travel process by incorporating passenger movement through the terminal from the reclaim at the security checkpoint to the waiting gate, the waiting time at the gate and boarding process until all passengers on the flight in question are seated. For the traffic scenario we selected a representative day of operations with well over 80% utilization of the airport’s infrastructure and with two peaks with a slight overload. The traffic scenario represents a real day’s flight plan (16 March 2015) of the above-mentioned airport stating the schedule of the flights, the number of passengers booked on every flight, opening periods of every security lane and the process times per security lane. In sum the traffic scenario runs from 1:00 am to 3:30 pm – representing the critical operational times in terms of capacity and operational workload for the considered terminal – and comprises 4,936 passengers booked on 54 flights. Also, the terminal layout is based on this real airport. We aggregated the scenario inputs and parameters in an Excel table from where it is dynamically fed into the simulation. The arrival distribution of passengers per flight is based on passenger survey data and historical observed patterns. The process parameters, e.g. details of the hand luggage handling, conveyer speed and also re-inspection rates, are based on Alers et al. (2013).
Algorithm for Calculating Crowd Density and Contact Rate To calculate the contact rate and crowd density, we implemented and enhanced the algorithm for determining Coronavirus disease risk encounters. The algorithm consists of a combination of insufficient distance and the duration of the undercut distance, and is used in the German Corona-Warn- App (CWA, 2023) in the simulation. The Corona-Warn-App (CWA) is an application published by the Robert Koch Institute (RKI), which is designed to help trace and interrupt chains of infection of the corona virus in Germany.
Coupled Passenger Simulation to Optimise the Turnaround Process and Passenger Flow 311
Based on decentralised technologies, the app will let people know if they have been exposed to an infected person. This means that pseudonymised codes are exchanged via Bluetooth and stored in the app when the user comes too close to other people. As soon as an encounter in the last 14 days anonymously reports a positive test result, the user is warned.
Data is exchanged between users via Bluetooth by using the Exposure Notification Framework (ENF) as the interface. The ENF was developed by Apple Inc. and Google (Apple et al., 2023) as a protocol specification to facilitate digital contact tracing during the COVID-19 pandemic. All detection events are recorded internally by the ENF and divided into so-called “exposure windows”, which represent all cases in which another specific device (without a known identity) was detected within a 30-minute window. Each of these exposure windows contains the following information (Apple et al., 2023):
infectiousness and report type - these parameters are appended to the respective diagnosis code by the sending app.
day of the exposure - this parameter is determined by the ENF based on the time at which the respective identification key (Rolling Proximity Identifier - RPI) was received. It should be noted that although the ENF contains precise timestamp information, only the day itself is specified.
multiple scan instances - this parameter stands for events in which the other device was actively identified during the scanning process. A scan instance consists of “seconds since last scan”, i.e. how long the other device was identified, and attenuation information as a measure of the distance between the devices.
To determine whether the contact recorded in the exposure window of the ENF is to be classified as a risk contact, a risk calculation is carried out, which is made up of the duration of the contact, the signal attenuation for distance calculation and the transmission risk level (TRL). The following signal attenuation rules apply to the weighting calculation of a signal as an indicator of the distance. Times with an attenuation < 63 dB are weighted at 80%. Times with an attenuation >= 63 dB and < 73 dB are weighted at 100%. And times with an attenuation >= 73 dB and < 79 dB are weighted at 10%. Times with an attenuation > 79 dB are not considered.
To determine the contact rate and the density, the entire flow of people in the terminal and in the aircraft cabin is simulated and extended with an algorithm for a pseudonymous message exchange (so called code_shares), which is based on the description of the CWA above. The generated code_shares were saved in a database in the following list format for further analysis and visualisation:
Id: Id of the data record
sim_time: Simulation time at which the code_share took place.
pax_ID_1 and pax_ID_2: passengers involved in the code_share
milestone_pax_1 and milestone_pax_2 Process milestone according to Rudolph et al. (2022)
dist: Distance between the passengers.
XY Coordinates of pax_1 and pax_2.
run_nr: Number of the simulation run.
module: Simulation module in which the code_share was generated.
This database record is used to calculate the density, contact rate and the 3D visualisation, which we will describe in detail later in this paper.
SIMULATION RUNS First, the original baseline was simulated as a “do-nothing scenario” without any restrictions in order to minimise waiting times and possible contacts along the travel chain. Based on this, two scenarios were created to demonstrate the capabilities of the enhanced Pandemic SiM by calculating and comparing contacts and waiting times depending on various restrictions and procedural changes. In the two scenarios, we implemented the EASA requirements described in (EASA, 2021) - as described in detail in Classen et al. (2022). An Airbus A320 aircraft with a typical configuration of 180 seats in 30 rows and an occupancy of 158 passengers was used for the boarding simulation. The two scenarios differ in terms of social distancing by one metre and one and a half metres respectively. Based on experience from previous studies (Classen et al., 2022), we had to massively enlarge the waiting areas in large parts of the terminal in order to fulfil the necessary capacity requirements. In the baseline scenario, a passenger usually occupies a circular area with a radius of 0.5 m, which results in an area consumption of 0.2 m2 per simulated passenger. This roughly corresponds to an elliptical shape with a diameter of 0.3 m for the flat side and 0.5 m for the wide side (Weidmann, 1993). For the first pandemic scenario with a distance of one metre, we used an ellipse with a pure body radius of 0.25 m plus 0.5 m additional distance, which corresponds to half the required distance of 1 m, and for the second pandemic scenario of one and a half metres corresponding to 0.25 m plus 0.75 m additional distance. This is sufficient, as two people interacting with each other in the simulation are each surrounded by half of the required distance, which then adds up to the full minimum distance required.
SIMULATION RESULTS As might be expected, the two pandemic scenarios required significantly more space. The waiting area in front of the security checkpoint had to be significantly enlarged. In the pandemic scenario with a distance of one metre, the area was increased by around 60% from 950 m2 to 1,500 m2
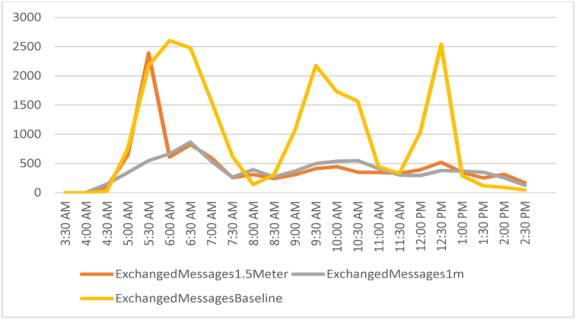
and in the pandemic scenario with a distance of one and a half metres by 90% from 950 m2 to 1,800 m2 in order to cope with the traffic load of the respective scenario which we already showed in Jung (2023). Figure 1 shows the number of exchanged messages inside the simulation over time. This means that the more messages are exchanged, the more densely the area of the terminal is utilized.
The base scenario, represented by the yellow line, shows the exchanged messages peaks between 5:00 - 7:30, 8:30 – 10:30 and around 12:00. This
Coupled Passenger Simulation to Optimise the Turnaround Process and Passenger Flow 313
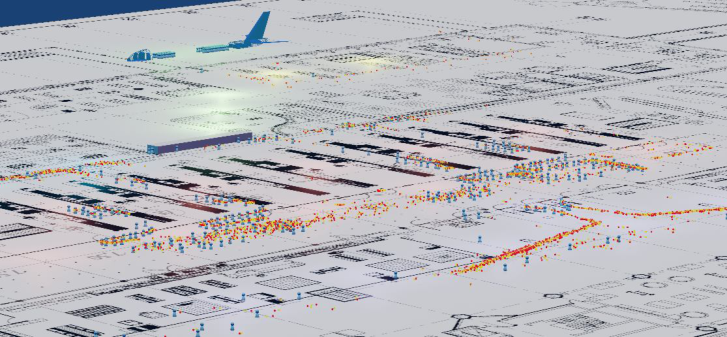
also corresponds to the experience of airport employees in real operations. The pandemic scenario with a distance of one metre is shown in grey and the pandemic scenario with a distance of one and a half metres is shown orange. For the sake of comparability, we have kept the number of active safety lanes at the same level in all scenarios. Looking at the entire simulation period, high densities and a high number of code_shares can be observed, particularly at the queues of individual service stations. A total number of 22,127 code_shares were recorded in simulation runs without a distance specification. When a distance of at least 1 metre was specified, the code_shares fell to 8,497, but increased again to 10,172 when a distance of 1.5 metres was specified. It is interesting to note that although the number decreased as expected when certain distances were specified, this effect was partially compensated for as the specified distance has a negative impact on process times. This is particularly noticeable in the pandemic scenario with 1.5 m distance (orange line) in the first peak. There are very long queues at the entrance to the security checkpoint, which leads to a lot of exchanged messages. This behavior can also be observed in the visualization snapshot of the simulation (see Figure 4 in the next chapter). In the bottom right corner, the entrance area towards the security checkpoint shows a high crowd density and a high number of code shares (code_shares light up as red (sender of message) and yellow (receiver of a message)).
Figure 1: Number of exchanged messages inside the simulation over time.
At first glance, the number of code_shares seems relatively high, but on closer inspection the number can be easily explained. The messages are exchanged every 30 seconds. In our simulation, we include people who may be closer together, such as families. For this purpose, we have segmented the passengers with real historical data from our traffic scenario and used an agent-based mapping of the simulated passengers. The attributes of the individual passengers are assigned individually in our model. In this way, exceptions to the distance rules are taken into account on a realistic basis.
For example, a family of four waiting 40 minutes at the security checkpoint already exchanges 320 messages.
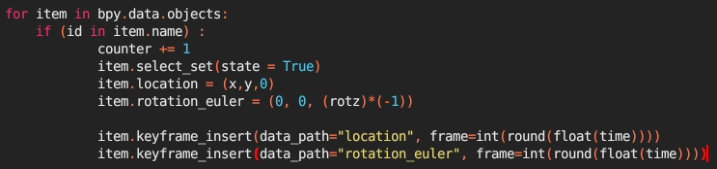
VISUALISATION In addition to the arithmetic evaluation, the simulation software also offers the option of exporting the results of the simulation runs. This allows the exact location (XY coordinates) and direction of the passengers, as well as the positions of the code_shares, to be stored over time. This data can be imported into visualisation and animation software such as Blender (Blender, 2024) in order to provide visual feedback and to identify vulnerable points in the airport terminal and within the aircraft. For this purpose, vectors are generated from the coordinates and directions of the simulated passengers over time using so-called keyframes, which then provide a movement path of the object. Keyframes are anchor points in the animation. Intermediate steps are interpolated between the respective keyframes. This import can be easily realised using the Python scripting language integrated in Blender. Figure 2 shows the code for creating the keyframes with item.keyframe_insert. These anchor points are created twice. Once for the position (location) and once for the orientation of the object (rotation_euler).
Figure 2: Code snippet for importing passenger positions and direction.
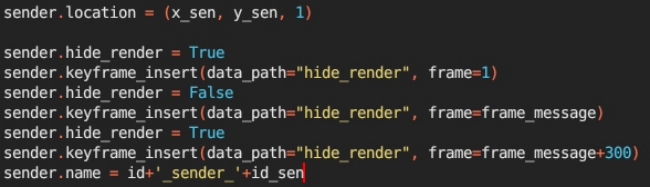
The position and direction of the object is set via item.location and item.rotation_euler. The import of code_shares can be implemented in a similar way. The resulting temporary visualisation is also solved via keyframes and the use of the hide_render parameter, as shown in Figure 3.
Figure 3: Code snippet for temporary visualisation of the code_shares.
Coupled Passenger Simulation to Optimise the Turnaround Process and Passenger Flow 315
Once the import is complete, a three-dimensional animation can be generated from this, allowing any area of the scenario to be visually examined in more detail in terms of space requirements and the code_shares. Finally, the virtual camera is then aligned to the areas of interest in order to generate a video of the scenario.
Figure 4 shows a sample image of the animation video created in this way, showing in the bottom right the access area in front of the security checkpoint and above that the security check area. The background (top left) shows the aircraft to be boarded.
Figure 4: Visualisation of a simulation run.
The individual passengers are shown in blue and detected code_shares light up as red (sender of message) and yellow (receiver of a message) balls between the passengers. It is easy to see how passengers standing in the queue in front of the security check exchange code_shares with each other.
CONCLUSION AND OUTLOOK This paper analysed the potential of using coupled passenger flow simulations as a decision-support tool for turnaround processes at airports. The results of various simulation runs were compared with the aim of identifying the effects of changes in passenger management at airports. The entire process chain at the airport was analysed, from entering the security all the way to the aircraft seat. Furthermore, a new algorithm to calculate crowd density and contact rates inside the simulation was developed. This enables us to see bottlenecks from an individual passenger perspective, showing how often they have to pass through or wait in densely populated areas and bottlenecks on their way through the airport. We showed how we use 3D visualisation and data analysis of the simulation results to provide a deeper analytical view to identify where and when bottlenecks with high densities and increased infections risks occur. Based on the analysis of the process chain in combination with our algorithm we can show the effectiveness of measures like social distancing and their consequences to minimize contact
rates along travel processes at airports. In this way, the area in front of the security checkpoint was identified as a particularly busy area. Our results also show that it is important to keep process times as short as possible in order to reduce overcrowding and also the contact rate for each passenger in terms of their space requirements. All this contributes to a proper turnaround process of the aircraft.
The next step in our model development is to incorporate machine learning optimisation procedures (reinforcement learning) in order to determine optimal resource management by balancing waiting times and operating costs. We also want to incorporate incoming and transfer passengers as well as baggage handling systems in the simulation model for further research. Another focus of the development will be the reduction of energy consumption inside terminal buildings to foster sustainable airport operations.
Available: https://blog.google/documents/69/Exposure_Notification_-_Cryptogr aphy_Specification_v1.2.1.pdf/ [Accessed 05.2024]. blender.org - Free and Open 3D Creation Software https://www.blender.org/ [Accessed 2024]. Classen, Axel B., Jung, Martin. Pandemic SiM-Impact analysis and improvement
potentials for pandemic airport security processes. Human Interaction and Emerging Technologies 2022: Proceedings of the 8th International Virtual Conference on Human Interaction and Emerging Technologies, IHIET 2022, 2022. Springer Nature. CWA. 2023. Available: https://www.coronawarn.app/de/ [Accessed 2024]. EASA 2021. Aviation Health Safety Protocol. Operational Guidelines for the Management of Air Passengers and Aviation Personnel in Relation to the COVID-19 Pandemic. 2021. Cologne. F. Rudolph, E. Grunewald, Erik, D. Tremer - Dividing Journeys in Milestones - A
passenger (agent) trajectory reference (Transport Research Arena 2022). Jung, Martin, Classen, Axel B. & Rudolph, Florian 2015. Creating and validating a microscopic pedestrian simulation to analyze an airport security checkpoint. Winter Simulation Conference 2015. Jung, Martin, Classen, Axel B., Post-Pandemic Impact Analysis for airport
processes from security to boarding – How to respond the next pandemic. Human Interaction and Emerging Technologies 2023: Proceedings of the 10th International Conference on Human Interaction and Emerging Technologies, IHIET 2023, 2023. Springer Nature. Weidmann, U. 1993. Transporttechnik der Fußgänger: transporttechnische Eigenschaften des Fußgängerverkehrs, Literaturauswertung. IVT Schriftenreihe, 90. Zainuddin, Z., Thinkakaran, K. & Shuaib, M. Modification of the social force model for pedestrian dynamic using a dynamic respect factor. International Conference on Intelligence and Computing (ICINC 2010), 2010. 313–315.
LISTED IN THE AHFE DIGITAL BOOKSTORE CATALOGUE
Explore the complete digital volume
Human Systems Engineering and Design (IHSED2024): Future Trends and Applications
Read this individual research paper free through the original publisher, or explore the full digital proceedings book.
ISBN 978-1-964867-34-2
Explore this ISBN in the AHFE Bookstore ↗Listed in the July 2026 bookstore catalogue; search by ISBN to confirm current availability · Digital book purchase optional