Florian Rudolph, Martin Jung, Axel B. Classen (2024). Combining system dynamics and agent-based simulation to evaluate and visualise sustainable airport operations. In: Human Interaction and Emerging Technologies (IHIET 2024). AHFE Open Access, vol. 157, pp. 316–323. https://doi.org/10.54941/ahfe1005491
Facing the backdrop of the climate crisis, we are currently witnessing an intense transformation process in aviation. Aim of this process is a climate-friendly air transport system. In addition to aircraft manufacturers and airlines, airports also must contribute to this transition by improving their operations. A key objective of airport management is therefore to foster climate-neutral aviation and energy-efficient airport operations. European airports are committed to achieving these goals by 2050. An important contribution to achieving these objectives is to enable airport operators to draw informed operational decisions while balancing traffic impacts with economic and environmental aspects. Therefore, we regard an airport as a holistic system with various operational areas and stakeholders in which an overarching and coordinated management allows for targeted prioritisation, e.g. of sustainability parameters. This paper, therefore, presents a concept for combining different simulation techniques resulting in a comprehensive, integrated hybrid simulation model and visualization tool. For this purpose, we combine two simulation techniques, namely an agent-based network simulation that maps the Advanced Collaborative Decision-Making Concept (A-CDM) for joint decision-making at airports via state charts as discrete events with a flow simulation based on system dynamics. The flow simulation is intended to map energy consumption in relation to capacity utilisation in different functional areas. Combining the strengths of these two simulation types enables us to evaluate and analyse ecological and (macro-) economic effects as well as operational impacts on airports simultaneously. One of the main challenges lies in the connection and interaction between discrete events and dynamic system flows and therefore in the combination of micro- and macro-simulation. We describe how to solve this technical and logical challenge of integration and – with a first prototype – we show our ideas on how to visualize the results of this hybrid simulation for airport operators to provide substantial and situational decision support. Commonly used airport Key Performance Indicators (KPIs), which describe the operational performance of an airport, are set in relation to ecologic and economic KPIs in order to obtain a complete picture and thus enable holistic airport management. To this end, existing operational KPIs are supplemented by further dimensions mentioned above and their visualization is developed with a view to perceivability and conceivability in order to increase and maintain situational awareness. A current state of the art algorithm is presented on how to couple these different simulation approaches. Furthermore, an outlook is given on how new types of KPIs can be developed further by using the advantages of combining these simulation techniques. Our approach incorporates both environmental and economic parameters, enabling airport operators to correlate energy consumption with optimised airport management KPIs, such as flight punctuality, utilisation and cost of resources. This will contribute to a more comprehensive approach of airport management and promote sustainability. Finally, next steps in the implementation of this hybrid simulation and visualisation will be presented, and how it will contribute to informed decision-making in airport management by providing multi-dimensional evaluations in real time, thus fostering a climate-neutral aviation for our future.
Airports provide a complex infrastructure and many different players are active at the airport. We therefore view an airport as a holistic system with various operational areas and stakeholders in which an overarching and coordinated management allows for targeted prioritisation, e.g. of sustainability parameters. Consequently, there are many places where energy is used and CO2 is emitted.
In air traffic, standstill consumes resources and energy. At airports, this statement is not a contradiction in terms, as an aircraft waiting on the ground for the next process requires energy to keep engines, electronics and air conditioning running. The quicker an aircraft is able to take off again, the less energy it consumes at the airport. Therefore, a smooth flight is an energy- efficient flight. The formula sounds simple at first, but the forces behind it are complex process and coordination chains between all the system partners
Combining System Dynamics and Agent-Based Simulation 317
involved in flight management. This applies to the day-to-day interaction between airport operators, airlines, ground handling companies and air traffic control.
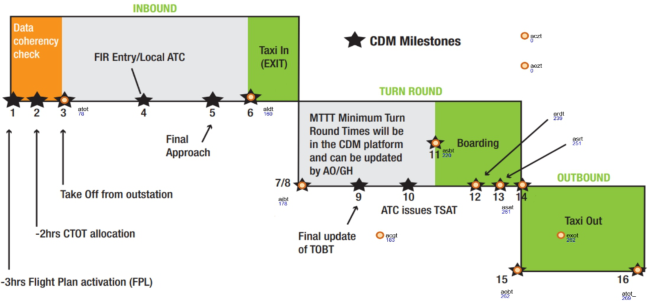
Airport Collaborative Decision Making Airport Collaborative Decision Making (A-CDM) (EUROCONTROL, 2017) is an operating principle that can help reduce energy consumption at the airport. The aim of A-CDM is to increase operational efficiency of airports by making aircraft turnaround processes faster and more predictable. This is achieved by the stakeholders at the airport (airport operators, airlines, ground handlers and air traffic control) and the network manager working together transparently and cooperatively in operations and exchanging relevant, accurate and timely information. A-CDM focuses on a series of selected milestones along a flight (arrival, landing, taxi in, turnaround, taxi out and take-off) where the partners involved change. This approach to the turnaround process tracks the progress of a flight through a continuous sequence of different events, called milestones. Rules are set for updating downstream information and the accuracy of estimates. Different Airport- CDM partners may be responsible for different milestones, with the aim of integrating all milestones into one common seamless process for each flight. The main objective of the milestone approach is to further improve the common situational awareness of all partners during all turnaround phases of each flight. An overview of the milestones relevant to the turnaround process is provided in Figure 1.
Figure 1: A-CDM-milestones.
Agent-Based Simulation of A-CDM Milestones Our approach combines two different simulation paradigms into a coupled simulation environment. This chapter describes the agent-based part of the simulation. The System Dynamics-based part is then described in the next chapter.
The task of the agent-based simulation is to map the A-CDM milestones on the basis of predicted scenarios and to evaluate them in terms of joint
decision-making by calculating key performance indicators (KPIs) such as punctuality, connectivity or throughput from the milestones (Schier et al., 2016). This agent-based simulation is complemented by a system dynamics simulation to map the energy consumption in the scenarios. The aim is to develop new indicators for evaluating energy efficiency.
The A-CDM simulation provides a continuously changing operational forecast of A-CDM milestones and maps them with modelling methods from software engineering, in this case as a state chart diagram as part of the Unified Modelling Language (UML) (Fowler, 2003). This is a general- purpose visual modelling language and is intended to provide a standard way to visualize the design of a system. A state chart diagram shows the states of a state machine that are permitted at runtime and specifies events that trigger its state transitions. A state chart diagram thus describes a hypothetical machine that is in exactly one state of a finite set of states at any given time. This automaton consists of states and transitions (Harel, 1986). In our case, each milestone is represented by a state in the diagram.
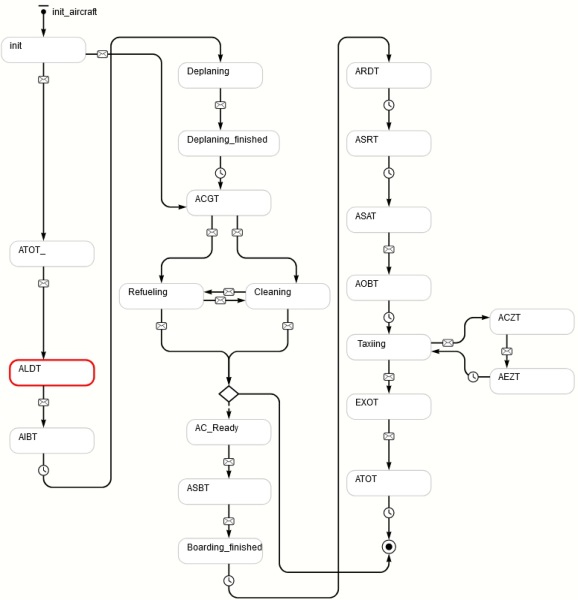
Figure 2: A-CDM milestones as state charts.
This kind of Modelling allows us to specifically map the dependencies between milestones. The processes in and around the aircraft during turnaround are implemented using a network model. This means that the topology of the airport is not considered. The various dependencies of
Combining System Dynamics and Agent-Based Simulation 319
turnaround and terminal processes are implemented via queues and process times. The relevant parameters to describe the airport are stored in an external data structure. They are read in at the start of the simulation. Those parameters include the flight plan, runway properties, aircraft stands, number of available ground handler teams, etc.. Based on the flight plan, the aircraft are created as simulation agents within the simulation upon approach or on the apron and move through the queue and process network until they leave the milestone simulation with their departure. Acting as a simulation agent, each aircraft has certain initialization parameters and individual control of the state chart diagram model for the aircraft’s A-CDM milestones (Figure 2).
The individual states of the aircraft are controlled via messages. If the aircraft reaches a certain process in the network simulation, a message is sent to the simulation agent. This triggers the transition to a new state. For example, if the aircraft has completed the landing process, the achievement of this milestone is attributed to the aircraft as an ALDT (Actual Landing Time) message. When this message is received, the aircraft is set to the corresponding status and the timestamp is saved and stored in an external data structure.
A diagram is generated for each aircraft to be handled (Figure 2) and the current process status is displayed. In this case, ALDT (Actual Landing Time) is the current status (marked by a red border). The status changes are triggered by a network simulation via messages. When an aircraft reaches a certain node in the network, it receives the message for the status change. If a milestone is reached as a status, this is stored in the object memory and can be made available to the management system from there.
The network model provides the geographical path-time interrelations as well as the queue processing at the corresponding neuralgic points where only sequential processing of aircraft is possible. In our simulation, the processing of the route network is separated from the queueing logic. The logic and interaction of the agents (in this case aircraft) is implemented with blocks of a modelling language, while the distances are read and recorded directly from the topology of the airport using a geo-information system. This combination of state charts and network simulation thus provides a digital twin for determining the A-CDM milestones. These milestones are generated for each simulated flight, broadcasted and stored during runtime and are immediately available to the management system. The following times are obtained as an example data set for a flight at the day of operations:
Table 1. Output of A-CDM milestones for each flight (example).
Our simulation environment and input data is based on an exemplary day of operations, the topology, and capacity utilization of a medium sized European international airport in the Mediterranean region. In total the air-traffic scenario runs from 0:00 to 23:59 and comprises 904 flights (457 arrivals and 447 departures with approx. 110.000 Passengers). We aggregated the scenario inputs and parameters in an Excel table from where it is dynamically fed into the simulation.
Energy Flow Simulation in System-Dynamics To analyse the energy flow at an airport, we use the paradigm of system dynamics simulation. System Dynamics (SD) is a methodology for modelling and simulating complex systems, particularly in the context of energy consumption. SD is a tool to model and understand nonlinear behaviour of complex systems over time. It uses and visualises stocks, flows, internal feedback loops, table functions and time delays to model a system. System Dynamics was developed back in the 1950s by J. W. Forrester (Forrester, 1990). As an application model of economic cybernetics, SD is used today particularly in the fields of economics and business administration to analyze dynamic and complex issues. Examples come from the public and private sectors: production management, strategic planning, analysis and design of business models, business forecasting and scenario analysis.
In our case we use SD to get a holistic view of the airport by considering interconnected components, feedback loops, and dynamic behaviour of all airport parts and stakeholders to visualize causal relationships. For modelling and simulating we use the simulation software Anylogic. Anylogic is a multi- methods simulation software supporting system dynamic, discrete events and agent-based modelling. It is also capable of mixing these simulation methods within one model (Anylogic, 2024).
In this paper we focus on a first simulation prototype to examine the technical feasibility, its possibilities and limitations. From a technical point of view, we focused on combining SD and Agent-Based Modelling (see next chapter). For this, we first modelled the main energy flow at an airport with SD. Later in the project, the aim is to simulate the interaction of the different stakeholders and to model the environmental and (macro) economic impacts, as well as the possibility of different scenarios with SD.
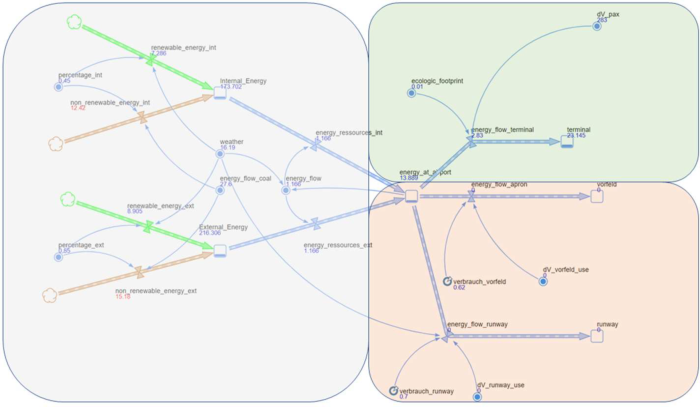
Figure 3 shows a screenshot of the SD model that we are building in Anylogic. The model is divided into three main areas. The cluster on the left represents the energy input, divided into internal and external energy sources, as well as the subdivision into renewable and non-renewable energy and its dependencies, such as weather. One of the consumers on the top right is the sub-simulation of the terminal building. The results of this sub- simulation serve as input for the SD simulation (see description of dV_pax”in next section). As a hypothesis, we assume that energy consumption is a function of the number of passengers using the building, in addition to a base load. The arrival distribution of passengers per flight is based on passenger survey data and historical observed patterns that set up the inflow for the Terminal part of the model (Alers et al., 2013). The terminal outflow
Combining System Dynamics and Agent-Based Simulation 321
is combined with the agent-based simulation. Each time an aircraft is in the status of “boarding completed”, the number of booked passengers are “leaving” (subtracted from) the terminal. To take account of environmental improvements of the terminal building, we include an “Ecologic Footprint Factor” in our simulation model chain. This will enable us to run different scenarios with varying environmental improvements.
Figure 3: System dynamics energy flow.
The bottom right of Figure 3 represents the simulation sub-model of the apron area and runway system, which represents the second part of the energy consumers. Our initial hypothesis here is that energy consumption depends on the use by airplanes, again in addition to a base load of energy consumption for the basic provision of airside infrastructure.
Interconnection of System-Dynamics and Agent-Based Simulation The combination of System Dynamics and agent-based simulation allows us to understand both the macroscopic flows and the microscopic interactions at the airport. In addition, agent-based simulation can help to assess the impact of fine-grained changes in airport layout or operations by simulating how individual agents - in this case passengers, ground staff and aircraft – react to these changes. On the other hand, System Dynamics can be used to analyse overarching trends and patterns.
The challenge in this modelling lies in the interface between the agent- based network simulation and the energy flow simulation implemented in System Dynamics. Ultimately, it should be possible to read out the resource utilization via the processes that the simulation agents (i.e. airplanes and passengers) pass through in order to determine the required energy consumption. For this purpose, the number of agents that are currently in
defined processes in the network simulation is determined and imported into the SD simulation as a dynamic variable during runtime. As a dynamic variable, this value has a direct impact on the simulated (energy) flow and thus on the stock levels. Therefore, we use the three variables “dV_runway_use” for utilization of the runway, “dV_apron_use” for the number of aircraft using the apron and “dV_pax” for the number of passengers using the terminal building.
Initial Results As a first approximation, we used the configuration and real data based on an exemplary day of operations of an international European airport in the Mediterranean region for the simulation. In order to be able to further develop an assessment tool to measure the congruence between resource utilization, A-CDM milestones and energy consumption.
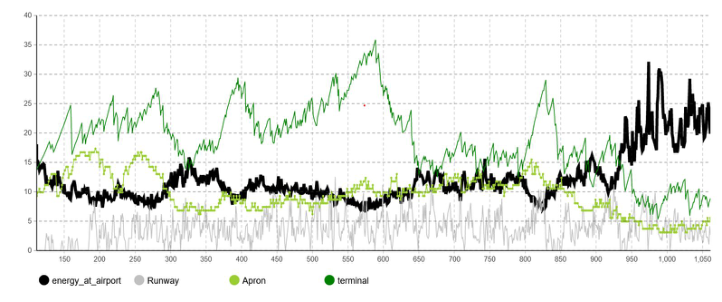
Figure 4: Energy flow at the airport.
Figure 4 shows a conceptual representation of energy consumption and available energy at an airport over time, expressed in minutes on the x-axis. As in the system dynamics model, consumers are differentiated into runways (grey), apron (light-green) and terminal building. Energy available at the airport is shown in black. It is easy to see how this storage behaves in the opposite direction to consumption. When consumption is high, the storage buffer sinks and when consumption is low, it fills up. So, the consumption is directly dependent on the utilization of each area and the aircraft, vehicles and passengers using them.
Since the application runtime of the scenario under consideration is only a few seconds, this coupled simulation environment can be used as a forecast simulation during regular airport operations. Current consumption values are just being recorded as part of a project, which means that reliable values can only be forecast once the quality of the input data has been established and validated. In the current phase, it is mainly important for us to quantify the relationship between utilization and consumption.
Combining System Dynamics and Agent-Based Simulation 323
CONCLUSION
In this paper we investigated the potential of combing System Dynamics and agent-based simulation modelling to provide a toolbox for airport operators. By adjusting model parameters, policies, and external influences, we can evaluate the impact of various interventions on energy consumption.
The combination of these two modelling paradigms in a hybrid simulation enables us to model the deduction of energy consumption in relation to resource utilization. With state charts in the agent-based sub-simulation and the direct visualization of System Dynamics, users receive a traceable overview of airport processes and a holistic view of the system’s behavior. This also allows what-if studies to be conducted on how consumption will change under different conditions or future operational procedures or to evaluate technologies.
Thanks to the short application runtime of just a few seconds, our simulation can also be used for operational forecasting. It provides the ability to aggregate individual flight-related information to a level that allows airport stakeholders to assess demand, capacity utilization, and performance parameters, such as punctuality or delays as well as resulting energy flows. In addition, the forecast can be used to implement possible countermeasures (e.g. runway closure for a certain period of time) and assess their impact to resolve potential disruptions. This can help to improve energy-efficiency of airport operations.
REFERENCES
Alers, T., Classen, A. B., Kellner, S. (2013) More Input - Generic Data for Microscopic Airport Simulation, AIAA Aviation, Los Angeles. AnyLogic – Software tools for simulation modelling & business solutions https://ww
w.anylogic.de/ (Stand 4.2024). EUROCONTROL Airport CDM Team (2017) Airport Collaborative Decision- Making (A-CDM) Implementation Manual. Forrester, J. W. (1990) Principles of Systems - System dynamics series. ISBN
9780915299874 https://books.google.de/books?id=oMASAQAAMAAJ Fowler, M. (2003) UML Distilled: A Brief Guide to the Standard Object Modeling Language ISBN 9780321193681. Harel, D (1986) Statecharts: A Visual Formalism for Complex Systems. Science of
Computer Programming 8. Schier, S., Timmermann, F., Pett, T. (2016). Airport Management in the Box – a human-in.the-loop simulation for ACDM and airport management. Deutscher Luft- und Raumfahrt Kongress 2016, Braunschweig, Germany.
LISTED IN THE AHFE DIGITAL BOOKSTORE CATALOGUE
Explore the complete digital volume
Human Interaction and Emerging Technologies (IHIET 2024)
Read this individual research paper free through the original publisher, or explore the full digital proceedings book.
ISBN 978-1-964867-33-5
Explore this ISBN in the AHFE Bookstore ↗Listed in the July 2026 bookstore catalogue; search by ISBN to confirm current availability · Digital book purchase optional