Michał Sitek, Dariusz Masły (2018). Parametric Design of Airport Passenger Service Areas. In: Advances in Human Factors and Sustainable Infrastructure. AHFE Open Access, vol. 3. https://doi.org/10.54941/ahfe100106
The search for methodologies of programming the size of the functional zones of airport terminals has been spurred by the problem of processing statistical and computational information to the form of graphical representation in terms of a simplified model of an object in a linear system. Accordingly, the authors utilised a widely applicable tool to construct an algorithm for testing various options of detailed architectural solutions and design decisions. The possibility of testing various partial solutions should enable changes in the results of calculating the capacity of the terminal in relation to its size, with specific consideration of the passenger service zones. Input data in the form of numerical information on the infrastructure, as well as the standard and estimated throughput of the terminal are calculated by means of the Terminal Planning Spreadsheet Model devised by Transportation Research Board of the National Academies under the framework of the Airport Cooperative Research Program. The algorithm importing the input data contained in the calculation model is processed in the Grasshopper environment. The tool is currently being developed by the authors to be applied for transforming numerical data to optional forms on the bases of given geometrical representation criteria and their arrangement in mutual spatial interrelations (a part of the devised algorithm), an analysis of the size of the functional zones in relation to IATA standards and the number of passenger at the capacity peak. The entire elaboration is currently in preparation and shall be based on a case study using the numerical data on one of regional EU airports. The conducted experiments of processing the numerical data into their graphical representation result in simplified diagrams of the functional zones of a linear system of an airport terminal. The next step is to devise more detailed solutions for specific zones of the terminal and to test the elaborated solutions in view of the theoretical model relation and in situ observations of the existing terminal.
Buildings evolve together with technological and cultural advances. As the first passenger air travel links were being established, so it too became necessary to create the infrastructure required to service passengers while they wait to board this modern, ultrafast mode of mass transit. As the first passenger aircraft were decommissioned and re- adapted military aeroplanes that some veteran pilots found themselves owning after World War I, therefore it was not uncommon for the only dedicated passenger infrastructure to consist of military tents. A growing expectation of the wealthy clientele of the quickly growing airline industry has forced them to develop their airport infrastructure. It stopped being enough to provide shelter from wind and rain. It became commonplace for adverse atmospheric conditions or technical faults to cause delays or even cancellations. That is why it became a necessity to provide entertainment and high quality of service for customers that impatiently awaited their 'adventure of a lifetime'. A need arose for buildings that would incorporate the functions of a transport hub, a hotel, and of a country club suitable for social elite. Important changes in the way airport terminals were organised came with the advent of travel catered to the middle class.
Carriers introduced economical, turbojet wide-bodied aircraft to serve their short-haul and intercontinental routes, which caused a sharp increase in passenger numbers and luggage and cargo volumes passing through airports. This has led to further transformation of how airfield structures were being shaped. Their scale has changed, as well as the extent to which they were equipped with technical solutions supporting luggage handling. The introduction of such conveniences as gangplanks – sleeves allowing passengers to transfer directly between the building and the aeroplane's deck – has forced construction of terminals around the parking positions for aircraft. As a consequence it has led to an evolutionary development of different organisational schemas of passenger terminals and their combinations. The level of complexity and scale keeps growing. A next element that changes space organisation in terminals is the heightening of regulations around passenger and luggage security. All the changes in the passenger handling procedures and the time required to carry them out have a decisive impact on the new forms of zone shaping in passenger airport buildings.
DESIGN PROCESS Every architect needs to learn specific skills in order to design a structure of any given type. Whether it is a school, a bank, or a shopping centre, one of the deciding factors for the building’s proper design is a thorough understanding of the users of that area and appropriate classification of the relations between these users and the spaces where core business processes are realised by them, acting either as an organisation’s representatives, or as its customers. Designing airport terminals requires a detailed knowledge of the processes involved in passenger service. The literature on the subject of aerodromes tends to compare terminals to shopping malls. However, what is deciding about airports’ flexibility and efficiency is the technology that supports passenger services and is hidden deep within the buildings. A particular distinguishing feature of terminal buildings is their division into zones where people are clustered to perform specific service actions. The size of each such zone must be programmed during the conceptual stage, which is a difficult task indeed. Typical estimation procedures are based on indicators and calculations published in guides and manuals, which are frequently inadequate in a given case and the formulae themselves can be easily misinterpreted. An additional factor determining the success of proposed solutions is the knowledge of the functioning conditions changes in time. A lack of understanding between an area and its linked processes in time results in costly design issues. Passenger terminals are expensive structures with high costs of running and upgrades. Any errors in design are very difficult and costly to eliminate. This is why there is a need for tools that support transformation of statistical data into a graphical form that can become the basis for further analysis and rationalisation of the spatial design of passenger service areas. In the process of getting to understand a new subtype of functions of a public building, which an airport is an example of, it is imperative to understand the movement dynamics of large streams of people through zones where service is provided along the transit lines between landside and airside zones.
Project teams commissioned to design a new terminal building or modernise an existing object must collect all the information required to carry out the task at hand. This includes statistical data and indicators of both the past passenger traffic and future prognoses. All this information describes the complexity and scale of a project and can be divided into four distinct types (de Neufville, Odoni, 2002):
Forecast peak hour passenger traffic
Level of service (LOS)
Flow analysis and types of passenger service
Configuration of space and service zones Understanding of collected data makes it possible to define a design process. It is important to keep in mind that the specifics of the matter in hand may require a verification of the chosen work method. The goal of the pre-design analysis is finding an optimal solution, free of faults that can be generated by an incorrect interpretation of collected and processed data.
ALGORITHM Assumptions & goals
Graphical representation of data collected in the pre-project analysis facilitates the choice of correct solutions for functional layout and makes it possible to initiate talks with all sides involved in the process of arranging detailed technical solutions. For the purpose of this elaboration we have selected a set of assumptions about the types of passenger service areas and the spatial layout of the object. Among the known layout types of airport passenger buildings the linear type has been chosen, owing to the simplicity of analysing it. In order to describe the size of passenger service functional zones a band layout has been assumed, including the characteristics of passenger service for Schengen and Non-Schengen traffic. The zonal division is illustrated in Figure 1. Diagram of zones described by the algorithm. Source: own elaboration. The algorithm presented in this paper analyses only part of the information of passenger service functional zones. Because of the level of complexity of the relations between areas and the processes carried out in them, the tool is being developed in stages.
Ongoing experiments are meant to transform numerical data into a graphical representation of a simplified diagram of the linear model of airport passenger building functional zones. Further work is being done with the goal of refining the partial solutions and of testing them in the context of the relation between the theoretical model and observations of an existing object. The most important assumption of phase 1 is facilitation of comparison of the size and placement of landside passenger service zones against the size of the entire building. This in turn can simplify decision making in the subject of vertical segregation of selected areas and passenger flow into target storeys. Furthermore, these activities help to perform zoning and other systematisation of spatial relations.
GATES
GATES
HOLDROOM
HOLDROOM
CBP
CIRCULATION
CIRCULATION
LUGGAGE SORTING AREA
LUGGAGE SORTING AREA
SECURITY
SECURITY
NON SCHENGEN SCHENGEN
Figure 1. Diagram of zones described by the algorithm. Source: own elaboration
Figure available in the original PDF paper.
Tools The presented solution assumes the possibility of visually representing the scale of functional areas of the analysed service zones of a passenger airport. To implement the task the following three tools have been selected:
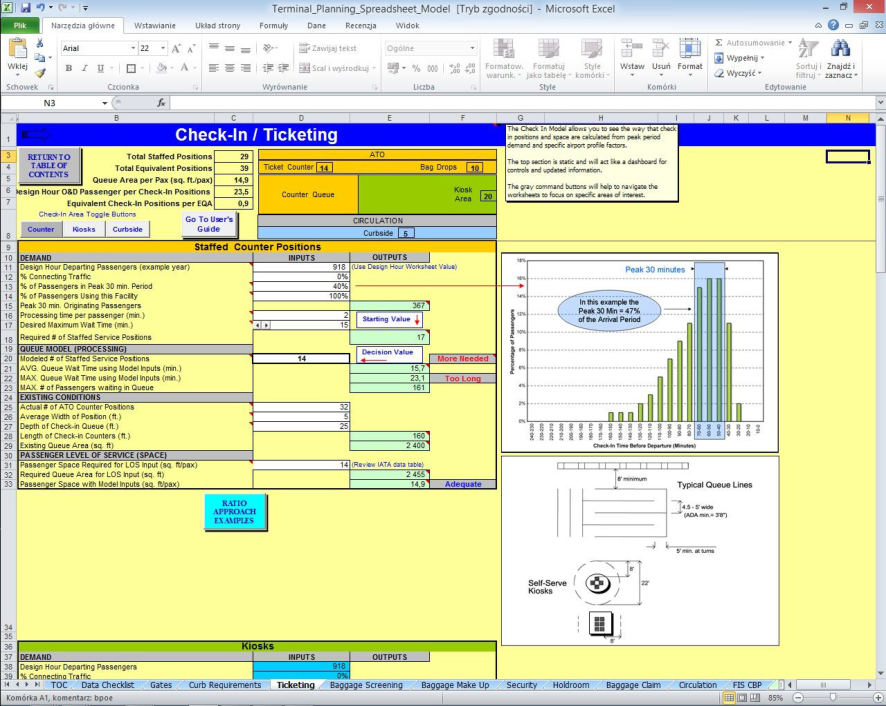
A spreadsheet: Terminal Planning Spreadsheet Model (Figure 2. Check-in zone calculation worksheet, ACRP - Terminal Planning Spreadsheet Model. Source: own elaboration) prepared by Transportation Research Board of the National Academies as part of the Airport Cooperative Research Program. Detailed information about the spreadsheet together with user manuals were published in 2010 as Report 25. The worksheets make it possible to convert flight traffic volume information in accordance with the levels of service of terminal areas. Statistical data on passenger flow, analysed in order to ascertain the requirements for areas and infrastructure, have been prepared and used as input data for the presented algorithm. For this experiment we have used data made available by Katowice Airport.
Grasshopper, a visual programming language created by David Rutten. It facilitates creating of generative algorithms that can be used together with multiple 3D geometrical components to project zones with architectural characteristics (functional zones). Website: www.grasshopper3d.com
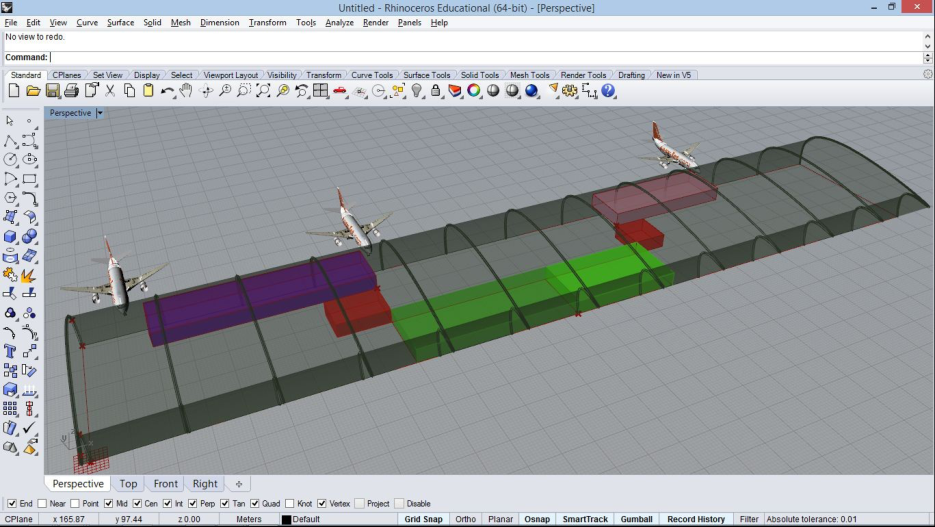
Rhinoceros 3D, a CAD application that is a graphical environment used to render spatial objects generated as a result of the algorithm in question. Website: http://www.rhino3d.com
The described software has been previously tested by the authors (Sitek M. 2013) in practice while carrying out other research. An example of this is a study of a plot of land with accordance to the restrictions of the local land use plans and elements found in situ within the town-planning context (such as the road grid and the pedestrian traffic flows).
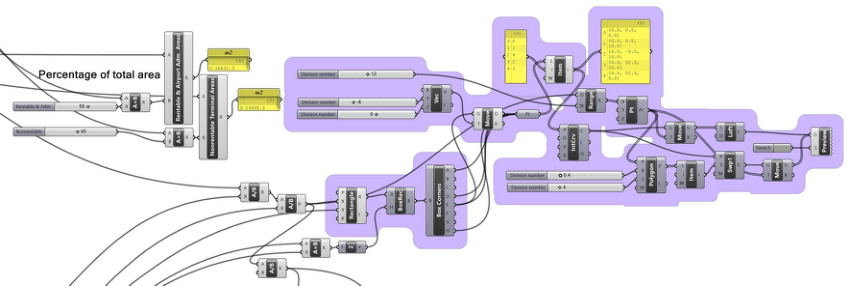
Figure 2. Check-in zone calculation worksheet, ACRP - Terminal Planning Spreadsheet Model. Source: own elaborationFigure 3. A section of the calculation algorithm. Source: own elaboration
Input Data To carry out the experiment we have used traffic volume data from an aerodrome of a very characteristic transportation structure. The described case is a small regional airport hosting a low cost carrier that introduces mostly large city destinations in the European Union. The most difficult time for operations is the summer holiday period when peak travel is caused by many charter flights overlapping with the regular route timetable. The current infrastructure of the passenger airport has been described as allowing 3.5 million passengers per annum. However, this value is overestimated due to low space standards of customer service. Even today, at the level of 2.5 million passengers a year, most of the terminal areas do not guarantee the E level of service according to IATA (Table 1. IATA LOS (Level Of Service) Space Standards). The airport aspires to the C standard by planning an expansion into a new building and modernising the existing ones.
Table 1. IATA LOS (Level Of Service) Space Standards IATA LOS Space Standards In square meters per person
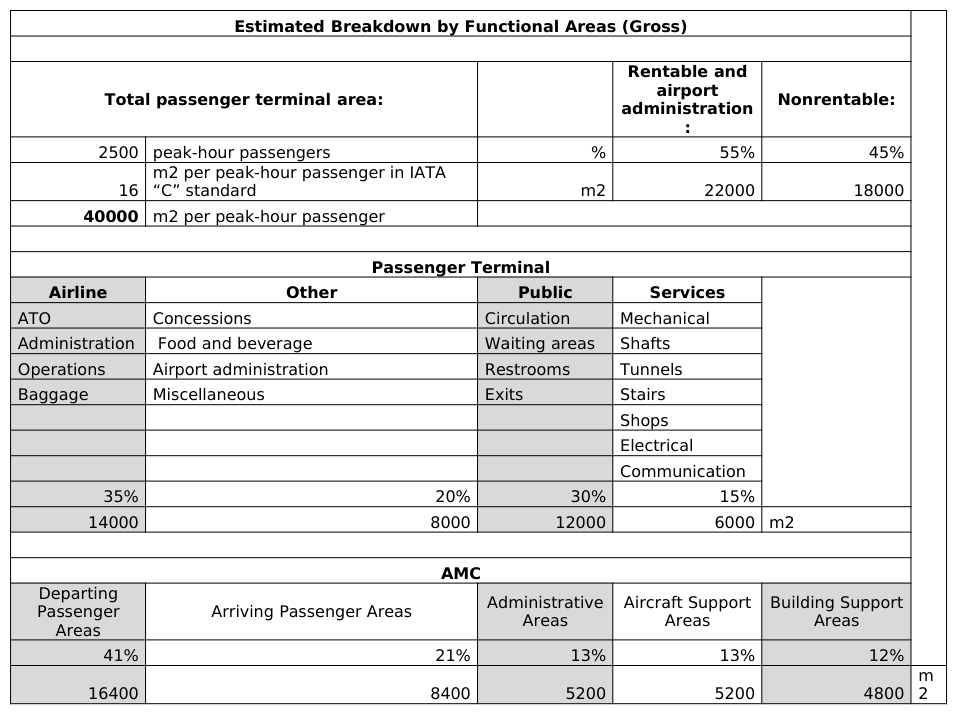
The C standard of space available per person has been used in the algorithm to calculate the areas of zones subdivided into categories and described in Table 2. IATA LOS (Level Of Service) Space Standards. The first value pertains to the total area of the object calculated on the basis of assigning 16 m2 during the peak hour. The resulting data facilitate estimating the area of the entire passenger terminal together with its specific zones, according to their purpose and categories of usage. The calculated size of the object for 2.5 thousand peak-hour passengers is 40,000 m2. This value, however, should be corrected using the coefficient of passenger flow in a time unit. Another quantity not included in the calculation is the number of individuals staying in the passenger terminal as accompanying persons (dropping off or collecting passengers).
The remaining boundary conditions for the building’s volume described in the algorithm are:
the number of storeys,
the height of a storey,
the width of the building and the width of each individual band of passenger service zones.
These parameters are configurable and allow to prepare variants of the generated solution. A further division of the modelled areas has been performed based on the two categories of traffic: Schengen and non-Schengen.
Table 2. IATA LOS (Level Of Service) Space Standards Estimated Breakdown by Functional Areas (Gross)
The data that parameterise activities in the check-in subzones define the queuing areas for the registration desks at the airport. The following indicators are calculated: the number of peak hour take-offs, the number of seats per aircraft (an aeroplane’s volume is based on the averaged typical configuration), the number of peak hour passengers checked in within each 20 minutes of calculation time expressed as percentage, and the surface standard i.e. the LOS value for category C available per 1 PAX (1.4 m2). The defined width of the check-in queue makes it possible to compute and to establish its length. This measure needs to be correlated with the number of active check-in desks and recalculated by taking into account the distances between desks. A viable alternative for such course of action can be changing the width of the queuing band in order to reduce the distance between check-in counters. This task requires the algorithm to be supplemented with parameters describing the division of the check-in waiting zone into smaller subzones that correspond to the individual queues.
Transfer through the security zone is defined based on the total waiting time in the queuing zone, the time required to verify one passenger and the total number of available checkpoints. The presented algorithm includes a simplified representation of this zone, defined as quantified handling with the exclusion of the queuing zone. The size of this zone has been described using the parameters of depth, defined here as a typical span resulting from having a single line of transfer, and its width, calculated as the product of the typical walkway's width and the total number of such walkways.
The boarding zone is represented in the algorithm as an area occupied exclusively by waiting passengers. It is entirely devoid of communication surfaces that are characteristic to linear layouts of the areas of transfer through check-in desks and gates and does not include any supporting infrastructure either. The size of this zone has been estimated on the basis of the numbers of peak hour passengers assuming the C category of space standards. The length of this zone should be determined in relation to the planned number of gates and the size of aircraft handled at each position. The permitted aircraft wingspan for each gate is a measure that is described in the detailed regulations describing the allowable distances between each vehicle situated in its respective parking location. The algorithm will be supplemented in further phases to include this type of guidelines in order to estimate the sizing of piers that lead passengers to subsequent aircraft parking positions. Additionally, the widths of pedestrian routes leading to gates should be recalculated by including passenger flow volumes in a unit of time.
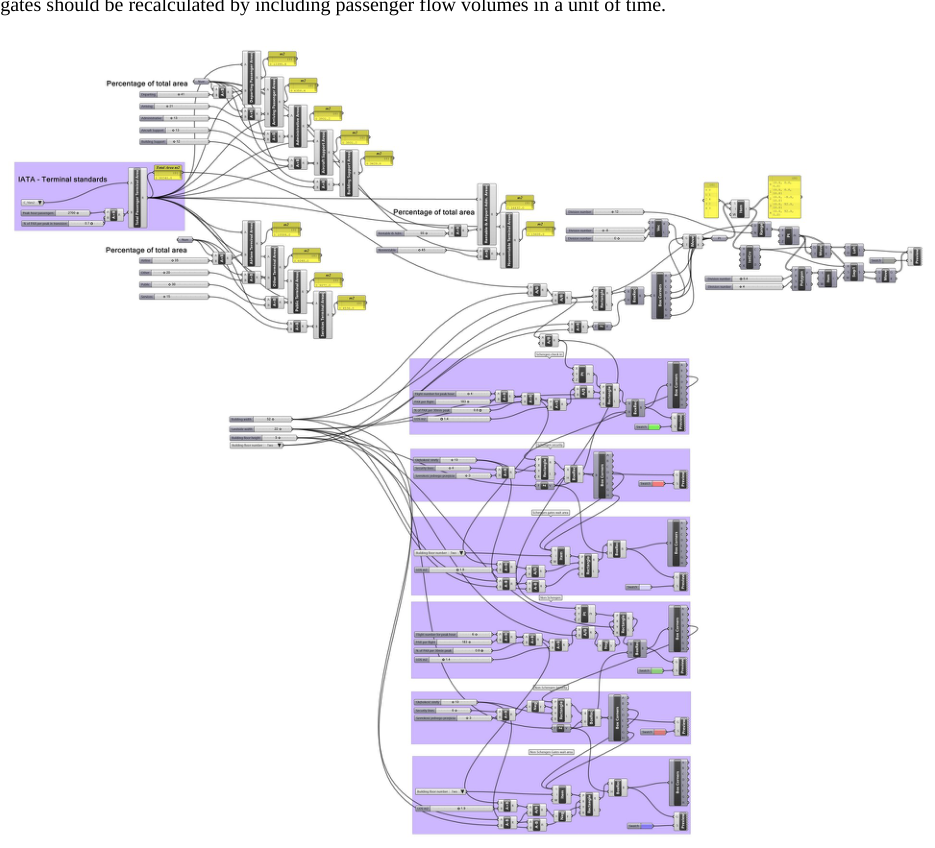
Figure 4. The current form of the algorithm. Source: own elaboration
CONCLUSIONS
Designing aerodromes and modern passenger airport terminal spaces is a task for an entire team of people representing multiple and varied professions. Contemporary hub airports are complexes of buildings with their own rail transport and extensive moving walkway systems used to expedite the flow of large volumes of passenger traffic. The infrastructure complexity of a large airport can be compared to a small town in terms of its scale. An additional factor that adds to the complexity of airport design is the requirement to ensure operational continuity. Each breakage or loss of efficiency of a single element can lead to a blockage of the entire system and paralyse an airport, forcing its passengers/customers to spend hours waiting. An integral part of any passenger airport terminal is advanced infrastructure of luggage handling, often duplicated to ensure business continuity and supported by advanced computer identification and management systems. It is precisely the effectiveness of these systems together with the productivity of the luggage handling personnel that is the deciding factor for the flow efficiency of an entire airport. Many years of experience studying such objects have brought about a rich literature and multiple simulation systems. The performed case studies made it possible to create tools supporting the decision processes involved in the management, design and modernisation of terminals. The knowledge gained through the use of these tools makes it possible to reduce the cost of operation, to introduce changes during an uninterrupted operation of an airport and to continually increase the levels of passenger service.
Figure 5. Representation of terminal size (Boeing 737-300 to scale) with highlighted zones of passenger handling that were created generatively based on data characteristic for a port with the peak hour capacity of 3.1 thousand PAX. Source: own elaboration
The presented tool is to be used for educational purposes. At the present stage of algorithm development it allows to present the key information to architecture students. This information influences the form of the designed object and makes it possible to prepare a study of the size relations between selected functional zones. The algorithm facilitates the presentation of how the model size adapts in relation to the numbers of passengers moving through the building during peak hours. When expanded and supplemented with detailed definitions of subzones, the algorithm can be used for study work on selecting the construction type and façade systems and for analyses of optimal placement of functional zones. It will also be possible to analyse the impact of the changing of passenger service systems on the size of the zones where these tasks are undertaken.
REFERENCES
ACRP (Airport Cooperative Research Program) Report nr 25, Airport Passenger Terminal Planning and Design, Transportation Research Board of the National Academies (TRB), 2010 National Academy of Sciences, Washington, D.C. 2010, part 1 - ISBN 978-0-309-11820-0, part 2 978-0-309-11816-3 ACRP (Airport Cooperative Research Program) Report nr 10, Innovations for Airport Terminal Facilities, Transportation
Research Board of the National Academies (TRB), National Academy of Sciences, Washington, D.C. 2008, ISBN: 978-0- 309-11762-3 ACRP (Airport Cooperative Research Program) Report nr 68, Guidebook for Evaluating Terminal Renewal Versus Replacement Options, Transportation Research Board of the National Academies (TRB), National Academy of Sciences, Washington, D.C. 2012 Chung, C., & Nyakman, H. (1996), “Operation of airport security checkpoints under increased threat conditions”, Journal of
Transportation Engineering, 122(4), 264–69. http://dx.doi.org/10.1061/(ASCE)0733-947X(1996) 122:4(264) Fayez, M. S., Kaylani, A., Cope, D., Rychlik, N., & Mollaghasemi, M. (2008), “Managing airport operations using simulation”, Journal of Simulation, 2, 41–52. http://dx.doi.org/10.1057/palgrave.jos.4250030 Gatersleben, M., & van der Weij, S. W. (1999), “Analysis and simulation of passenger flows in an airport terminal”, In P. A. Issa R., Payne A, (2009), “The Grasshopper Primer”. Second edition, Website: www.liftarchitects.com, Primer_Second
Edition_090323.pdf Manataki, E., & Zografos, G. (2009). “A generic system dynamics based tool for airport terminal performance analysis”, Transportation Research Part C: Emerging Technologies, 17(4), 428–43. http://dx.doi.org/10.1016/j.trc.2009.02.001 de Neufville R., Odoni A.R. (2002), “Airport Systems: Planning, Design, and Management”, McGraw Hill Professional Sitek M. (2013), “A parameterisation algorithm study of a land plot in the city of tychy. Indications for functional distribution in
architectural objects”, International Scientific Conference Modernity in Architecture, The Silesian University of Technology. Sitek M. (2013), “The impact of new airport passenger service technologies on the shaping of terminal building landside areas”, International Conference NBTAD, Kraków, Poland. Takakuwa S., & Oyama T. (2003), “Simulation analysis of international departure passenger flows in an airport terminal”, In
S.Chick, P. J. Sa´nchez, D. Ferrin, & D. J. Morrice (Eds.), Proceedings of the 2003 Winter Simulation Conference (pp. 1627–34). http://informs-sim.org/wsc03papers/207.pdf Trani, A. (2002) , “Airport landside analysis and modeling”, Advanced Airport and Airspace Capacity Seminar. Uchroński P.(2011), “Wpływ infrastruktury terminalowej na ochronę lotnictwa cywilnego”, Silesian University of Technology, TRANSPORT .72/1860 Valentin, E. (2002), “Building blocks for modeling of passengers at airports”, Delft University of Technology. Zubin Khabazi (2010), “Generative algorithms using Grasshopper”, Website: www.morphogenesism.com
LISTED IN THE AHFE DIGITAL BOOKSTORE CATALOGUE
Explore the complete digital volume
Advances in Human Factors and Sustainable Infrastructure
Read this individual research paper free through the original publisher, or explore the full digital proceedings book.
ISBN 978-1-4951-2092-3
Explore this ISBN in the AHFE Bookstore ↗Listed in the July 2026 bookstore catalogue; search by ISBN to confirm current availability · Digital book purchase optional