Arun Balakrishna, Tom Gross (2023). Data mining with Behaviour and Context-Based Optimal Navigation (BeaCON) for Optimal Navigation. In: Human Systems Engineering and Design (IHSED 2023): Future Trends and Applications. AHFE Open Access, vol. 112, pp. 27–34. https://doi.org/10.54941/ahfe1004110
We demonstrate the data mining process for the creation of optimal guidance information using BeaCON (Behaviour and Context-Based Optimal Navigation), a driving simulator and analytics framework. BeaCON implements a novel framework for optimal navigation by integrating user-behavioural and user-cognitive navigation processes. Integration of cognitive models along with route information and behavioural models enables BeaCON not only to identify the high cognitive load scenarios while driving but also the root cause of it. Analysis of high cognitive load scenarios and the root cause can be used to create the principles for the generation of optimal guidance information.
Modern automotive navigation systems were introduced a few decades ago and contribute significantly to mobility solutions. A car Navigation System (NS) provides visual and audio guidance for a user to reach the destination (Skog and Händel, 2009). Interaction with built-in systems like infotain- ment and navigation systems has a strong adverse effect on driver workload (European Commission, 2022). State-of-the-art research in NS is towards technological advances, for example, augmented reality in NS (Grünler, 2018) while the past research was mainly towards improving the basic building blocks of NS (Skog and Händel, 2012). The current research also concentrates on connected navigation systems for improved safety as well as for improving the accuracy of information used for guidance. Connected driving improves the freshness and precision of the input information used by the NS. The main objective of NS is to guide the driver rather than the vehicle to reach the destination (Skog and Händel, 2012), but the current state of the art lacks the concentration towards the driver while achieving the functionalities of NS. The state-of-the-art NS currently does not integrate the guidance information created based on the analysis of driver cognitive load scenarios as well as the identification of the driver cognitive load sce- narios. To properly achieve the functionalities of NS, an understanding of
human behaviour while driving is also necessary (Brügger, Richter and Fab- rikant, 2019). NS is a human-in-the-loop system and the creation of guidance information which also considers the driver’s cognitive state is missing in the current NS technologies.
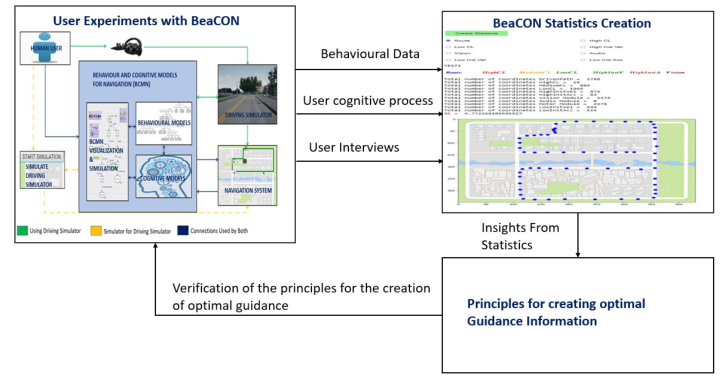
BeaCON driving simulator and associated data analytics enable, for the first time, the research on “Giving the driver adequate navigation informa- tion with minimal interruption”, which is an identified research gap in HMS (Balakrishna and Gross, 2020). The main novelty of BeaCON is the inte- gration of cognitive models along with behavioural models to identify the root cause of high cognitive scenarios (Balakrishna and Gross, 2021). Cre- ation and presentation of optimal guidance information at the right time eliminate driver distraction. BeaCON is a human-oriented driving simulator which enables the identification of the user’s thought process (i.e., process- ing audio input “Take next right turn”) as well as integrating this with the route information and observed user behaviour (i.e., high cognitive load and high physical actions at a particular junction) during driving. BeaCON con- tains behavioural and cognitive models as a part of the framework which creates the necessary input for statistics creation. From the statistics, different insights shall be created (see Figure 1).
Figure 1: Overview of data mining with BeaCON.
FRAMEWORK SETUP BeaCON enables the users to have a deeper understanding of the cognitive load scenarios while driving. The principles for optimum guidance informa- tion, generated by using BeaCON improve safety as well as reduce the overall stress level for the whole route. BeaCON supports different configurations i.e., weather conditions, number of pedestrians etc. Different configurations can be used for simulating different conditions while conducting experiments. Different hardware components i.e., steering wheel, pedals, driving seat etc. are selected to make the simulation as close to a real-world driving experi- ence. The screen size and rendering quality are configurable, enabling CPU
Data Mining With Behaviour and Context-Based Optimal Navigation (BeaCON) 29
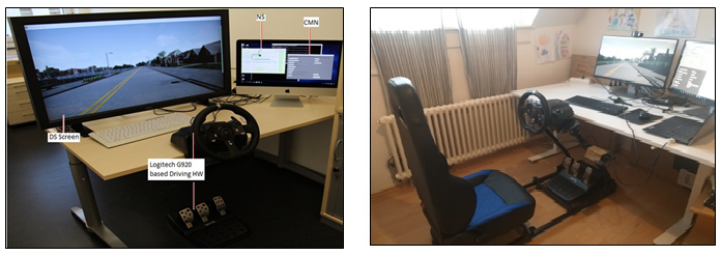
and RAM optimization wherever necessary based on the hardware selected for BeaCON deployment. Compared to state-of-the-art navigation systems which focus more on the technical aspects of the system (Grünler, 2018), BeaCON focuses on the human factors for optimal NS integration with the human driver. BeaCON can be used with a minimal set-up or with an enhanced set-up for better user experiences (see Figure 2). Mainly BeaCON contains Cognitive Models for Navigation (CMN), Driving Simulator (DS) screen, behavioural models and the hardware for enabling brake, acceler- ator and steering facilities. The cognitive models are created using ACT-R (Anderson, 2007). Declarative, goal, procedural, imaginal, visual and vocal modules from ACT-R are used to create the cognitive model for navigation (Anderson, 2007).
Figure 2: Minimal BeaCON setup without driving seat (left), BeaCON setup with driving seat for enhanced user experience (right).
CONDUCTING EXPERIMENTS There are two main steps involved while conducting user experiments for creating principles for the generation of optimal information with BeaCON.
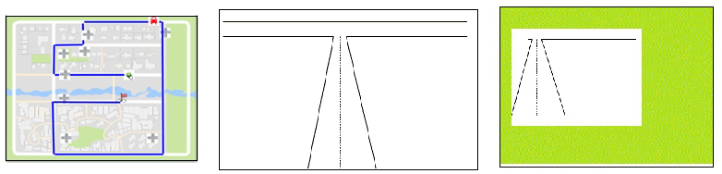
The User Drives Between Two Predefined Locations and Collects Behavioural and Cognitive Data An urban area in a virtual environment which includes many manoeuvres as well as junctions is selected as a test track (see Figure 3). Selection of different routes is also possible for the test drive. Different representative images are used so that the user can see the state of the cognitive models, which is sup- posed to be the same as the user’s thought process while driving (see Figure 3). Users get audio guidance information while driving as well as the current car position (CCP) symbol is getting updated on the NS screen. The representa- tive images from cognitive models are also displayed (see Figure 3). A fusion between the behavioural data (time, location, measured cognitive load value at different locations, accelerator and braking behaviour) as well as the logs from the ACT-R based cognitive models (time, user thought process at dif- ferent scenarios) is done at this stage. The fused data act as an input for the statistics creation part of BeaCON.
30 Balakrishna and Gross
Figure 3: Test track highlighted on the map on NS (left), representative image used for user cognition process of visual input of a junction (middle), representative image used for user cognition process of visual input of a taking a junction at low speed (right).
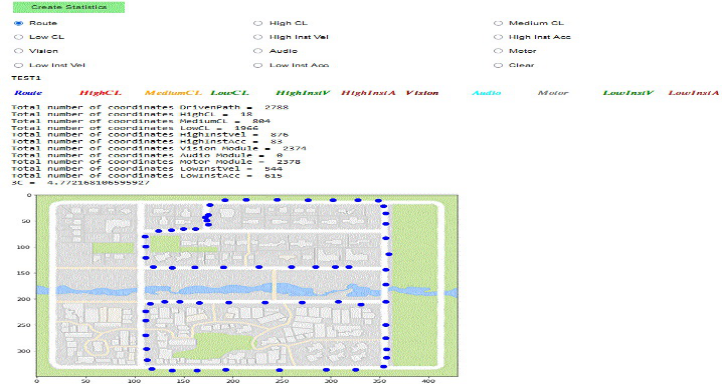
Creation of Statistics BeaCON provides an intuitive statistics generation tool (see Figure 4). Bea- CON collects the user behaviour and cognitive profiling data as the user drives between the selected points. The data analytics tools created for Bea- CON enable the creation of statistics in an intuitive way. The created statistics can be used to generate insights for optimal guidance information. The statis- tics can be generated by using a set of input parameters which are already available in BeaCON (see Table 1).
Figure 4: Statistics generation GUI (Graphical User Interface) by BeaCON.
Different parameters are represented by using different colour coding. Any number of input parameters can be used for statistics creation (For exam- ple the user can select the parameters Route, HighCL, HighAcc and Motor together). The geo-coordinates of the user-driven path are also highlighted. A summary of profiling is shown along with the total number of high, low and medium cognitive load points (see Figure 4). BeaCON calculates the Cog- nitive Cost Calculation (3C), which is the cumulative cognitive load for the
Data Mining With Behaviour and Context-Based Optimal Navigation (BeaCON) 31
Table 1. Parameters used for statistics creation.
Table available in the original PDF paper.
Description Name of Parameter / Parameters
The high, medium, and low cognitive load (CL) points during the test drive
Route The route selected in the map for conducting experiments HighCL, MediumCL, LowCL High Inst Vel, High Inst Acc The high instantaneous velocity (Vel) and high instantaneous acceleration (Acc) points during the test drive Low Inst Vel, Low Inst Acc
The low instantaneous velocity (Vel) and low instantaneous acceleration (Acc) points during the test drive Vision, Audio The locations where the user is processing visionary and/or aural inputs, as identified by the cognitive model Motor The locations where the user is involved in physical actions (steering, accelerator, brake), as identified by the cognitive model
whole route. Optimization of 3C is the main target which shall be achieved by optimized guidance information. The target 3C for a particular route is iden- tified by conducting many test drives and identifying the lowest 3C observed. 3C is displayed in the summary data (see Figure 4). The statistics are created from the fused data which contains
1. Route information (latitude, longitude, timestamp) 2. Behavioural information (i.e., high cognitive load at a particular location) 3. Cognitive model information from ACT-R models (i.e., user processing visual information about next junction).
This enables the identification of the locations where the user’s cognitive load is high along with the user’s actions and thought processes in those locations. A holistic view of all this information enables research towards optimal guidance information in a more effective way. Interviews with the users involved in the driving experiments also can be used as additional input if necessary. It is possible to add new input parameters other than the already supported input parameters (see Table 1) to BeaCON’s statistics creation part by adding the necessary algorithms.
CREATION OF INSIGHTS FROM THE STATISTICS From the visualization and analysis of statistics, different insights can be created. The insights are then used to create effective guidance information which can reduce the 3C while driving. 3C is generated by adding all the measured cognitive load during the high cognitive load scenarios during the test drive.
The optimal cognitive load for the whole route is the lowest 3C observed from different test drives. The main target of BeaCON is to optimize the 3C associated with the whole route. Even though optimization of cognitive load on different point locations (i.e., A specific junction) is important, optimiza- tion of 3C concentrates more on the route as a whole. The insight creation
32 Balakrishna and Gross
shall be done towards the optimization of 3C. The created insights which help to achieve a reduction in 3C, can be used to generate optimal guidance information configuration for NS.
DATA MINING EXAMPLES Some examples of data mining for insight creation and guidance informa- tion optimization are given below. The examples are from the output from different test drives which contains both highly experienced and not highly experienced drivers.
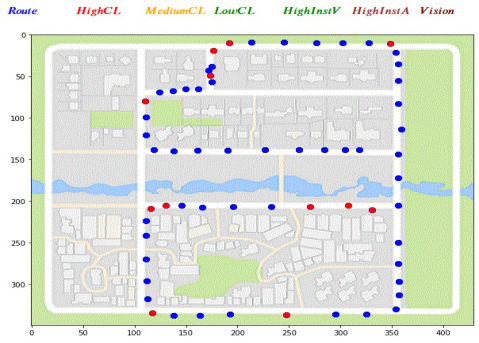
Example 1: Visualization of Locations in the Route With High Cognitive Load The parameters {Route, HighCL} are selected for creating statistics (see Figure 5). The visualization with these two parameters is generally the first input needed towards the optimization of 3C. Once the high cognitive load points are identified different hypotheses can be created for the root cause of high cognitive load in different scenarios and more statistics can be generated to analyse the hypothesis.
Figure 5: Statistics from test drive by selecting the parameters {Route, HighCL}.
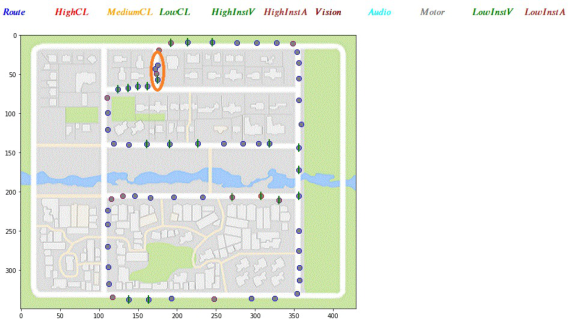
Example 2: Verification of Hypothesis “Overtaking Vehicles Near Manoeuvres, Even With Low Instantaneous Velocity, Induces High Cognitive Load” In the test drives corresponding to Example 1, it is observed that at a particu- lar junction even at low speed, the user has a high cognitive load. The location of interest where this behaviour is observed is marked in the generated statis- tics with an orange colour circle (see Figure 6). Analysis of logs from cognitive models showed that the user was overtaking a vehicle and encountered a manoeuvre immediately after the overtaking, which was the reason for the observed high cognitive load. Therefore, the correlation between overtaking, immediate next manoeuvre and high cognitive load are proved. This can be
Data Mining With Behaviour and Context-Based Optimal Navigation (BeaCON) 33
used to create guidance information which prevents the users from overtaking if there is a presence of immediate manoeuvres.
Figure 6: Statistics from test drive by selecting the parameters {Route, HighCL, Low instantaneous velocity, Motor}.
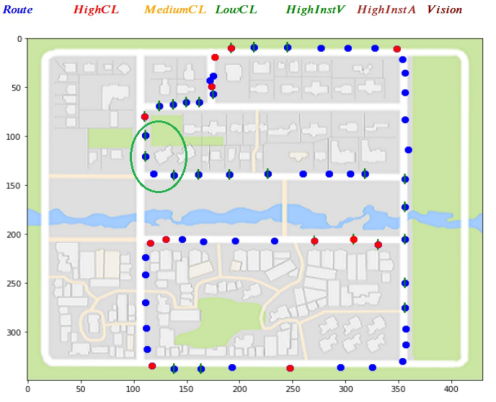
Example 3: Verification of Hypothesis “High Instantaneous Velocity Creates High Cognitive Load on Manoeuvres” Multiple test drives are conducted for the verification of this hypothesis. The results from test drives show that there is no confirmed correlation between the high instantaneous velocity on manoeuvres and high cognitive load, for example, the manoeuvre where the user was not experiencing high cognitive load with high instantaneous velocity is marked with a green circle in one of the test drives results (see Figure 7).
Figure 7: Statistics from test drive by selecting the parameters {Route, HighCL, High InstVel}.
34 Balakrishna and Gross
CONCLUSION
We demonstrated BeaCON, a framework which contains the driving simu- lator and associated data analytics tools to create optimal guidance infor- mation. A description of the usage, novelty and different components of BeaCON is provided. Steps needed for the generation of statistical data, once the user test drive is conducted, are shown. Insight creation and generation of optimal guidance information are shown with examples. The correlation between lower values of 3C and the effectiveness of guidance information is described. The effectiveness of analysis of optimal guidance information generation with a unified view of user behavioural data and user cognitive data is described.
ACKNOWLEDGMENT
We thank the members of the Cooperative Media Lab of the University Bam- berg. We also thank the reviewers for their valuable comments. We also thank the colleagues from HERE Technologies, Frankfurt, Germany.
REFERENCES
Anderson, J. R. (2007)” How Can the Human Mind Occur in the Physical Universe?”, Oxford Series on Cognitive Models and Architectures. Balakrishna, A., Gross, T. (2020) “A research framework towards an optimal naviga-
tion”, 22nd International Conference on human computer interaction HCII 2020, Copenhagen, Denmark, pp. 556–574 (2020). (ISBN: 978–3–030–49064–5). Balakrishna, A., Gross, T. (2021) “What Humans Might be Thinking While Driving: Behaviour and Cognitive Models for Navigation”, 23rd International Confer- ence on Human-Computer Interaction - HCII 2021 (July 24-29). Springer-Verlag, Heidelberg, 2021. pp. 367–381. (978-3-030-78357-0). doi: doi.org/10.1007/978- 3-030-78358-7_25. Brügger, A., Richter, K. F., Fabrikant, S. I. (2019) “How does navigation sys-
tem behavior influence human behavior?”, Cognitive Research: Principles and Implications, vol. 4, Issue 1. European Commission (2022) Road Safety Thematic Report – Driver distraction. Grünler, CD. (2018) “Augmented Reality: Application to In-Vehicle Naviga- tion”, Conference on Architectural and Structural Applications of Glass Louter, Bos, Belis, Veer, Nijsse (Eds.), Delft University of Technology, ISBN 978-94-6366-044-0. Skog, I., Händel, P. (2009) “ In-car positioning and navigation technologies”, IEEE Trans. Intell. Transp. Syst. Skog, I., Händel, P. (2012) “State-of-the-art in-car navigation: an overview”, in:
Eskandarian, A. (ed.) Handbook of Intelligent Vehicles, pp. 435–462. Springer, London.
LISTED IN THE AHFE DIGITAL BOOKSTORE CATALOGUE
Explore the complete digital volume
Human Systems Engineering and Design (IHSED 2023): Future Trends and Applications
Read this individual research paper free through the original publisher, or explore the full digital proceedings book.
ISBN 978-1-958651-88-9
Explore this ISBN in the AHFE Bookstore ↗Listed in the July 2026 bookstore catalogue; search by ISBN to confirm current availability · Digital book purchase optional