Zhen Yan, Minhua Chen, Hao Chen, Yan Zhang (2024). Optimization of the temperature field inside a forced convection oven. In: Intelligent Human Systems Integration (IHSI 2024): Integrating People and Intelligent Systems. AHFE Open Access, vol. 119, pp. 390–401. https://doi.org/10.54941/ahfe1004503
This study takes a comprehensive approach by integrating numerical simulation and experimental validation to address the issue of uneven temperature distribution in ovens. Precise simulations of gas flow and heat transfer inside the oven are conducted using CFD software. Subsequently, temperatures at different points on various planes inside the oven are experimentally measured. The comparison between numerical simulation results and experimental data reveals a minimal difference of only 0.97%, confirming the high accuracy of the simulation results. Building upon this foundation, the paper introduces a series of optimization solutions, including the adjustment of fan blade folding angles and the optimization of baffle structures. Simulation results demonstrate the effectiveness of both optimization strategies in enhancing the uniformity of the original oven's internal plane temperature. In conclusion, experimental validation confirms that simultaneous improvements in fan blade folding angles and baffle structures not only significantly enhance temperature uniformity, reducing the plane temperature variance from 5.75 to 1.61, but also raise the overall average temperature from 185°C to 190°C. This study provides a practical and effective optimization solution for the design and manufacturing of ovens, with significant implications for practical applications and broader dissemination.
With the continuous advancement of the kitchen revolution and the increas- ing popularity of baking culture, the household oven market has experienced strong growth (Tao, M., Wu, L. H. and Bao, X., 2018). Currently, the global electric oven market size is estimated to be around 80 to 90 million units, with a high level of penetration. At the same time, the domestic electric oven market is also growing rapidly, with an annual growth rate exceeding 50% over the past three years, effectively doubling the market capacity during this period. According to related data, the size of China’s household oven mar- ket is projected to reach 52.33 billion yuan in 2022(Ding, L., Zhou, H. X., Zhong, F. H. and Feng, Z., 2019).
However, uneven internal temperature inside an oven can lead to uneven heating of food, resulting in undercooked or overcooked portions, thereby negatively affecting the sensory characteristics of the food and even posing potential health risks. In response to these issues, relevant research on opti- mizing oven temperature distribution has been conducted and is continually
Optimization of the Temperature Field Inside a Forced Convection Oven 391
being explored. Currently, the methods for studying oven temperature dis- tribution mainly include experimental research and computational fluid dynamics (CFD) numerical simulations.
With the continuous development and application of computational fluid dynamics (CFD) technology, numerical simulation has become an effective approach for studying the temperature distribution in ovens. Using CFD soft- ware to numerically simulate the oven’s temperature distribution allows for the analysis and optimization of both the temperature field and flow field. At the same time, experimental validation is also a crucial method for study- ing the oven’s temperature distribution. Through experiments, the numerical simulation results can be validated, thereby enhancing the reliability of the research (WANG, Q.-W., SHEN, Q.-L., LI, X.-G. and XIAO, W.-D., 2023; Kim, E. L., Wang, C. Chao and Kim, H. Chul,2021; BOURNET, P.-E. and ROJANO, F., 2022). At present, there have been more studies on the unifor- mity of the oven temperature field and structural optimization. For example, Smolka et al. (SMOLKA,J., NOWAK,A.J. and RYBARZ,D., 2010) proposed a structural optimization scheme such as changing the position of the heat- ing pipe based on the establishment of a CFD model including a heat transfer model and parameters such as the air characteristics that vary with tempera- ture and the heat transfer system in the outer cavity; Mena Ciarmiello et al. (CIARMIELLO, M. and MORRONE, B., 2016) established a finite volume method based on the CFD model of Neapolitan pizza electric oven to simu- late and study the thermal condition of the oven including pizza. Wang Jing et al. (Wang, J., Liu, D. and Xiang, L., 2015) investigated the main internal heat transfer mechanism under different operating stages of the oven. Yuan Hong et al.(Yuan, H., Wu, D. T., Qin, S., Zheng, X., Wu, P. and Huang, B., 2017) investigated the effects of guide vane structure, spacer structure, and the position and form of the heating pipe on the temperature field of the oven; Gu Siyuan et al. (Gu, S. Y., Liu, D. and Xiang, L. L., 2015) optimized the temperature field homogeneity by adjusting the position of the air outlets and the speed of the return air of the hot fan optimized the temperature field uniformity.
In this study, a combination of numerical simulation and experimental ver- ification is adopted to simulate and optimize the temperature field of forced convection oven. By adjusting the partition structure and the folding fan structure, the distribution of the circulating flow field in the oven cavity is optimized to further improve the temperature uniformity in the plane, and the effectiveness of the optimized design is verified. This study provides an effective method for the optimal design of the oven temperature field, and provides a reference for the design and optimization of ovens in the field of food processing.
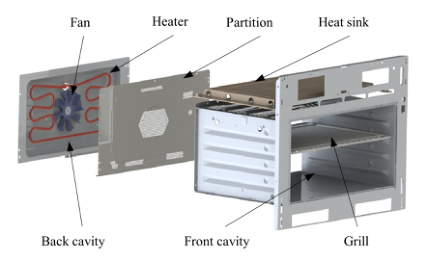
Numerical Simulation Model Objects The oven consists of two parts: the front cavity region and the rear cavity region, (see Figure 1). The front cavity region serves as the food placement area and is equipped with four layers of baking racks, with heat dissipation
devices on the upper wall. In the center of the rear cavity region, a folding fan is installed, surrounded by heating tubes. Gas circulation exchange between the front and rear cavities is achieved through perforated partitions, and the walls of the oven are all made of 304 stainless steel material.
Figure 1: The overall structure of the oven.
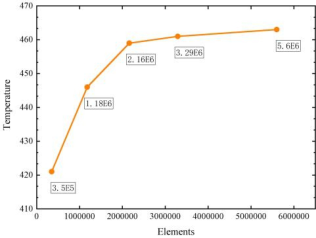
Modeling and Meshing Grid independence is highly important in the fields of numerical simulation and computational fluid dynamics (CFD). It refers to the condition where results do not show significant variations when using different grid sizes or structures for the simulation. The accuracy, reliability, and effectiveness of numerical simulations and CFD depend on achieving grid independence. It ensures that simulation results remain consistent regardless of grid selection, thus enhancing the credibility of model validation and engineering design processes (Yuan, H., Wu, D. T., Qin, S., Zheng, X., Wu, P. and Huang, B.. 2017). Under the condition of meeting solution accuracy, and to reduce computa- tional time costs, grid independence verification was performed to determine a more suitable number of grids. The simulation results corresponding to different number of meshes are analyzed (see Figure 3). When the grid count was augmented to 2.61 million and subsequently further increased, it was observed that the fluctuation in simulated temperature values remained minimal. It can be inferred that once the grid count reaches 2.16 million, the impact of the grids on the results is deemed to be within acceptable limits.
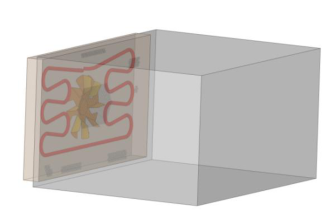
Figure 2: The oven simulation model.
Optimization of the Temperature Field Inside a Forced Convection Oven 393
Figure 3: Grid irrelevance verification.
Boundary Condition Setting The setting of boundary conditions is crucial for the accuracy, stability, inter- pretability and validation of numerical simulations and CFD. They ensure that the simulation is consistent with the actual phenomena and limit the computational domain to make the simulation results more reliable and applicable to specific aspects of the problem (BOURNET, P.-E. and ROJANO, F., 2022). The model boundary conditions were set for the specific reality of the oven (see Table 1).
Table 1. Boundary condition settings.
Table available in the original PDF paper.
Components Boundary Conditions Heater Tube 630K No thick wall surface Fans 2000r/min No thick wall surface Intermediate Partition Coupled Upper Wall Surface Mixed; h = 14W/(m2·K) Single layer stainless steel wall Door Mixed;h = 8W/(m2·K) Insulated wall surface Others Radiation Double shell wall
Numerical Solution Method In this paper, CFD software is used to simulate the temperature and flow fields inside the oven based on three-dimensional incompressible constant flow and heat transfer. The turbulence model is used, the radiation model is Discrete Ordinates (DO) radiation model, and the incompressible Newtonian fluid is used as the continuous-phase medium. four solution algorithms, SIM- PLE, SIMPLEC, PISO and COUPLE, are provided in FLUENT. SIMPLEC is chosen as the solution algorithm. In the SIMPLEC solver, the Solver Type is set to Pressure-Based momentum term is discretized using the second-order upwind scheme, and the convergence factor is 1×10⁻³ to ensure the accuracy
and stability. The other options in the solver are kept as default for ease of computation.
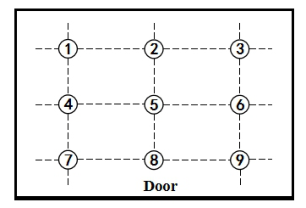
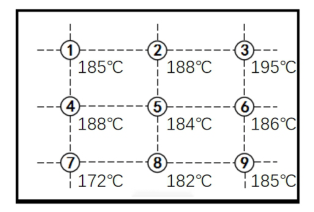
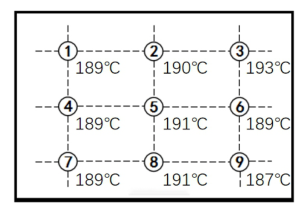
Experimental Measurements Test Program In order to analyze the actual temperature distribution in the front cavity of the oven, the temperature inside the oven cavity was tested. With the plane of the grill as the reference plane, 9 measurement points are evenly arranged (see Figure 4) (Zhang, Lanxin, Liu, Dong and Xiang, Linlin, 2015). The K-type thermocouple temperature sensor was used to collect the temperature with a measurement range of −50−300
C. A 32-channel multi-channel temperature recorder was used to record the temperature data of each measurement point during the whole working process of the oven, and the recording frequency was 1 time/second. The working mode of the oven is set to 190
C in hot air mode.
Figure 4: Distribution of measuring points.
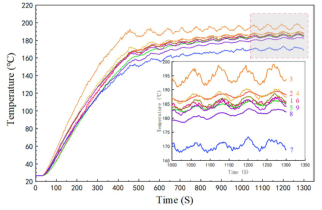
Test Results Temperature profiles were recorded at 9 measurement points on the grill plane when the oven was operated in hot air mode at 190
C for 1300 sec- onds (see Figure 5). It is obvious that points 3 and 7 are localized high and low temperature locations, respectively. The temperature difference between the remaining points is small.
Figure 5: Temperature change curve of measuring point.
The temperature measurements were repeated five times under the same operating conditions, and the temperature values at the measuring points
Optimization of the Temperature Field Inside a Forced Convection Oven 395
inside the chamber were recorded for 1300 seconds. There is a large difference between the highest and lowest temperatures (see Figure 6). The temperature difference between the remaining points is small.
Figure 6: Experimental point temperature.
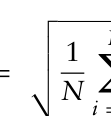
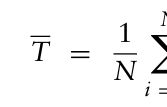
The standard temperature deviation among the nine positions is calculated using the following mathematical expression below:
N X σ =
2 (1)
(Ti −T)
Equation reproduced from the original PDF.
Ti (2)
Equation reproduced from the original PDF.
Where σ is the standard deviation, Ti is the temperature value corre- sponding to the nine positions,T is the mean of Ti, N is the total number of points.
The standard deviation of the temperature in the plane of the furnace chamber was calculated to be 5.75
C, with an average temperature of 185
C. The temperature in the plane of the furnace chamber was calculated to be 5.75
C, with an average temperature of 185
C.
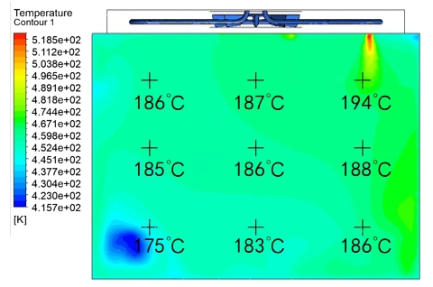
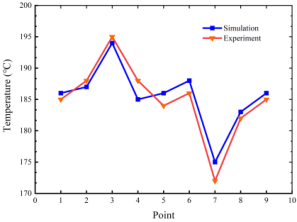
Comparison and Verification of Results In order to verify the reliability of the simulation results, the values of dif- ferent planar temperature points of the original oven were measured through the test and compared with the simulation results (see Figure 7 and Figure 8).
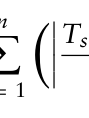
The accuracy of the numerical simulation was further assessed by calcu- lating the mean absolute percent error with the following equation:
Ts −Te
n X
Equation reproduced from the original PDF.
n
Te
Equation reproduced from the original PDF.
Where M is the Mean Absolute Percentage Error, n is the number of tem- perature points, Te is the experimental temperature values, Ts is the simulated temperature values.
Figure 7: Simulated temperature.Figure 8: Comparison between simulated and measured temperature of third grill.
The MAPE between the experimental and simulated temperature values is 0.97% and the maximum variation is 2.33%, which are within the permis- sible limits, thus the results of the numerical simulation are trustworthy.
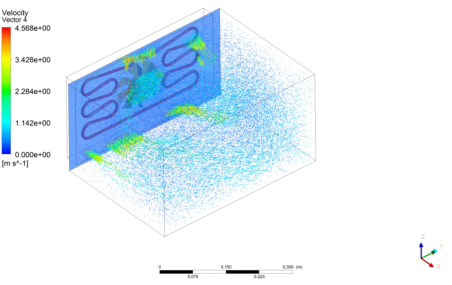
Temperature Field Analysis and Structural Optimization Temperature Field Analysis The oven exhibits temperature non-uniformity with localized high- temperature and low-temperature regions. The high-temperature areas are concentrated near the outlet on the right side of the air intake baffle, while the low-temperature areas are concentrated in the left area of the air intake door (see Figure 9 and Figure 10). Calculated according to equation (1), the standard deviation of the third shelf plane in the simulation results reaches 5.25 (see Figure 7). By analyzing the airflow velocity and direction at the entrance and exit positions of the partition in the fluid vector map, the main reasons are as follows:
1. Some gas flows from the rear compartment to the front compartment through the edges of the gas recirculation holes in the partition, disrupting the overall flow pattern of hot air exiting from the peripheral holes and cool air entering from the central holes.
Optimization of the Temperature Field Inside a Forced Convection Oven 397
Figure 9: Vector diagram of posterior chamber area.Figure 10: Vector diagram of anterior chamber area.
2. At the exit position of the partition, the hot air has a significant deviation angle towards the wall, resulting in a direct impact and contact of a large amount of hot air with the wall. This leads to substantial loss of fluid kinetic energy and insufficient heat transfer.
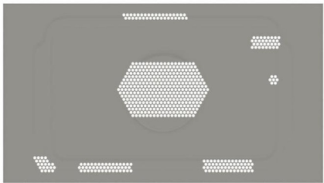
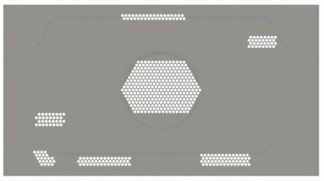
Optimization Improvement of the Position Distribution of the Air Outlet Holes of the Partition Due to the uneven distribution of outlet holes in the baffle(see Figure 11), resulting in differences in the plane temperature distribution, outlet holes are arranged on the left side of the baffle, corresponding to the position of the outlet holes on the right side. Through the simulation vector diagram of the original oven, it can be observed that a small amount of hot air flows out through the outermost part of the return air hole in the middle of the baffle. To reduce this, the number of return air holes in the middle is reduced, avoiding the impact of hot air leakage on the overall temperature uniformity (see Figure 12).
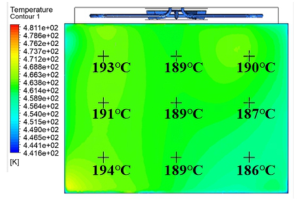
Simulated temperature contour plots of the third baking rack in the front chamber with the improved baffle were analyzed (see Figure 13). The
Figure 11: Original partition.Figure 12: Improved partition.
improved baffle effectively addresses the issue of lower local temperature near the door on the left side of the original oven. Simultaneously, it enhances the overall temperature uniformity in the plane. Through calculations, it is determined that the standard deviation of temperatures at the 9 points on the plane is 2.58, with an average temperature of 189
C.
Figure 13: Temperature cloud after improving the partition.
Improvement of the Folding Angle of the Folding Fan Currently, household ovens are classified into two types based on product structure: static and dynamic. Compared to static ovens, dynamic ovens are equipped with built-in heating fans, which can effectively enhance forced con- vection circulation under the traditional natural convection mode. Dynamic ovens offer faster heating, better temperature uniformity, more precise tem- perature control, and lower energy consumption (HUR, K. H., HAIDER, B. A. and SOHN, C. H., 2020; LI, X., ZHANG, J. and TAN, X., 2018; Zheng ZF and Zhu MT, 2020). Therefore, studying the impact of the heating fan structure on the temperature field of forced convection ovens is crucial. In
Optimization of the Temperature Field Inside a Forced Convection Oven 399
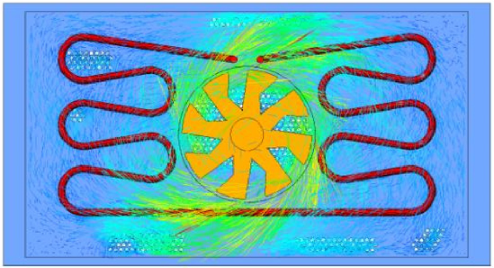
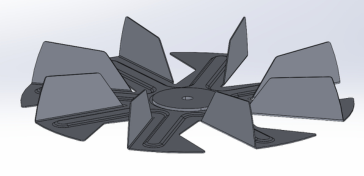
the original oven, the heating fan is installed in the center of the rear cavity and consists of eight 90
folding fan blades (see Figure 14). In this study, the influence of the heating fan structure on the oven’s temperature field was investigated by varying the fan blade angles and the number of fan blades.
Figure 14: Folding fan structure.
A larger folding fan blade angle can result in an increased head-on area of the fan, leading to greater resistance that hinders the internal airflow within the oven, potentially affecting the formation and distribution of the temper- ature field. Additionally, increasing the folding fan blade angle can induce turbulence around the fan, causing localized changes in the airflow veloc- ity between the blades. This variation in airflow velocity between the blades can have a significant impact on the stability of the air circulation within the oven.
By simulating the temperature field at different rotation angles of the oven fan blades, the standard deviation of the plane temperature and the average temperature at each angle were calculated (see Table 2). Analysis indicates that a moderate increase or decrease in the folding angle can enhance the uniformity of the internal plane temperature in the oven. However, larger changes in the angle result in poorer outcomes.
Table 2. Results from different angles of fan blades.
Final Optimization Results The simulation results indicate that both improving the baffle structure and adjusting the folding angle of the fan blades can optimize the uniformity of the plane temperature inside the oven chamber.
Figure 15: Test temperature values after improvement of the partition and fan folding angle.
On the basis of using the improved baffle, the folding angle of the rotating fan blades was modified from 90
to 96
. Experimental tests were conducted on the modified oven structure under the condition of 190
C and the hot air mode. The test results (see Figure 15), indicate that the standard deviation of the oven’s plane temperature is 1.61, the maximum temperature difference is 6
C, and the average temperature is 190. In comparison with the original oven structure, there are significant improvements.
CONCLUSION
This study comprehensively simulated the temperature and flow fields in a specific forced convection oven, and the results were validated through exper- imental testing. The analysis of the simulation results revealed key factors influencing the uniformity of oven temperatures, leading to the proposal of a structural optimization solution. The main conclusions are as follows:
1. Accurate numerical simulation method: The established numerical sim- ulation method demonstrated its reliability. When comparing the simulation results with experimental data, the average absolute error was 0.97%, and although the maximum deviation was not specified, it confirmed the high accuracy of the numerical simulation.
2. Analysis of flow and temperature fields: The study provided a detailed analysis of the distribution of flow and temperature fields inside the oven, identifying localized high and low-temperature phenomena on the plane within the oven cavity, with a maximum temperature difference exceeding 20 degrees Celsius. 3. Optimization solution: The proposed optimization solution included improving the hole distribution on the baffle and adjusting the folding angle of the fan blades, both contributing to enhancing temperature uniformity within the oven. Simultaneously optimizing the baffle and fan blade folding angles, while keeping the oven operating conditions constant, reduced the
Optimization of the Temperature Field Inside a Forced Convection Oven 401
plane temperature standard deviation from 5.75 to 1.61. Additionally, com- pared to the original oven, the average temperature of the plane increased from 185
C to 190
C.
REFERENCES
Bournet, P.-E. and Rojano, F. 2022. Advances of Computational Fluid Dynamics (CFD) applications in agricultural building modelling: Research, applications and challenges. Computers and Electronics in Agriculture, 201. Ciarmiello, M. and Morrone, B. 2016. Why not Using Electric Ovens for Neapolitan
Pizzas? A Thermal Analysis of a High Temperature Electric Pizza Oven. Energy Procedia, 101. Ding, L., Zhou, H. X., Zhong, F. H. and Feng, Z. 2019. Study on the improvement of oven temperature uniformity. Household Appliances, 36–37. Gu, S. Y., Liu, D. and Xiang, L. L. 2015. Analysis of key factors affecting tem-
perature field uniformity in oven cavities. Building Thermal Ventilation and Air Conditioning, 34, 54–58. Hur, K. H., Haider, B. A. and Sohn, C. H. 2020. A numerical investigation on the performance improvement of axial-flow automotive cooling fan with beads. Journal of Mechanical Science and Technology, 34, 3317–3323. Kim, E. L., Wang, C. Chao and Kim, H. Chul 2021. Improvement of temperature
distribution uniformity of household multifunctional steam oven based on CFD. Technology and Innovation, 3–5. Li, X., Zhang, J. and Tan, X. 2018. Experimental and numerical investigations on convective heat transfer of dual piezoelectric fans. Science China-Technological Sciences, 61, 232–241. Smolka, J., Nowak, A. J. and Rybarz, D. 2010. Improved 3-D temperature uniformity
in a laboratory drying oven based on experimentally validated CFD computations. Journal of Food Engineering, 97, 373–383. Tao, M., Wu, L. H. and Bao, X. 2018. Advances in the characterization of temperature distribution in domestic ovens. Appliance Science and Technology, 20–23. Wang, Q.-W., Shen, Q.-L., LI, X.-G. and Xiao, W.-D. 2023. Transient behavior of
an industrial-scale coke oven: CFD modeling and simulation with a fully coupled heating and coking model. Journal of Analytical and Applied Pyrolysis, 169. Wang, J., Liu, D. and Xiang, L. 2015. Heat transfer mechanism inside an oven at different operation stages. Energy Conservation Technology, 33, 539–545. Yuan, H., Wu, D. T., Qin, S., Zheng, X., Wu, P. and Huang, B. 2017. Tempera-
ture field characteristics of forced convection oven and its optimization. Food and Machinery, 33, 73–78. Zhang, Lanxin, Liu, Dong and Xiang, Linlin 2015. Optimization study of temperature field in oven cavity under different operation modes. Building Thermal Ventilation and Air Conditioning, 34, 33–35+16. Zheng ZF and Zhu MT 2020. Parametric design and optimization of engine cooling
fan blades. Mechanical Design and Manufacturing, 74–77+82.
LISTED IN THE AHFE DIGITAL BOOKSTORE CATALOGUE
Explore the complete digital volume
Intelligent Human Systems Integration (IHSI 2024): Integrating People and Intelligent Systems
Read this individual research paper free through the original publisher, or explore the full digital proceedings book.
ISBN 978-1-958651-95-7
Explore this ISBN in the AHFE Bookstore ↗Listed in the July 2026 bookstore catalogue; search by ISBN to confirm current availability · Digital book purchase optional