Jiacheng Wang, Regina W Y Wang (2024). Brand associations with traffic patterns in store layout planning. In: Affective and Pleasurable Design. AHFE Open Access, vol. 123, pp. 190–198. https://doi.org/10.54941/ahfe1004690
In a brand store, different traffic patterns emerge as the layout plan guides customers toward what they want to buy. This study aims to clarify the types and definitions of traffic patterns, to understand the preferences of spatial designers for traffic patterns, and to explore the relationship between traffic patterns and brand associations. Focus group interviews with experts with spatial design backgrounds were conducted to obtain textual information, and the data analysis method of grounded theory was applied for content analysis. The study found that: (1) there are three types of store traffic patterns: open, sequential, and path-based traffic design; (2) space designers prefer to consider three categories in the design of store traffic patterns: layout flow, feedback and decorative atmosphere; and (3) To create a brand association, product characteristics, price information, and store lighting are regarded as the three most important properties.
As a place of direct interaction between brands and customers, the role of physical shops in branding and customer perception is crucial. The layout and design of a brand in a shop not only affect the customer’s shopping experience but also profoundly create their brand association and emotional connection (Godovykh & Tasci, 2020). Feiereisen et al. (2020) suggested that the inclu- sion of multi-media visuals in the path of action can enhance the ambiance of the environment, thus better communicating the brand story to the cus- tomer. Studies have demonstrated that product images in online shops have an impact on customers’ emotions and purchase intentions (Laroche et al., 2022). As the final presentation of an outlet space is the work of a spatial designer, it is important to understand the design perceptions and preferences of spatial designers; therefore, this study is interested in determining how brand associations are generated by the types of traffic patterns in offline shops from a spatial designer’s professional perspective. The objectives of this study are as follows:
Brand Associations With Traffic Patterns in Store Layout Planning 191
(1) To identify the types and definitions of physical brand shop traffic patterns. (2) To conduct in-depth interviews with spatial designers on their design cognition and preference for brand association traffic patterns.
STORE LAYOUT PLANNING AND TRAFFIC PATTERNS The store layout is a map of a shop’s interior that shows the ideal routes of the various sections, shelves or fixtures, and customer flow, all about the available space (Inglay & Dhalla, 2010; Singh et al., 2014). The ideal layout of a store should provide a good shopping experience through in-store traffic patterns, which in turn increases shop sales and customer loyalty (Gul et al., 2023). Vrechopoulos et al. (2004) summarised the main layouts in a store into three types: free-form layout, runway layout, and grid layout. Heikkinen (2016) and Kallinen and Autio (2021) found that customers searching for a product in a store is like searching for an exit in a maze, so the three traffic patterns are summarised based on the maze game: open, sequential, and path- based. These three different types of movement bring different experiences.
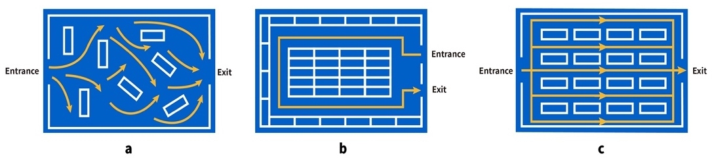
Open Traffic Pattern The open traffic pattern is a completely free-movement track where all shelf nodes are independent of each other (Figure 1a). The node is the position of the customer in the path, and the shelf node is the intersection of the shelves arranged in such a way as to further stimulate the purchase of goods (RET, 2021). Such traffic patterns are often found in free-form shop layouts, where shoppers do not feel rushed or compelled to look for products, resulting in more time spent looking and more potential revenue for the shop owner (Ijaz et al., 2011; Ijaz et al., 2014). Open lines of movement in a free-form layout allow customers to enjoy a high degree of freedom of movement within the shop, increasing the amount of time they are willing to spend in the shop, and making it easier to browse for products (Levy & Weitz, 2001).
Sequential Traffic Pattern Sequential traffic patterns rely on a completely linear path-based pattern, with each node leading to the next and only node (Figure 1b). The main advantage of sequential traffic patterns is that they allow shoppers to navigate through all of the shop’s merchandise easily and fluidly, which can often be seen in a runway layout, where a runway-shaped path separates the edges of the sales floor from the interior space and provides one exit and one entrance (Yapicioglu & Smith, 2012). Larry Montgomery, former CEO of Kohl’s, one of the first retailers to use the runway layout in the United States, said, “When products are arranged logically from front to back on the shelves, customers can spend less time and buy more” (Epmeier, 2001).
Path-Based Traffic Pattern Multiple paths exist at the same time, and the nodes in each path are not con- nected to form path-based traffic patterns (Figure 1c). This pattern is often found in grid layout shops such as grocery shops and drugstores, as customers usually enter the shop for a reason, and therefore the grid layout is designed
192 Wang and Wang
to satisfy the needs of the customers (Elbers, 2016). In this layout, shelves of merchandise divide the main aisles into grid compartments, creating traf- fic patterns that will facilitate planned shopping behavior and the ability to quickly find items on the shopping list (Lewison, 1989).
Figure 1: Store layout planning and traffic patterns. (Blue: store area; white boxes: shelves; white lines: vendor walls; yellow arrows: traffic patterns).
BRAND ASSOCIATION AND SPATIAL PLANNING Keller (1993) suggested that brand associations are divided into three compo- nents: attributes, benefits, and attitudes, while Alfina et al. (2021) compared online network marketing with offline experiential marketing and found that the offline mode of marketing had a stronger positive effect on brand associations. Shon and Song (2021) emphasized that the ambiance of the interior design had a positive effect on brand associations with coffee, and the presentation of the brand logo had the most significant effect on brand personality.
Attributes Association Brand attributes include brand personality and the product personality that comes with the product function itself (Cheng-Hsui Chen, 2001). Prod- uct personality refers to price information, user type, and context of use (Govers & Schoormans, 2005; Keller, 1993). The spatial atmosphere of a brand’s shop will affect customers’ price sensitivity (Friedman & Hendry, 2019), and similarly, the transparency of price information affects the direc- tion of customer movement, making people more likely to move to areas where prices are open and transparent (Vanhuele & Drèze, 2002).
Benefits Association Keller (1993) concluded that benefit association refers to the benefits that customers perceive the product or service to bring to them, which are cate- gorized into functional benefits of service provision, experiential benefits of sensory pleasure, and symbolic benefits of social recognition. Research has shown that colors in brand associations can influence benefit associations; for example, blue gives people a sense of reliability and security (Jin et al., 2019).
Attitudes Association The attitudinal association is the overall evaluation of a brand by cus- tomers and is the basis of customer behavior. Features, functional benefits,
Brand Associations With Traffic Patterns in Store Layout Planning 193
experiential benefits, and symbolic benefits related or unrelated to a prod- uct are all associated with attitudinal associations (Rohit & Panda, 2018). A study investigating football club branding found that there is a correlation between fans’ attitudes towards the club brand and the club’s layout planning, where placing more televisions broadcasting matches and informational pan- els favorable for placing bets in the space can increase the willingness to pay for bets and the amount of money paid (Azadi et al., 2015).
RESEARCH METHODOLOGY This study uses the focus group interview method to obtain textual data and to analyse the data. The research process was divided into four stages: Stage One set up the interview questions; Stage Two collected samples of branding and layout traffic patterns; Stage Three conducted in-depth interviews with focus groups with spatial design backgrounds; and Stage Four coded the data and summarised the results of the interviews.
Question Design This study aims to understand spatial designers’ perceived preferences for brand association affecting the planning of movement patterns through in- depth interviews, and to obtain a more nuanced interpretation of the elements in the store space. The interview question was: Based on the spatial designer’s experience with 30 brand samples and three traffic patterns, describe in detail the preferences for designing traffic patterns to create brand associations in a branded store.
Sample Collection The sample for this study consists of brand samples and traffic pattern sam- ples. The brand sample is the largest sampling area that appeals to the most popular stores known to Taiwanese customers, and satisfies the richness of the brands in the sample. Therefore, this study adopted convenience sampling to select the top 20 of the best global brands (2022) and the top 10 brands commonly seen in Taiwan (Taiwan Brand List, 2022) to form a total of 30 brand samples for this study. All of them have offline shops, and the names of the brand samples are given in Table 1.
Table 1. Brand samples.
Table available in the original PDF paper.
Brand Samples Disney Samsung McDonald’s Apple Huawei Tesla H&M Starbucks Nike Adidas Chanel BMW ZARA KFC Audi Hermes IKEA Louis Vuitton Toyota Volvo Seven-eleven FamilyMart 85 Cafe Costco Uniqlo Nitori Carrefour Eat together LEGO MUJI
194 Wang and Wang
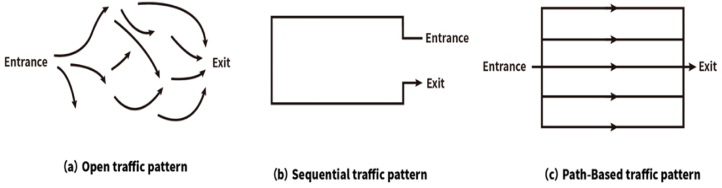
Sample traffic patterns were plotted for the traffic patterns collated in this study, namely open traffic patterns (Figure 2a), sequential traffic patterns (Figure 2b), and path-based traffic patterns (Figure 2c).
Figure 2: Sample traffic patterns.
Focus Group Interview Six space designers were interviewed for this study and their qualifications was limited to less than 5 years. All the interviewees were familiar with store design and had shopping experience. The basic information of the interviewees is shown in Table 2.
Table 2. Basic information of participants.
Table available in the original PDF paper.
No. Age Professional Qualification Participant 1 30 Interior Design 8 years Participant 2 29 Architectural Design 7 years Participant 3 23 Landscape Design 5 years Participant 4 23 Interior Design 5 years Participant 5 28 Architectural Design 6 years Participant 6 22 Interior Design 4 years
After sample collection, focus groups were conducted in a online format. To ensure a quiet and isolated interview environment, a meeting room was created in Microsoft Teams software and participants were asked to switch on their communication devices in a distraction-free mode. During the inter- view, three traffic patterns and 30 brand samples were displayed as pictures on the participants’ computer screens with a resolution of 1080px*1920px to ensure clear image quality.
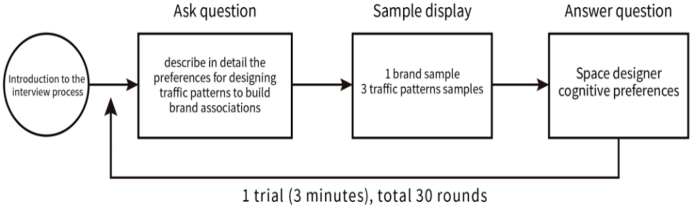
This study was conducted online during June 2023, with the researcher act- ing as a moderator for the focus groups, to introduce the interview steps and implementation process. Firstly, questions were asked, then the sample was presented, consisting of a brand sample and three traffic patterns, and focus group members were asked to express their cognitive preferences regarding the sample. The above 1-trial process took about 3 minutes, and 30 trials of 30 brand traffic patterns took about 90 minutes. A break was provided if the participants got tired in the middle of the process, and the duration of the break was decided by the participants themselves. For the focus group interview process see Figure 3.
Brand Associations With Traffic Patterns in Store Layout Planning 195
Figure 3: Focus group interview in-depth process.
Raw Data Analysis Areas of particular interest were identified before the start of the study: lay- out planning, traffic patterns, and brand associations. The interviews were audio-recorded and subsequently converted into verbatim transcripts and applied, using NVivo qualitative research data analysis software for the three- level coding of the textual data, according to the following steps (Strauss, 2017; Strauss & Corbin, 1998): (1) the verbatim transcripts of the six focus group interviews, totaling a total of 20,002 words of textual raw data, were imported into NVivo version 12.0 software as Word documents. (2) One researcher performed open coding by labeling the sentences and words with the same meaning as codes and then classifying the codes into properties. (3) Next, we focused on the related similar properties and unified them into a clear dimension, which is called axial coding. (4) Finally, the axial coding of the dimensions with commonality and similar characteristics was classified as a category, which is selective coding.
RESULT
This study identifies and examines how spatial design contextualisers pre- ferred design traffic patterns and important factors to create brand associa- tions. The results are presented below.
Interview Data Coding and Descriptive Statistics In this study, six spatial designers were interviewed, and open-coded verbatim scripts were classified into 18 properties, which were transformed into seven dimensions of axial coding, and then selective coding was classified into three categories. The descriptive statistics are shown in Table 3.
196 Wang and Wang
Table 3. Interview in-depth data coding and descriptive statistics.
Table available in the original PDF paper.
Stage 1 Stage 2 Stage 3 open coding (property) Number of Codes (n)/%
axial coding (dimension)
Number of Codes (n)/%
selective coding (category) Number of Codes (n)/% advertising posters 1/0.6% Decoration style
14/9.0% Decorative atmosphere 22/14.2% materials 4/2.6% lighting 7/4.5% model presentation 2/1.3% shopping atmosphere 5/3.2% Atmosphere 8/5.2% service atmosphere 3/1.9% product attributes 27/17.4% Shelf layout 50/32.3% Layout flow 89/57.4% display shelf 3/1.9% placement method 20/12.9% free movement 13/8.4% Line track 39/25.2% single line action 17/11.0% multiple lines action 9/5.8% experience of use 8/5.2% Customer feedback
19/12.3%
11/7.1% Information feedback 44/28.4% emotional feedback 3/1.9% brand personality 7/4.5% Brand image 14/9.0% shop profile 7/4.5% price information 10/6.5% Product overview users image 9/5.8% Total 155 / 100%
Source: this study
Pattern Preferences of Brand Associations of Spatial Designers This study identified three design categories that most influence brand asso- ciations and traffic patterns in order of magnitude: layout flow (57.4%, n = 89), information feedback (28.4%, n = 44), and decorative atmosphere (14.2%, n = 22). The Layout category includes two dimensions: Shelf layout (32.3%, n = 50) and line track (25.2%, n = 39). In the dimension of shelf layout, the spatial designers consider first the product characteristic (17.4%, n = 27). For the dimension of the line track, the preferred property was single alignment (11.0%, n = 17).
The categories of information feedback included the following dimen- sions: product overview (12.3%, n = 19), brand image (9.0%, n = 14), and customer feedback (7.1%, n = 11). The priority design for the product infor- mation dimension was price information (6.5%, n = 10). The brand image dimension consisted of two properties, brand personality (4.5%, n = 7) and shop profile (4.5%, n = 7). The customer feedback dimension experience of use (5.2%, n = 8) was most considered by spatial designers.
The decoration atmosphere category includes two dimensions: decoration style (9.0%, n = 14) and atmosphere (5.2%, n = 8). In the decoration style dimension, the most important design property to be considered was the lighting (4.5%, n = 7) of the store. For the atmosphere dimension, the shop- ping atmosphere (3.2%, n = 5) and service atmosphere (1.9%, n = 3) were important.
Brand Associations With Traffic Patterns in Store Layout Planning 197
CONCLUSION
Nowadays, the three main types of traffic patterns are open traffic patterns, sequential traffic patterns, and path-based traffic patterns. Spatial designers prioritize the following in the design of traffic patterns: layout flow, infor- mation feedback, and decorative atmosphere. To create brand associations, the preferred design dimensions include shelf layout, product overview, and decoration style. The most important properties are product characteristics, price information, and lighting.
Although this study distinguishes between international brands and local Taiwanese brands in the brand sample, no differences in traffic patterns and brand associations between the two were found in the interviews. This can be further explored in future research.
ACKNOWLEDGMENT
I would like to express my deepest appreciation to my lab, Design Perceptual Awareness Laboratory, Taiwan Building Technology Center.
REFERENCES
Alfina, A., Khoirina, M. M., & Ulya, M. (2021). The Role of Omnichannel and Experiential Marketing to Build Brand Association in ZAP Clinic. Binus Business Review, 12(3), 255–261. Azadi, A., Esfahani, D. N., & Mohammadpoori, M. (2015). Relationship between
brand association and brand loyalty in the fans of private clubs in Iran. Biomed Pharmacol Journal, 8(2), 1–8. Cheng-Hsui Chen, A. (2001). Using free association to examine the relationship between the characteristics of brand associations and brand equity. Journal of product & brand management, 10(7), 439–451. Elbers, T. (2016). The effects of in-store layout-and shelf designs on consumer
behavior. Wageningen UR, 1–22. Epmeier, B. (2001). A ‘racetrack:’ would it work for supermarkets? https://web.archive.org/web/20090911083333/http://findarticles.com/p/artic les/mi_m0BPE/is_4_10/ai_74991370/ Feiereisen, S., Rasolofoarison, D., Russell, C. A., & Schau, H. J. (2020). One Brand, Many Trajectories: Narrative Navigation in Transmedia. Journal of Consumer Research, 48(4), 651–681. https://doi.org/10.1093/jcr/ucaa046 Friedman, B., & Hendry, D. G. (2019). Value sensitive design: Shaping technology
with moral imagination. Mit Press. Godovykh, M., & Tasci, A. D. A. (2020). Customer experience in tourism: A review of definitions, components, and measurements. Tourism Management Perspec- tives, 35, 100694. https://doi.org/https://doi.org/10.1016/j.tmp.2020.100694 Govers, P. C., & Schoormans, J. P. (2005). Product personality and its influence on
consumer preference. journal of consumer marketing, 22(4), 189–197. Gul, E., Lim, A., & Xu, J. (2023). Retail store layout optimization for maximum product visibility. Journal of the Operational Research Society, 74(4), 1079–1091. Heikkinen, O. S., J. (2016). Designing an Escape Room with the Experience Pyramid
Model. Ijaz, M. F., Rhee, J., Lee, Y.-H., & Alfian, G. (2014). Efficient digital signage layout as a replacement to virtual store layout. International journal of information and electronics engineering, 4(4), 312.
198 Wang and Wang
Inglay, R. S., & Dhalla, R. S. (2010). Application of systematic layout planning in hypermarkets. Proceedings of the 2010 international conference on industrial engineering and operations management. Jin, C., Yoon, M., & Lee, J. (2019). The influence of brand color identity on brand
association and loyalty. Journal of product & brand management, 28(1), 50–62. Kallinen, H., & Autio, A. (2021). Yrityksen uusasiakashankinta ja sosiaalisen median hyödyntäminen markkinoinnissa Case: WayOut Oy S4MPO. Keller, K. L. (1993). Conceptualizing, measuring, and managing customer-based
brand equity. Journal of marketing, 57(1), 1–22. Laroche, M., Li, R., Richard, M.-O., & Zhou, M. (2022). An investigation into online atmospherics: The effect of animated images on emotions, cognition, and purchase intentions. Journal of Retailing and Consumer Services, 64, 102845. https://doi.org/https://doi.org/10.1016/j.jretconser.2021.102845 Lewison, D. M. (1989). Essentials of retailing. (No Title). RET. (2021). Grasp the 7 key touch points to make the transaction simple. https:
//www.sohu.com/a/453496099_505841 Rohit, D., & Panda, R. (2018). Cause-brand association and consumer attitude: a review. Indian Journal of Commerce and Management Studies, 9(1), 61–71. Shon, J. H., & Song, J. (2021). Effect of Design Elements and Brand Identity on
Brand Association, Brand Personality, and Brand Image: Focusing on Franchisee Coffee Shop. The Korean Journal of Franchise Management, 12(3), 21–34. Singh, P., Katiyar, N., & Verma, G. (2014). Retail shoppability: The impact of store atmospherics & store layout on consumer buying patterns. International journal of scientific & technology research, 3(8), 15–23. Strauss, A., & Corbin, J. (1998). Basics of qualitative research: Techniques and
procedures for developing grounded theory, 2nd ed. Sage Publications, Inc. Strauss, A. L. (2017). The discovery of grounded theory: Strategies for qualitative research. Routledge. Vanhuele, M., & Drèze, X. (2002). Measuring the price knowledge shoppers bring
to the store. Journal of marketing, 66(4), 72–85. Vrechopoulos, A. P., O’keefe, R. M., Doukidis, G. I., & Siomkos, G. J. (2004). Virtual store layout: an experimental comparison in the context of grocery retail. Journal of retailing, 80(1), 13–22. Yapicioglu, H., & Smith, A. E. (2012). Retail space design considering revenue and
adjacencies using a racetrack aisle network. IIE Transactions, 44(6), 446–458.
LISTED IN THE AHFE DIGITAL BOOKSTORE CATALOGUE
Explore the complete digital volume
Affective and Pleasurable Design
Read this individual research paper free through the original publisher, or explore the full digital proceedings book.
ISBN 978-1-958651-99-5
Explore this ISBN in the AHFE Bookstore ↗Listed in the July 2026 bookstore catalogue; search by ISBN to confirm current availability · Digital book purchase optional