Jiacheng Wang, Liangming Jia (2023). Usability of music application interface systems. In: Usability and User Experience. AHFE Open Access, vol. 110, pp. 262–268. https://doi.org/10.54941/ahfe1003199
The mobile digitalization of music has been a part of people's lives for a few decades. As people enter the stage of transformation from Web 2.0 to 3.0, traditional Internet carriers and other major companies' apps are facing a change. In addition to the quality of the digital products that come with the apps themselves, the visual matching of the user interface, the logic of the operating framework and the adhesion of the user community have all become key factors. Purpose: This study aimed to examine the preferences, behaviors, and ease of use of music apps by students in tertiary institutions, the mainstream group of internet users, in order to provide reference suggestions for the future development of music apps in the Web 3.0 stage.Methods: In this study, the top three apps downloaded (Sample 1 "Spotify"; Sample 2 "QQ music," and Sample 3 "NetEase Cloud Music") were selected from the existing apps in China and Taiwan for the experimental design. The experiment consisted of five task steps: (A) bookmarking songs; (B) sharing songs with friends; (C) creating a new song list with a specific name; (D) searching for a specific song; and (E) changing personal information. Thirty subjects were recruited (purposive sampling), with 10 participants operating each app. Data were collected on task performance time and from the System Usability Scale (SUS), Post-Study System Usability Questionnaire (PSSUQ) and semi-structured interview results. The collected data were tested by one-way ANOVA and LSD post-hoc tests to confirm the significance between variables and specific analyses.Results: The results showed that (1) among the five operational tasks, Task A (p = 0.01 < 0.05) showed a significant difference in operational performance; then, according to the LSD post-hoc test results, the operational time of Sample 1 (M = 15.30, SD = 8.98) was significantly lower than that of Sample 3 (M = 33.67, SD = 16.77), which was not significantly different from that of Sample 2 (M = 23.11, SD = 9.89). There was no significant difference with Sample 2 (M = 23.11, SD = 9.89). (2) According to the SUS scale results, there was a significant difference in the participants' evaluation of the ease of use of the three apps (p = 0.01 < 0.05). According to the LSD post-hoc test results, Sample 1 (M = 85, SD = 8.82) was significantly higher than Sample 2 (M = 66.25, SD = 17.05) and Sample 3 (M = 69.75, SD = 13.15), with no significant difference between Samples 2 and 3. (3) According to the PSSUQ results, there was a significant difference in the interface quality profile, as seen in the LSD post-hoc test results, where Sample 2 (M = 2.93, SD = 0.72) scored significantly lower than Sample 1 (M = 3.9, SD = 0.85) and Sample 3 (M = 3.9, SD = 0.61).Discussions: The three apps are all music players, and the underlying logic of operation is the same, so there is little noticeable performance difference. Sample 1 is the only one of the three apps that has black as the primary visual color of the interface, with green accents. The darker color enhances the user's time to complete tasks and provides a better user experience. When performing tasks, the subjects would invariably look for the icon representing their data in the bottom right corner.
Currently, the traditional music industry consumption chain with CDs and DVDs as the medium has broken, and the Internet has become the abso- lute mainstream of the music industry. The growth of young groups, the innovation of ecology, and the popularity of new entertainment with short videos have given the digital music market model the potential to continue to develop. With the rise of Generation Z, which has a stronger sense of copyright, the market for actual music consumption will continue to expand, bringing more development opportunities for original musicians. In addition, standardized copyright management also brings higher operating costs. It is challenging for pure music content platforms to make a profit, therefore requiring the platforms to actively create more service content, in addition to a single purchase, subscription, advertising, and other ways to find more pro- fit models and innovative interaction modes to give the platform users more choices, and to create greater user stickiness and payment scenes, in order to make the market continue to grow and expand. Nowadays, short videos have become the newest traffic, and the demand for music is increasing daily, so the music industry and short video industry are joining hands for mutual benefit. This study aimed to examine the preferences, behaviors, and ease of use of music apps by students in tertiary institutions, the mainstream group of internet users, to provide reference suggestions for the future development of music apps in the Web 3.0 era.
Usability of Music Application Interface systems 263
Development of Application Interface and User Experience We have to mention the visual recognition function for the quantitative evaluation of developing music app interface icons. The visual cognitive function involves some cognition, not only visual reception but also the pro- cessing of the received visual information and the output of our adaptive behavior after analyzing and processing in the brain. It has been divided into three points.
(1) There are many types of Visual Attention, such as alertness, selective attention, and distracted attention. Attention is indispensable in many learning tasks because poor attention will affect subsequent memory performance. (2) Visual Memory is divided into two main categories of domain-specific memory, and is mainly used to remember images, events, and facts, such as triangles, circles, and squares. Procedural knowledge is to remember the sequence of some tasks, that is “how to do” the task, like taking out a pencil box and pen before doing homework. (3) Visual Discrimination: This ability allows us to distinguish between visual stimuli, and to see which details are the same and which are dif- ferent. The standard discrimination abilities are recognition, matching, and sorting.
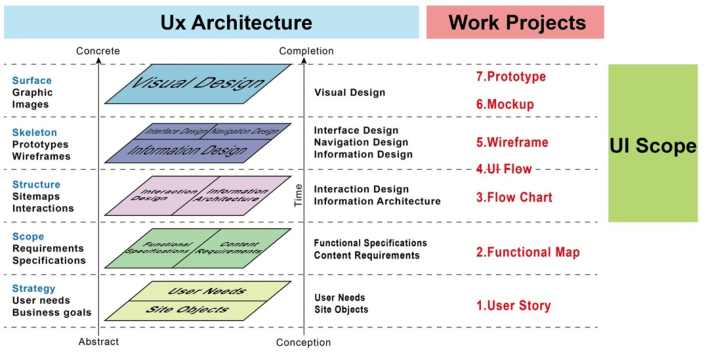
Two factors influence the user’s performance when using an interface: the interface design style and the feedback from the interface buttons. It consists of three dimensions, P, A, and D, each of which has four questions and is a semantic differential scale, where P = Pleasure: the attractiveness of design elements; A = Activation: engagement in thinking; and D = Dominance: the pressure to process information. Chen (1999) pointed out that there are two types of user interface: Concrete and Abstract. Concrete interfaces are touchable and users interact with them tangibly; they emphasize the design considerations of the user’s body and physiology. They help the user to inte- ract with and recognize and understand the interface in an intangible way. The entire user interface design logic, from the front-end design strategy to the final visual performance, can be organized as shown in the following diagram (see Figure 1).
Experimental Design In this study, the experimental design included between-subjects and semi- structured interview components. The three most downloaded applications (sample 1: “Spotify”; sample 2: “QQ Music,” sample 3: “NetEase Cloud Music”) from the existing applications in mainland China and Taiwan were selected for the experimental design. Finally, 30 students from the school were invited to participate in the experiment using convenience sampling. The operational tasks involved in the experiment were set for the standard functions of the interface, and the experiment consisted of five task steps (see Table 1).
In this study, the experimental device was an Apple smartphone, model iPhone 12 Pro, with a 6.1-inch OLED full-screen, XDR display, 2532*1170
264 Jiacheng and Liangming
Figure 1: User interface design logic. (user interface design guidelines, 2020).Table 1. Music app experiment task operation description.
Table available in the original PDF paper.
No. Purpose of Service Operation steps A Bookmark function
Go back to the home page, check your personal account and change your avatar to a cat
Go to the music recommendation area in the app home page, add the first song in the first recommen- ded song list to “My Song List” B Share function Find the song you just added in “My Song List” and click Share C New function Go back to the home page, create a new song list and name it as “Favorite.” D Search function Go back to the home page, search for “Missed by Love” and click play E Personal information function
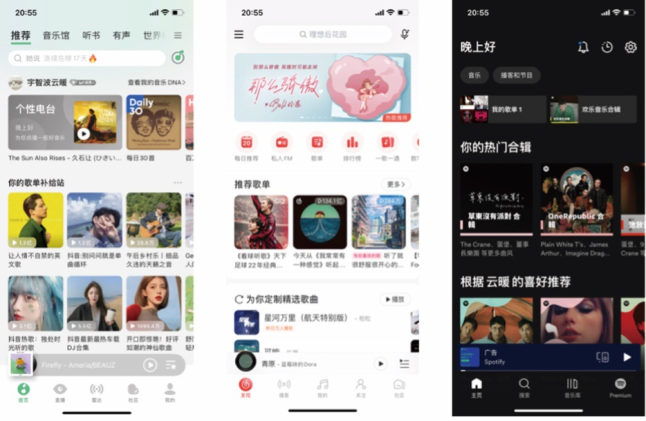
pixels, 460ppi resolution, and iOS 16.0.2 operating system. The following are the home pages of the three experimental samples (see Figure 2).
The questionnaire was designed with three dimensions in mind: (1) Basic information questionnaire We surveyed the gender, age, education level, and frequency of using music apps to gain a preliminary understanding of the subjects’ information.
(2) Operational task questionnaire This part was conducted in a between-subjects experiment to understand the usage status of the interface operation of the music playback app through the results of 30 subjects’ tasks. Ten participants operated each sample. The experiment was conducted with three samples of five tasks to record the operation time and observe the operation behavior and fluency of the subjects.
(3) Scale questionnaire and interview Scale and interview: The scale questionnaire is based on the System Usabi- lity Scale (SUS) and the Post-Study System Usability Questionnaire (PSSUQ),
Usability of Music Application Interface systems 265
Figure 2: App operation interface home pages (From left to right are spotify, QQ music and netEase Cloud music).
comprising 26 questions in four directions. Participants were asked to rate the experimental samples after completing the interface operations and then to conduct targeted interviews.
DISCUSSION
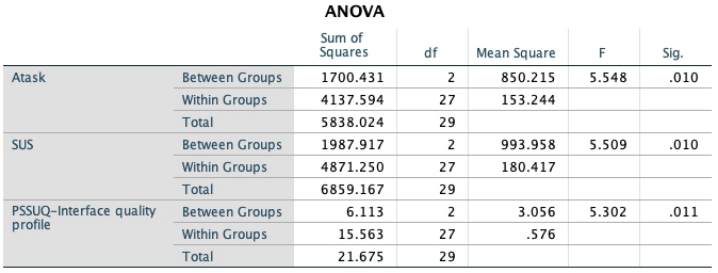
Data were collected on task performance time and from the System Usability Scale (SUS), Post-Study System Usability Questionnaire (PSSUQ), and semi- structured interview results. One-way ANOVA and LSD post-hoc tests tested the collected data to confirm the significance between variables and specific analyses. The data results with significant type are as follows (see Figure 3).
(1) Operational Performance Significance Among the five operational tasks, Task A (p = 0.01 < 0.05) showed a signi- ficant difference in operational performance (see Table 2); then, according to
Figure 3: Three obvious questionnaire data.
266 Jiacheng and Liangming
Table 2. Statistical data results of the five tested items (unit: seconds).
Table available in the original PDF paper.
No. Sample 1 M (SD) Sample 2 M (SD) Sample 3 M (SD) F Sig.
A 21.30(14.41) 23.11(9.89) 33.67(16.77) 2.283 0.010* B 28.50(19.50) 18.93(4.65) 20.64(7.15) 1.725 0.197 C 33.97(27.82) 43.55(37.78) 24.25(10.60) 1.208 0.314 D 22.83(6.10) 23.36(7.63) 21.12(8.46) 2.126 0.139 E 31.39(5.11) 29.11(28.09) 28.42(7.79) 0.391 0.68
Table 3. A -Task data descriptives & LSD post-hoc tests.
App Mean Std. Deviation SUS Grade Spotify 85.00 8.82 B QQ 66.25 17.05 D Nets 69.75 13.15 C
the LSD post-hoc test results (see Table 3), the operational time of Sample 1 (M = 15.30, SD = 8.98) was significantly lower than that of Sample 3 (M = 33.67, SD = 16.77). There was no significant difference for Sample 2 (M = 23.11, SD = 9.89). (2) System Usability Questionnaire (PSSUQ) Significance SUS scale was used: for positive questions 1, 3, 5, 7, and 9, 1 was subtracted from the score of each question to obtain the final score of each question, e.g., the original score of the first question was 3, and after subtracting 1, the score was 2. For the negative questions 2, 4, 6, 8, and 10, the score of each question was subtracted from 5, e.g., the score of question 2 was 4, and 5 minus 4 equals 1. Finally, the total score of all questions was multiplied by 2.5 to get the total SUS score (see Table 4). According to the SUS scale results (see Table 5), there was a significant difference in the participant’s evaluation of the ease of use of the three apps (p = 0.01 < 0.05). According to the LSD post-hoc test results, Sample 1 (M = 85, SD = 8.82) scored significantly higher than Sample 2 (M = 66.25, SD = 17.05) and Sample 3 (M = 69.75, SD = 13.15), with no significant difference between QQ and Nets.
Usability of Music Application Interface systems 267
Table 5. SUS data descriptives & LSD post-hoc tests.
Analyzing specific data combined with feedback from subjects in semi- structured interviews, the high level of user satisfaction for Spotify (sample 1) was due to the overall visual color of the interface, with dark colors as the background quickly increasing the user’s correct operation rate, and the use of dark colors quickly allowing visual filtering of too many squared-off noise buttons.
(3) System Usability Questionnaire (PSSUQ) Significance The three components of the post-study system usability questionnaire are system usability, information quality, and interface quality profile. Accor- ding to the PSSUQ results (see Table 6), there was a significant difference in the interface quality profile, as seen in the LSD post-hoc test results, where Sample 2 (M = 2.93, SD = 0.72) scored significantly lower than Sample 1 (M = 3.9, SD = 0.85) and Sample 3 (M = 3.9, SD = 0.71) Analysis of specific data combined with feedback from subjects in semi- structured interviews showed that the speed and accuracy of operations were significantly lower when using QQ. Participants responded that the QQ inter- face looks more trivial than Nets, and the primary color palette is a white background with light green accent colors, which makes it less recognizable than the red accent colors of Nets. That is the main reason for the low score on the Interface quality profile.
268 Jiacheng and Liangming
CONCLUSION
Different conclusions were drawn from three research directions through the operational performance of the five tasks and the feedback from the semi- structured interviews.
(1) Operational Performance The dark-color operation mode can reduce people’s operation time and improve operational performance. It helps users find the content they want in a short time. When performing E-tasks, the subjects would look for the icon representing their data in the bottom right corner. The long-standing traditional interface design layout has already imposed behavioral norms on people’s actions. If the designer wants to adjust the position of the buttons for similar functions in the future, they need to pay extra attention to it; otherwise, it will confuse the users in their search.
(2) Interface Quality The participants wanted to add a feature to the interface visualization: the ability to customize the primary and secondary tones. In the Spotify (sample 1) interview, several participants said they liked the darker interface but did not like the green accent color.
(3) System Usability The three apps are all music players, and the underlying logic of operation is the same, so there is little noticeable performance difference. Sample 1 is the only one of the three apps that has black as the primary visual color of the interface, with green accents. The darker colors enhance the user’s time to complete tasks and provide a better user experience. The night background does make it easier for the user to get it right, and the use of dark colors makes it easier to filter out too many boxy noise buttons visually.
REFERENCES
Chien-Hsiung Chen. (1999). “Interface Usability in User-Centered Interaction Design”, Ming Chuan University Cross-Century International Academic Sympo- sium Proceedings, Ming Chuan University, pp. 99–109 Norman (2013). The Design of Everyday Things (Revised & expanded edition). User Interface Design Guidelines (Feb 27, 2020) Website: http://jinjin.mepopedia.com/∼jinjin/ui/ui-01.html Yang, G. Z., Dempere-Marco, L., Hu, X. P., & Rowe, A. (2002). Visual search:
psychophysical models and practical applications [Review]. Image and Vision Computing, 20(4), 291–305. Yu, N., Ouyang, Z. W., Wang, H. H., Tao, D., & Jing, L. (2022). International Journal of Environmental Research and Public Health, 19(4), 15, Article 2391. Zhou, C. M., Qian, Y. W., Huang, T., Kaner, J., & Zhang, Y. R. (2022). Frontiers in
Psychology, 13, 14, Article 935202.
LISTED IN THE AHFE DIGITAL BOOKSTORE CATALOGUE
Explore the complete digital volume
Usability and User Experience
Read this individual research paper free through the original publisher, or explore the full digital proceedings book.
ISBN 978-1-958651-86-5
Explore this ISBN in the AHFE Bookstore ↗Listed in the July 2026 bookstore catalogue; search by ISBN to confirm current availability · Digital book purchase optional