Sara Viviani, Alessia Brischetto, Daniele Busciantella-Ricci, Alessandra Rinaldi (2024). Design for inclusion in maps design, for optimizing data usability and readability. The case study of two Healthy Maps. In: Design for Inclusion. AHFE Open Access, vol. 128, pp. 109–119. https://doi.org/10.54941/ahfe1004796
This paper describes how the integration of cognitive and organizational information design skills can support the design of inclusive maps. The contribution reports the results of “Quartieri Sani HUB”, a research project, which has among its outputs the definition of two health maps, referring to two neighborhoods used as case study. For the map design a critical review of the literature on the tools of the mentioned disciplines, analysis of best practices and verification on the design level was conducted.“Quartieri Sani HUB” addresses the topic of healthy cities, declining it at neighborhood scale, and the relationship between the built environment and health to promote healthy lifestyles and develop inclusive contexts. The overall objective of the project concerns the definition of design scenarios and strategic factors aimed at improving the physical environmental conditions of public space through the "research-action" methodological approach on two representative case studies of the metropolitan city of Florence as the ground for research and experimentation. In the analysis phase, within the two reference case studies, the potential and opportunities offered by the built environment in producing health were focused on. The emerged results supported the development of an information tool, indicating how to enjoy the neighborhood and related healthy services. Through a systemic and transcalar vision, therefore, the research team identified the "health map" as a communicative artifact capable of producing a knowledge and awareness-raising impact on the urban areas and their citizens, wiìth regards to the project issues.For the development of the health maps design, as a tool aimed at citizens for orientation and choice of usable healthy routes, places and activities within the reference case study, the goal was to optimize the understanding, usability and readability of the data. Thus, the research activity was aimed at making the data on the map clear, readable, accessible and usable by a broad target audience. Thus, the following research questions emerged: i) what are the design components of maps, which lead to effective improvement in information comprehension and reduce user response time during interaction; ii) what are the corresponding design principles applicable to map design; iii) what are the main tools for information selection and encoding in the development of design outputs, iv) how does the use of color impact inclusive readability.The research team has investigated the relationships between information design and map design, produced the prerequisites for the theoretical and design testing of the map, created the conditions for the testing phase with expert users through an interdisciplinary workshop, and is creating the conditions for the usability testing phase with citizens in the field. The article, therefore, describes the activities and the role that design has played on the topic in an interdisciplinary research context, through the following development phases: i) critical literature review, ii) evaluation of best practices, iii) preliminary development of health maps; iv) iteration of the prototyping phase.What emerges is the ability of the design discipline to enrich the user experience, reporting a collaborative research experience between different disciplines of representation and communication and colour design, and the preliminary outputs of the health maps design.
The research unfolds starting from the research project “Quartieri Sani HUB” (QSH), which addresses the theme of healthy cities, at the neighbourhood scale, and the relationship between the built environment and health to pro- mote healthy lifestyles and develop inclusive contexts (Setola et al., 2023). The project aims to define design scenarios and strategic factors to improve the physical-environmental conditions of public space through the “research- action” methodological approach in two representative case studies. In the field analysis phase, the potentials and opportunities offered by the built environment in promoting health were highlighted. The results obtained sup- port the development of an information tool and indicate how to benefit the neighbourhood and its associated healthy services. Through a systemic
vision, therefore, the research team identified the “health map” as a com- municative artifact capable of producing knowledge and awareness-raising impact on the area and citizens about the project’s themes. This contribution outlines the results of the “health maps”, i.e. two information tools aimed at citizens for orientation and healthy paths, places, and activities selection within the two reference case studies. The research objective is to optimize the data’s understanding, usability, and readability. The research activity aims at designing clear, readable, accessible, and usable data for a broad target audi- ence. Therefore, the research questions are: i) what are the appropriate map design components leading to an effective improvement in information com- prehension and reducing user response times during interaction; ii) what are the corresponding design principles applicable to map design; iii) what are the main tools for selecting and encoding information in the development of design outputs, iv) how does the use of colour impact on inclusive read- ability. In the ‘methodology’ section, the article describes the activities and the role design plays in an interdisciplinary research context, through the fol- lowing development phases: i) critical literature review; ii) evaluation of best practices; iii) preliminary prototyping of “health maps”; and iv) iteration of the prototyping phase. What emerges is the ability of the design discipline to enrich the user experience, reflecting a collaborative research experience between various disciplines of representation, communication design, and colour.
DESIGN PRINCIPLES AND THEORIES SUPPORTING THE HEALTHY MAPS DESIGN Maps can be defined as examples of systematic visualization of a complex system (Black et al., 2016). The information design discipline supports the readability of the communicative product, and structures, and organizes informational elements to guide the user in encoding the data (Bonsiepe, 1999). The integration of the cognitive and organizational competencies of information design, within the scope of inclusive map design, is consistent with accessibility goals, user-friendliness, and usability in this research. Dur- ing the critical reviewing process of the literature tools, the disciplines of wayfinding design and colour design theories and principles were related to the previously introduced disciplines. The critical literature review is, there- fore, divided into two macro-themes of interest: i) the principles underlying the development of a coordinated pedestrian wayfinding system; and ii) the principles of colour design and colour theories applicable to map design. This first phase of the process led the research team to relate the disciplines of information design and map design, producing the prerequisites for theoreti- cal verification, prototyping of communicative artifacts, and map validation. Then, the testing phase was organized as follows: an interdisciplinary work- shop and the use of online software, able to recreate visual impairments. The first macro-theme of interest was extensively explored by Tim Fend- ley in 2009 as part of a study on wayfinding, entitled ‘Legible London’, commissioned by the Central London Partnership. In the definition of the design solutions, carried out by the Applied Information Group, 9 principles
Design for Inclusion in Maps Design, for Optimizing Data Usability and Readability 111
were identified to support the design and planning of the information system concerning the city of London. The selection of usable routes, places, and activities for map design follows the principles of i) seamless travel, whereby information should be provided cohesively with and in correspondence to the main known local areas/points; ii) predictable; iii) inclusive; iv) human scale, whereby it is appropriate to identify and communicate the travel time of routes, making them perceptively walkable, and making strong connec- tions with local areas; v) naming of parts, to highlight key known places; vi) progressive information, i.e. connecting each point of interest to the next, integrating transport systems; vii) ‘don’t make me think’, i.e. creating an intu- itive system recognizable through symbols; viii) parsimony, i.e. providing a clear guide to roads; and ix) ‘help me to learn’ (Fendley, 2009). The fifth design principle of wayfinding systems emphasizes the importance of indi- cating the names of major places of interest or road junctions to improve reading and orientation within the built environment. Evaluation and font selection, therefore, appear to be strategic elements. Black et al. (2017) sug- gest a relatively simple and familiar alphanumeric script and the design of a colour background according to high contrast with the chosen font. The sev- enth design principle introduces the concept of encoding information through symbols. The interpretation of map data can be more effective, in terms of accuracy and speed of response, through the appropriate design, cod- ing, and categorization of icons and colour (Karrmann et al., 2018). The diversification of symbols through colour, the absence of similar visual and representational stimuli, and the simplification of figures (Koutsourelakis et al., 2010; Karrmann et al., 2018) may compete to optimize the reading of map information. Finally, the relation between the built environment and the visual representation of maps is another element that supports the recognis- ability of places. Fendley (2009) suggests increasing the attractiveness of place information by three-dimensionalizing the main places of interest. The first research question led to the identification of visual separations, i.e. design elements, reducing the amount of sequential processing and improving the understanding of information. These graphic components can support the intended image, information, and message if appropriately organized and numbered (Jaenichen, 2011). The elements allowing the map to be divided into layers of information are scale, colour, icons and symbols, tonal values, typography, textures, shapes, composition, lines and map orientation, fore- ground, and background (Black et al., 2017; Fendley, 2009; Jaenichen, 2011; Karrmann et al., 2018; Luna et al., 2017; Wang et al., 2022; Weninger, 2014). Concerning the second macro-theme of interest, Wang et al. (2022) state that colour is the main tool that attracts, directs attention to, and facilitates user interpretation of a map’s points of interest. Based on the principles of colour design and colour theories applicable to map design, the maps colour sys- tem should follow the below characteristics to improve the readability of information: colouring by path (Loyd et al., 2018), strong contrasts between neighbouring colours (Brychtova & Coltekin, 2016), colour harmony to improve visual comfort (Liu & Lin, 2009; Ou, 2016) and different shades with similar brightness values (Brewer, 1994). The application of colour to
transit or pedestrian route lines generally indicates single-variable data pat- terns. Brewer’s (1994) research shows that single-variable information can be visualized following four basic colour schemes: qualitative, binary, sequen- tial, and divergent. The design of colour palettes for maps can be supported by a variety of tools, such as CARTOcolors, Colorpicker for data, Data Colour Picker, Picular or Colour Palette Generator (Coalter, 2020). The most accurate colour selection tool is ColorBrewer2.0: Colour advice for cartogra- phy (2022), developed within The Pennsylvania State University by Cynthia Brewer and Mark Harrower, as it defines colour palettes through context, background, number of data, colour scheme and level of usability. The lat- ter point has been delved into three visualization options - colourblind safe, print-friendly, and photocopy safe. To support users with visual impairments, the research team investigated the method for adjusting colour hue, satura- tion, and brightness - H: ±5%, S: ±15%, and L: ±20% - Wang et al. (2022), which increases contrast and supports the differentiation of selected colours. During the colour validation phases, two online colourblindness simulation tools were selected: i) “Coloring for Colorblindness”, developed by Nichols (no date), for evaluating the identified colour system, and ii) the Vision simu- lation tool of the Impairment simulator software, developed by the University of Cambridge (Goodman-Deane et al., 2007; Inclusive design toolkit, no date) for validating the final “health map”.
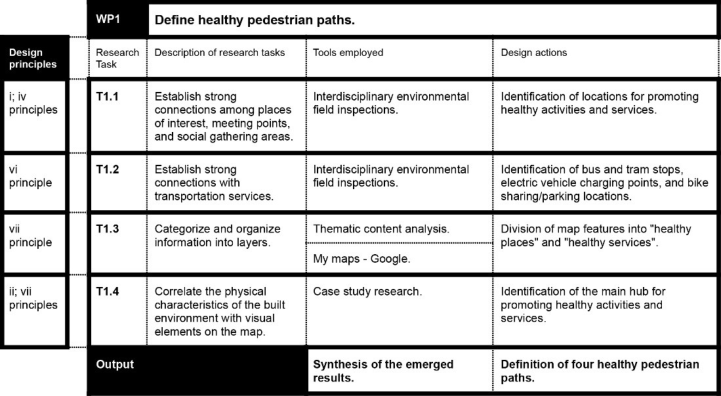
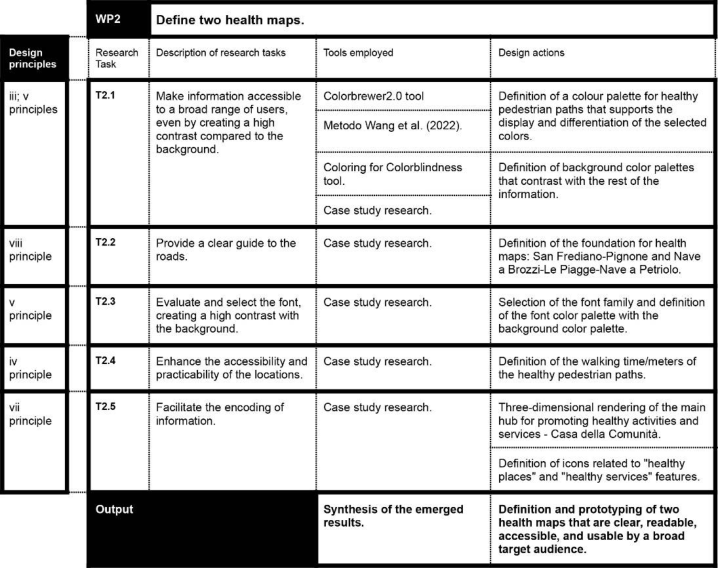
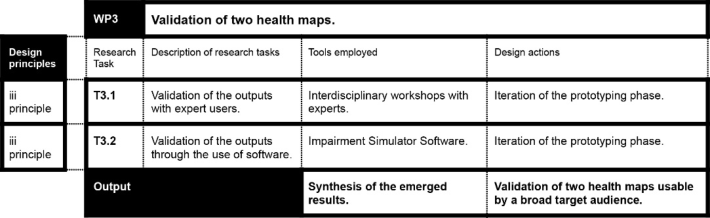
METHODOLOGICAL APPROACH The preceding section initiates a critical examination of principles, theories, and tools present in literature, classifying them concerning their applica- bility to “health map” design. The research strategy is “research through design” and aims to produce knowledge to guide information design prac- tice in defining “health maps”. The research design process is divided into 4 stages of development: i) the critical literature review, to define the prelimi- nary research tasks to be addressed to achieve the research objective; ii) the evaluation of best practices, to tackle the specified tasks; iii) the preliminary prototyping of the two healthy maps; and iv) the iteration of the prototyping phase. The research objective is to define two comprehensible, usable, and readable “health maps” as a tool for citizens to orientate and choose healthy routes, places, and activities within the neighbourhood. The research has been organized into 3 work packages (WPs), aligning with 3 specific research objectives, and encompassed a total of 11 research tasks (see Fig. 1, 2, 3). The critical literature review on the design principles for defining coordi- nated wayfinding pedestrian systems set the basis for identifying the research tasks, selecting tools and methods to be employed, and delineating the design actions to be undertaken. The methods applied are interdisciplinary envi- ronmental surveys (Hanington & Martin, 2019), thematic content analysis (Ayres, 2008), case study research (Yin, 2018), Colorbrewer2.0 tool, Wang et al. (2022) method, “Coloring for Colorblindness” tool, interdisciplinary workshops with experts and the Impairment simulator software. The WP1 involved a total of 14 field surveys within the two case studies. These were carried out by 9 expert researchers over 12 months - from June 2022 to
Design for Inclusion in Maps Design, for Optimizing Data Usability and Readability 113
May 2023. Each healthy neighbourhood place or service was categorized according to QSH conceptual framework (Setola et al., 2023). The data are represented and visualized through Google’s open-source support “My Maps”(Quartieri Sani HUB, 2024). The last research task involved case study research, whereby 4 inspiring best practices were selected for the identifi- cation of the main hub for healthy activities and services promotion. The WP2 involved the colour systems design through a process characterized by the orderly and iterative use of three tools: Colorbrewer2.0, the Wang et al. (2022) method, and “Coloring for Colorblindness”. The first research task concerned the selection of colour through the ‘ColorBrewer’ tool, the selec- tion of ‘print-friendly’ and ‘colourblind safe’ filters. The latter did not lead to the desired result, due to the amount of one-variable data identified. There- fore, an alternative method was applied to facilitate the readability of the colour system even for those suffering from colour blindness (deuteranopia, protanopia, and tritanopia). For each colour, hue, saturation, and brightness were recalibrated according to H: ±5%, S: ±15%, and L: ±20% (Wang et al., 2022). Finally, the third step consisted of colour validation using the online software ‘Coloring for Colorblindness’.
Figure 1: WP1. Description of research tasks, tools employed, and design actions that fulfill the first specific research objective.
Subsequent research activities involved case study research, for which 8 inspirational best practices were selected to i) define the background colour palette; ii) develop the map base; iii) evaluate and select the font; iv) define visual elements to support the attractiveness and walkability of places; and v) diversify information features to ease the reading. The WP3 included 2 interdisciplinary workshop sessions with 12 expert researchers, familiar with the research project and came from the fields of urban planning, architec- tural technology, design, and landscape architecture. These researchers also assumed the role of users within the project. Following this research activity,
it was planned to use the Impairment Simulator Software to simulate dif- ferent visual impairment conditions, such as macular degeneration, diabetic retinopathy, glaucoma, retinitis pigmentosa, colour blindness, and cataracts. The next three sections will introduce the outputs and intermediate results from the three WPs - described in Fig. 1, 2, 3.
Figure 2: WP3. Description of research tasks, tools employed, and design actions that fulfill the third specific research objective.Figure 3: WP2. Description of research tasks, tools employed, and design actions that fulfil the second specific research objective.
Design for Inclusion in Maps Design, for Optimizing Data Usability and Readability 115
RESULTS
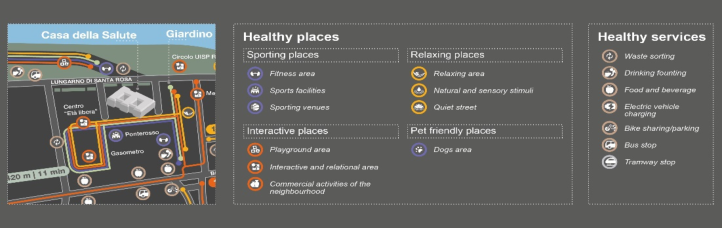
WP1 Results The WP1 set the basis for the visualisation and definition of four healthy pedestrian paths, concerning the opportunities the case studies offer in pro- ducing health. It addresses the first, the second, the fourth, the sixth, and the seventh principle for the development of a coordinated pedestrian wayfind- ing system. During the interdisciplinary environmental field survey, data were collected and evaluated on the urban environment, landscape, human activ- ities within the neighbourhood, personal and mobility services, the presence of associations and communities, as well as the presence of challenges and potentials. The development of the first three research activities led to the thematic categorization of the healthy map data into 2 layers of informa- tion, ordered according to the QSH conceptual framework (Setola et al., 2023). The first is ‘healthy places’, subdivided in turn into i) ‘sporting places’, which group fitness areas, sports facilities, and sports venues; ii) ‘interac- tive places’, which group playground areas, interactive and relational areas, and commercial activities of the neighbourhood; iii) ‘relaxing places’, which group relaxing areas, spaces characterised by the presence of natural and sen- sory stimuli, and quiet streets; and iv) ‘pet-friendly places’, which group dog areas. The second layer of information is ‘healthy services’, which includes: waste sorting, drinking fountains, places where food and drinks are sold or collected, electric vehicle charging points, points for bike sharing or bike parking, bus stops, tramway stops, and the railway station (see Fig. 6). The clustering of information allowed for clear visualisation of data. Based on the requirements of the first research tasks, the healthy pedestrian paths were defined for creating accessible and active connections between the “healthy places”, the “healthy services” of transport, and the main hub for promoting healthy activities and services. The integration of the health services presid- ium within the healthy pedestrian paths supports the recognisability of the places and greater legibility by the citizen, who more easily relates visual map elements with the physical characteristics of the built environment. The synthesis of the emerging results defined four healthy pedestrian paths: i) “active paths”; ii) “interactive and relational paths”; iii) “senses paths”; and iv) “parkland paths” (see Fig. 4).
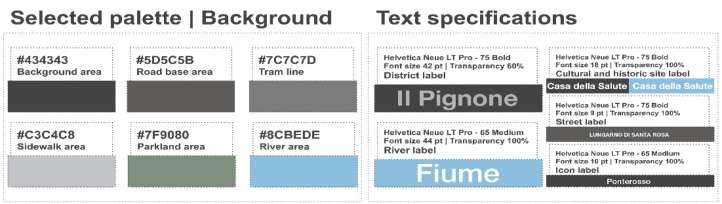
Figure 4: Healthy pedestrian paths colour system (left) and specific text indications for displaying travel times related to the paths (right).Figure 5: Background colour system (left) and specific text indications for reading (right).Figure 6: Three-dimensional rendering of the community house (left) and related icons.
WP2 Results The WP2 set the basis for defining and prototyping two “health maps” on the reference case studies of the QSH project. It addresses the third, fourth, fifth, seventh, and eighth principles for the development of a coordinated pedestrian wayfinding system. After defining strong connections between healthy places and services, the colour systems were defined (see Fig. 4). Based on the principles of colour design and colour theories applicable to map design (Brewer, 1994), two strongly contrasting (Brychtova & Coltekin, 2016), colour-harmonious (Liu & Lin, 2009; Ou, 2016), with different hues and similar brightness values (Brewer, 1994) colour palette were designed to improve the readability of the healthy route information of the “health maps”. The healthy pedestrian paths indicate data to a variable, presented through the qualitative colour scheme (Brewer, 1994; Lloyd et al., 2018). The final output includes the development of a palette consisting of 4 colours, one for each healthy pedestrian path. The research team adapted some informa- tion regarding meters and travel times for each path (see Fig. 4). The same process of defining paths’ colour palettes was applied to the development of the background colour system. The preparation of two-colour schemes was further compared using the “Coloring for Colorblindness” tool, assessing the readability and contrast of the set of 10 colours. After validating the inclu- sive readability of the combination of the two-colour palettes, a case study research was conducted, guiding 5 design actions. Firstly, map bases were defined, focusing on the geometrization of the roads, not as rigid as the rep- resentation of mass transportation systems, and the elimination of scale detail to make the paths clear and visible (see Fig. 6). The second, third, and fourth
Design for Inclusion in Maps Design, for Optimizing Data Usability and Readability 117
design actions were supported by the case study research and included, in order: the selection of the font family (see Fig. 4, 5); the three-dimensional rendering of the Community House (see Fig. 6); and the development of sym- bols differentiating from each other through colour, identifying to which map features they are related (see Fig. 6).
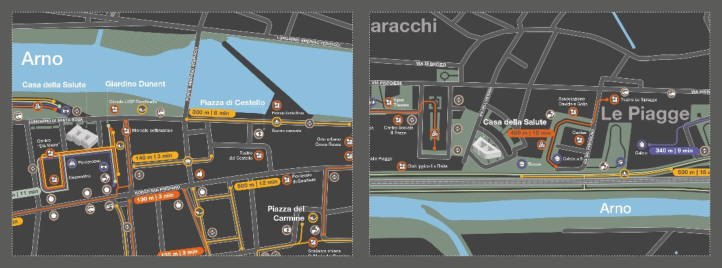
WP3 Results The WP3 led to the iteration and inclusive validation of the two “health maps”. It addresses the third principle for the development of a coordi- nated pedestrian wayfinding system. The encoding of information into layers, colour, and icon design were iterated during the last two research activities. The result of the laboratory activities led to an important iterative phase con- cerning the differentiation and increase of contrast between the two green colours in the maps; the elimination of green colour on non-accessible green- ery areas to make visualisation more effective and speed up response times, especially in the heart of the map, where the most information converges; the scale reduction of one of the two maps to include both riverbanks of the Arno River and improve the recognisability of the map visual elements; and the new layout of the legends.
Further evaluation of the work, through Impairment Simulator Software, led to the implementation of the two “health maps” (Fig. 7) and the planning of future research activities concerning the validation of the outputs with the citizens of the case-study neighbourhood.
Figure 7: Detailed framing of the two “health maps”.
CONCLUSION
The research presented here has the ambition to increase knowledge and guide the development of design practice for inclusive maps. With a “research through design” approach, the research process has experimented with new directions of investigation for the design of inclusive “health maps”, i.e. maps that promote orientation, connection, and use of services, and poles for promoting healthy neighbourhood activities and the main places of interest in the relevant built environment.
The set of results obtained lays the basis for informing the “research for design” strategy and providing new knowledge for information design prac- tice, through i) the definition of the process and specific research activities to be carried out for the design of inclusive “health maps” for citizens; ii) the identification and categorization of project actions, whose outputs constitute the set of visual elements of the information product; iii) a good practice to understand how to use the conceptual framework of the QSH project, to define health maps for future healthy neighbourhoods; iv) the identification of a set of inspiring best practices capable to foster the designer’s creative process; v) a good practice of categorizing and creating connections between services and healthy activities in the neighbourhood; vi) defining a process and steps for developing inclusive colour schemes for maps, involving the orderly and iterative use of Colorbrewer2. 0, Wang et al. (2022) and the “Coloring for Colorblindness” tools; vi) the validation and evaluation pro- cess aimed at visual inclusiveness goals, which involves the integrated use of interdisciplinary workshops and Impairment Simulation Software.
The results therefore provide significant contributions to the information design practice, but some limitations are recognized that may influence the interpretation of the results. The QSH research group, therefore, is creat- ing the conditions for further and forthcoming activities to validate the two “health maps” through focus groups and usability tests with end users, i.e. citizens of the two case studies.
ACKNOWLEDGMENT
The authors would like to acknowledge the QSH research team. The article is the result of the joint work of the authors, as follows: Viviani S. Design principles and theories supporting the healthy maps design, Methodological approach and Results; Brischetto A. Results (WP2; WP3); Busciantella-Ricci D. Results (WP1); Rinaldi A. Research project coordination, Introduction, and Conclusions.
REFERENCES
Ayres, L. (2008). Thematic Coding and Analysis. In: L. M. Given (Eds.), The Sage encyclopedia of qualitative research methods, pp. 867–868. SAGE Publications. Black, A., and Walker, S. (2016) Introduction: Effective Information Design, in
Lloyd, P. and Bohemia, E. (eds.), Future Focussed Thinking - DRS International Conference 20217, 27 - 30 June, Brighton, United Kingdom. Black, A., Luna, P., Lund, O., & Walker, S. (Eds.). (2017). Information design: Research and practice. Taylor & Francis. Bonsiepe, G. (1999). Interface: An approach to design. Maastricht: Jan van Eyck
Academie. Brewer, C. A. (1994). In Visualization in Modem Cartography. A. M. MacEachren & D. R. F. Taylor (Ed.), Color Use Guidelines for Mapping and Visualization (123–47). Elsevier. Brychtova, A. & Coltekin, A. (2016). An Empirical User Study for Measuring the
Influence of Color Distance and Font Size in Map Reading Using Eye Tracking. The Cartographic Journal, 53(3), 202–212.
Design for Inclusion in Maps Design, for Optimizing Data Usability and Readability 119
Coalter, J. (2020). ColorBrewer 2.0 and the Rainbow: Using Color Tools to Choose Appropriate Color Schema for your Data Visualization. Issues in Science and Technology Librarianship, (94). ColorBrewer: Color advice for maps (2022). https://colorbrewer2.org/. Fendley, T. (2009). Making sense of the city: A collection of design principles for
urban wayfinding. Information Design Journal, 17(2), 91–108. Goodman-Deane, J., Langdon, P. M., Clarkson, P. J., Caldwell, N. H. M. and Sarhan, A. M. (2007) Equipping Designers by Simulating the Effects of Visual and Hearing Impairments. In Assets 2007. Tempe, 14–17 Oct 2007. ACM Press, pp. 241–242. Hanington, B., & Martin, B. (2019). Universal methods of design expanded and
revised: 125 Ways to research complex problems, develop innovative ideas, and design effective solutions. Rockport publishers. Jaenichen, C. (2011). Design for evacuation: improving city evacuation instructions.
Parsons Journal for Information Mapping, 3(2), 1–16. Karrmann, S., & Shears, C. (2018). Optimal Visual Search Elements in Small Scale Map Design. In Advances in Usability and User Experience: Proceedings of the AHFE 2017 International Conference on Usability and User Experience, July 17–21, 2017, The Westin Bonaventure Hotel, Los Angeles, California, USA 8 (pp. 417–424). Springer International Publishing. Koutsourelakis, C., & Chorianopoulos, K. (2010). Icons in mobile phones: Com-
prehensibility differences between older and younger users. Information Design Journal, 18(1), 22–35. Liu, X. & Lin, Y. (2009). The vivid color in the metro station figures identity of city.
Computer-Aided Industrial Design Conceptual Design, 1682–1685. Lloyd, P. B., Rodgers, P., & Roberts, M. J. (2018). Metro map color-coding: Effect on usability in route tracing. Diagrammatic Representation and Inference, 411–428. Luna, P., & Black, A. (2017). Choosing type for information design. In Information
Design: Research and Practice (pp. 479–486). Routledge. Nichols, D. (no date) Coloring for colorblindness. Available at https://davidmathlog ic.com/colorblind. Ou, L. (2016). A Comparison Between Color Preference and Color Harmony.
DRS2016. Quartieri Sani HUB (2024). Mappe tematiche [Online]. Available at https://sites.go ogle.com/unifi.it/quartierisanihub/mappe-tematiche. Inclusive design toolkit (no date). Impairment simulator software. University of Cam-
bridge. https://www.inclusivedesigntoolkit.com/simsoftware/simsoftware.html Setola, N., Rinaldi, A., Macchi, A., & Busciantella Ricci, D. (2023). Quartieri sani e inclusivi a Firenze: un nuovo approccio scientifico agli spazi pubblici urbani. Healthy and Inclusive Neighbourhoods in Florence: a New Research Approach for Public Urban Spaces. In Species of Spaces: Fostering psycho-physical well-being by design (pp. 225–231). Anteferma Edizioni. Wang, Z, Cheung, V and Lonsdale, M. (2022). Effective colors for information
design: A color-coding study of China’s high-speed railway map. Information Design Journal, 27(2). Weninger, B. (2014). A framework for color design of digital maps: An example of noise maps. In Modern Trends in Cartography: Selected Papers of CARTOCON 2014 (pp. 103–116). Cham: Springer International Publishing. Yin, R. K. (2018). Case Study Research and Applications: Design and Methods.
SixthEdition. SAGE Publications.
LISTED IN THE AHFE DIGITAL BOOKSTORE CATALOGUE
Explore the complete digital volume
Design for Inclusion
Read this individual research paper free through the original publisher, or explore the full digital proceedings book.
ISBN 978-1-964867-04-5
Explore this ISBN in the AHFE Bookstore ↗Listed in the July 2026 bookstore catalogue; search by ISBN to confirm current availability · Digital book purchase optional