Pei Tsen Lai, Ching I Chen, Meng-Cong Zheng (2023). The influence of hiking trail map representation on route selection. In: Human Factors in Communication of Design. AHFE Open Access, vol. 90, pp. 42–51. https://doi.org/10.54941/ahfe1003694
In the past two years, more people in Taiwan have been engaging in hiking activities because of the epidemic restriction on leaving the country. However, the number of accidents has risen, mostly among inexperienced hikers. Because they are unfamiliar with the mountain terrain, they tend to make wrong route decisions. So this study examines hikers' interpretation of hiking trail guide maps and the risk perception of route information in them. This study evaluated the user's thoughts and feelings, information interpretation, and risk perception of existing hiking trail map information. The experiment was conducted online by 30 participants, half males, and half females, and half were of high and low hiking experience. The evaluation was performed as follows: 1) A pre-test questionnaire was administered to investigate the attentional ranking of information on the hiking trail map. 2) Participants were asked to complete three situational tasks on the map and fill out a 9-point Likert scale of risk perception, performance satisfaction, and a NASA-TLX scale. 3) Each participant was asked to complete three maps, and the maps were randomly assigned to respond. 4) A semi-structured interview was conducted, and the top three most helpful information on route perception of risk was ranked. Combining the results of the three maps, both high and low-experienced participants felt that direct text road signs (e.g., danger, cliff) gave the best sense of route risk. The second place was the slope map. Participants indicated that the slope map provides an intuitive view of the route, especially in emergencies, and that the ups and downs of the route are essential points to consider in their route selection decisions. In the Yangmingshan National Park map task, most people revised their route decisions. Low-experienced hikers felt that there needed to be more information on a slope to compare routes, making it more challenging to make decisions. Highly experienced people can identify the terrain directly through the contour map. However, the map had much textual information, and the contour lines were too dense, which made it difficult to interpret the terrain of some routes. In the question of risk perception, we found that most of the perception scores given by with high experience people were higher than those offered by less experienced people. That means that more experienced people pay more attention to the risks presented by each piece of information and increase their sensitivity to crises. Finally, the overall evaluation showed that road signs and slope maps were essential information for risk perception. This study will optimize and improve both information items to help hikers perceive route patterns more accurately and improve their risk perception.
Hiking has recently been one of the fastest-growing outdoor activities (Monasterio and Alamri et al., 2014). Mountain hiking has evolved into a sports tourist sector encouraged by governments worldwide. Taiwan has a unique physical environment, with mountains covering two-thirds of the island’s territory and 268 mountains rising above 3,000 meters, providing a plethora of mountain and forest resources and hundreds of mountains to explore. Hiking is the third most popular sport in 2020 national sports sta- tistics, behind walking and jogging, according to the Ministry of Education’s Department of Sports, with around 5 million individuals selecting hiking activities.
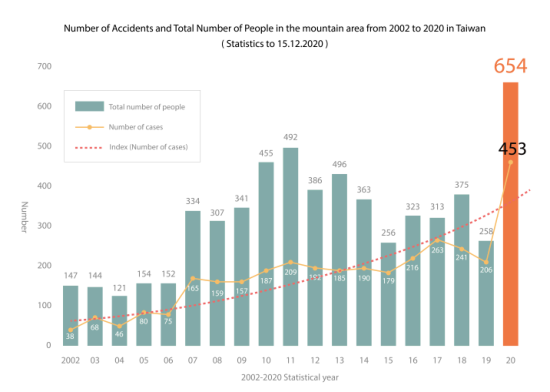
Because the Executive Yuan announced the 2020 open policy on moun- tains in October and the impact of the Covid-19 pandemic, which prohibited them from traveling overseas, an increasing number of Taiwanese people have turned to mountain activities in recent years. While these mountain activities benefit both physical and mental health, they also carry a risk of harm (Kortenkamp and Moore et al., 2017). Mountaineering’s growing popularity has also resulted in a rise in the frequency of mountain acci- dents. According to the mountain rescue incident statistics from the National Fire Agency, many incidents in the mountains are twice as high as before. From an average of about 200 incidents per year increased to more than 500 in 2020. Among them, the accident rate is higher for solo hikers and
The Influence of Hiking Trail Map Representation on Route Selection 43
Figure 1: Number of accidents and total number of people from 2002 to 2020 in Taiwan (adapted from National Fire Agency, 2022).
self-organized teams (see Figure 1). The Fire Department analyses that many accidents occur because of human factors. Many new hikers are inexperi- enced in mountaineering and are not good at searching for information in advance and hiking with a negligent attitude (Ke, 2020), resulting in repeated accidents.
Some experts point out that hikers could avoid accidents if they had a greater knowledge of the risks involved in hiking and a better understan- ding of the dangers associated with maintaining (Chamarro and Rovira et al., 2019). Mountain area managers must acknowledge the significa- nce of hiking hazards, think more about letting hikers get the best hiking experience in a safe condition, and evaluate the dangers posed by hiking routes as the number of climbers continues to increase year after year (She and Tian et al., 2019). In essence, the government has positioned a hiking trail map at each hiking entrance to assist tourists in comprehending the circumstances of the trail. It also provides individuals with hiking time to plan their routes. At the moment, Taiwan’s guidance maps are displayed in various ways, ranging from the basic map of the mountain area to the display of routes to the organization of patterns and textual information. This variety of presentation methods is because Taiwan’s hiking trail maps are still being developed. The present investigation into the risk informa- tion that helps people evaluate routes has yet to see much research done. Many maps on the market are not user-centered, which increases the pos- sibility that people would misunderstand route information. Scholars have observed that despite the rise in the popularity of various maps, young people’s ability to read maps has not improved and that only individuals with a background in mapping or geography have good map-reading skills (Ooms and De Maeyer et al., 2016).
Consequently, this study evaluated the users’ information interpreta- tion and risk perception of existing hiking trail map information. Using scales and semi-structured interviews, we could know which information plays a role in the route decisions made by users. In the future, can we develop and improve this information and help hikers to be able to analyze route patterns with more precision and have a better overall risk perception?
METHODS
Initially, we searched Google Chrome for 30 maps using the terms “Taiwan Mountain Guide Map,” “Hiking Trail Map,” and “Mountain Guide Map.” Ten maps with significant variations were chosen to collect the most data points, and 30 items with high repetition rates were compiled (see Table 1). The three hiking researchers rated the information that may aid in risk perce- ption and listed the seven risk perception information elements mentioned below: slope information, time, distance, route condition, route form, main and branch routes, and trail grade. The first three maps with more risk perce- ption information were changed gray to lessen the visual interference problem and utilized as example maps for the test sample (see Table 2).
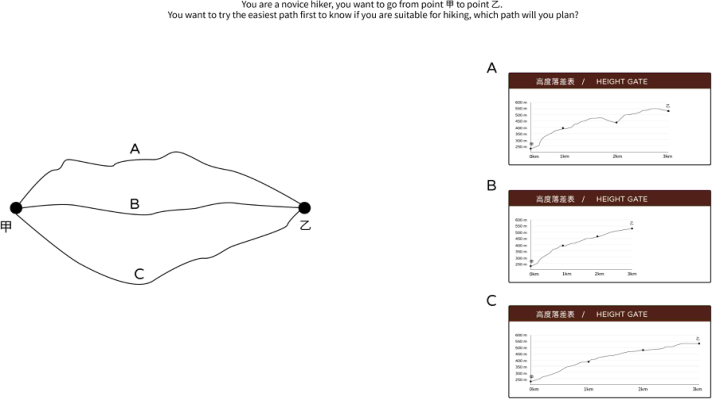
A total of 30 participants, 15 males, and 15 females, aged 20–50 years old, were recruited for the experiment. Based on their frequency of hiking (often, occasionally, sometimes, seldom, never), overnight hiking experience (more than three times, 1–2 times, never), and experience as a hiking club official, the participants were split into the high experience (15) and low experie- nce (15) groups. The experimental procedure was placed online. Initially, a pre-test questionnaire was distributed to the top six individuals in terms of attention to the information on the navigation map (30 items of hiking infor- mation). Then, two questions on route selection (see Figure 2) were utilized to determine the influence of slope on risk selection. Following this are the same three situational tasks for each map. They are: 1) You are standing in
Table 1. 30-item hiking trail map information.
Table available in the original PDF paper.
11. Hiking trail entrance 21. Sheltered Mountain House
22. Public facilities (toilets, pavilions, parking lots, schools, etc.) 3. Current location 13. Electric towers 23. Tourist service center 4. Slope information 14. Observation points 24. Management station 5. Distance (km) 15. Roads (provincial roads, driveways, etc.)
6. Time 16. Scale 26. Suspension bridge 7. Grade of the trail 17. Compass 27. Rock hiking area 8. Trail name 18. Stream 28. Heat consumption 9. Contour line 19. Observation platform 29. Toll station 10. Triangle point 20. Resting place 30. Public transportation (Bus, MRT, etc.)
The Influence of Hiking Trail Map Representation on Route Selection 45
Table 2. Hiking trail map test sample.
Table available in the original PDF paper.
Original Experimental sample A
B
C
front of a hiking trail entrance and wish to plan a challenging path you can accomplish in two hours. (Each map’s time setting is unique.) 2) Currently, you are at point B. You have a sudden knee ache and want to find a route with minimal danger of descent. 3) You are halfway up the mountain when it begins to pour rain. After responding to the questions, the participants were given three more tasks: a NASA-TLX scale, a nine-point Likert scale to rate
Figure 2: The graph used in the route choice task.
the level of satisfaction with the form, and seven risk perception information items. Every participant was responsible for finishing three different maps, which were handed out randomly based on the information they provided. During the final semi-structured interview, participants were asked to choose the three pieces of information on route risk perception that they found to be the most helpful.
MOUNTAINEERING KNOWLEDGE In the pre-test questionnaire, participants were asked to identify the six most prominent features of the hiking trail map. Except for the six participants who indicated that they did not utilize the hiking trail map, the informa- tion scores of the other twenty-four participants were added together. The analysis revealed that the present position received the highest overall score (106 points), followed by the main and branch routes (106 points), hiking distance (75 points), hiking time (47 points), hiking trail entrance (43 points), and public facilities (29 points). The top six pieces of information were the same for experienced and inexperienced hikers, with a tiny shift in ranking. That shows that regardless of hiking experience, individuals focus on the same information when seeing a hiking trail map.
THE INFLUENCE OF THE SLOPE MAP ON THE PARTICIPANTS’ CHOICE OF ROUTE In the case of a route, only 96% of participants preferred Route B. The sele- ction was selected because the path appeared to be the smoothest, shortest, straightest, and easiest to follow. Only 18% of participants chose the same B with elevation profile, citing the capacity to withstand steep slopes and with- draw rapidly in an emergency. Route A was selected by 13% of participants because they believed there would be a downhill part to relax on and that they would be energized throughout the hike. Finally, Route C was chosen
The Influence of Hiking Trail Map Representation on Route Selection 47
by 66% of the participants. They said that a gradual uphill rise would not sap their physical energy too rapidly and that the whole walking experience would be easier and less likely to result in injuries.
THE RESULTS OF THE NASA-TLX SCALE In this study’s three maps, each subject performed the task randomly. The results (see Table 3) showed that the high to low cognitive load was C (M = 61.94, SD = 16.44) for the high-experience group for C mean load of 62.50 and for the low-experience group for C mean load of 61.39; in B (M = 59.86, SD = 15.40) for the high experience group for B mean load 62.33 and for the low experience group for B mean load 57.39; in A (M = 40.63, SD = 16.35) for the high experience group for A mean load 37.00 and the low experience group for A mean load 40.63, SD = 16.35. One-way MANOVA analyzed the results. It showed that the overall load of A was significantly different from that of B (p = .000 <.001) and C (p = .000 <.001). On the simple A map, we find that the high-experience group is less burdened with reading comprehension than the low-experience group. However, when there were more route options on the map, the high- experience group had more significant stress in reading the map, and the high-experience group scored higher in the B and C load scores than the low-experience group.
Table 3. NASA-TLX scores of maps A, B, and C between high and low-experience groups.
Table available in the original PDF paper.
A B C Experience level M SD M SD M SD High 37.00 14.01 62.33 18.34 62.50 16.17 Low 44.28 18.15 57.39 11.92 61.39 17.27
In addition, A and B maps are significant differences in terms of Mental demand, Physical demand, Temporal demand, Effort, and Frustration; A and C are also significantly different. There is also a significant difference betw- een A and C in terms of performance satisfaction. That shows out of the three maps, map C resulted in the most outstanding amount of doubt and discontent in the decision of the trial (see Table 4).
Table 4. NASA-TLX scores of maps A, B, and C.
Table available in the original PDF paper.
A B C p-value p-value M SD M SD M SD A to B A to C
INFORMATION TO HELP PERCEIVE RISK After completing the three scenario questions, including challenging routes, knee injuries, and heavy rain, participants completed a nine-point Likert scale with seven perceived risk information elements. The A map had the highest average score of 7.57 for route condition and distance. Participants reported that the textual information highlighting the risk enabled them to avoid risky routes in poor physical and climatic circumstances instincti- vely. The second-highest result, 7.23, for distance and time assisted them in determining a rapid route down the mountain. Due to their fear of re- injury, some individuals stated that choosing the route’s incline and whether or not it was uphill was crucial for them, particularly in the case of knee soreness. The time information in the C chart received a score of 6.9; as the number of route alternatives increased, time became an obvious way to decide the quickest path down the mountain, followed by a comparison of other data to establish the best route. In addition, 76% of the infor- mation scores of the high experience group gave higher scores than the low experience group on perceived risk information, and 66% of the high experience group scored higher than the low experience group on the infor- mation standard deviation of individual maps. It may suggest that, in terms of route interpretation, those with more excellent experience are more sen- sitive to information, are aware of which information is helpful for risk perception, and refrain from using an effort to read less useful information (see Table 5).
Table 5. Hiking information on each map in the 9-point Likert score.
Table available in the original PDF paper.
Grade SD Group Slope Distance Time Road conditions Form Main / Branch Line
A High 7.1 7.4 7.6 7.9 5.5 5.1 N/A 1.3 Low 6.3 6.7 6.5 7.4 N/A 4.9 N/A 0.9 B High 7.5 6.0 5.8 4.6 4.5 4.9 N/A 1.15 Low 7.1 6.5 6.4 5.3 3.6 5.2 N/A 1.25 C High 6.2 7.3 7.5 N/A 4.9 5.5 N/A 1.1 Low 6.1 6.1 6.3 N/A 4.4 5.0 N/A 0.8 Note: Sample size N = 30; the groups are divided into high and low hiking experience, the number in each cell is the mean score, and SD is the standard deviation. N/A indicates that less than half of the participants did not feel this information and were not included in the calculation.
INFORMATION THAT BEST PERCEIVES THE RISK After completing the nine different situational tasks across the three maps, the participants evaluated the most beneficial information to their assessment of danger from most helpful to least helpful. According to the findings as a whole, the condition of the trail came in the first place (with a score of 61), followed by the trail’s elevation profile (with a score of 49), and then the trail duration and distance made up the following three or four places. The participants reported that the text and color information of the trail condition
The Influence of Hiking Trail Map Representation on Route Selection 49
could rapidly and directly sense the amount of danger without thinking. That is true regardless of the level of experience the participants had. For instance, if there were a danger or no-entry sign among trails, the participants with low levels of expertise would unquestionably modify their trail selection. In the A map task, four of them did not plan any routes that were marked hazardous. According to the gradient map, those with less experience (27) provided higher scores than those with more experience (22). People left more comments regarding the nature of the slope in case of injury on the maps with more hiking trails (B and C). These maps include more hiking trails. They used phrases such as “gentle,”“downhill,”and “void steep slopes”to describe the paths that they wished to walk. For example, “gentle,” “downhill,” and “sharp void slopes.”
DISCUSSION
No participants identified the top two items of crisis information: route con- dition and slope, out of the six pieces of hiking information that individuals decided to pay attention to in the pre-test questionnaire. That implies that when individuals look at the hiking trail map, they are less conscious of the situation and are less inclined to consider dangerous mountain conditions. They only looked attentively at the mountain map after an event to see if any information could assist them in avoiding an accident.
Participants mentioned that the elevation profile lacks a route name in the nine-point Likert scale, satisfaction rating, and semi-structured interview regarding route condition and slope information. The factor makes it diffi- cult to compare with the main route map and discourages them from using this information; only the altitude map with a north saddle line (北鞍) is depicted on the A map. Due to the absence of knowledge of the south saddle route (南鞍), the two experienced participants chose only the road with an elevation profile. On the B map, where the information is more complicated, 33% of less-experienced users changed their route selection. The cause for this was that the slope information provided too few routes and the profile forms were too similar to prevent route confusion. This results in a decreased propensity to utilize contour information and its misunderstanding. Alth- ough the textual information regarding risks is a warning in terms of road conditions, it is misleading to designate dangers on the whole road on the A-map. During the trial, three participants questioned whether the signs indi- cated hazardous terrain or caution to tread cautiously. A no-entry sign on the B map appears on the main road, yet there is a no-entry zone designa- ted on the segmented route, causing many to question if the information is accurate.
People find it difficult to compare information on the hiking trail map. Whether the route was a simple map, four people needed help comparing the slope, time, distance, and main route. The B map provided too many sections of the slope map. There were overlapping routes stacked on the main map, making it confusing and annoying for the participants to correspond to the information on different sections of the route. In contrast, the C map provided some sites in the Distance & Time Map of Vicinal Recreation Sites
that did not match the information in the main map, and the participants directly looked at the form of the main map sections, such as line length and twist, to decide the route. The capacity for users to use the information more intuitively and decrease the number of comparisons is critical for making the more accurate decision.
In semi-structured interviews, 80% of participants agreed that the inability to read a map increases a person’s risk exposure. Conversely, it gives people a sense of the unknown, danger, and uncertainty. On Map C, where there are several routes and a great deal of information, some participants feared that they would be more likely to ignore the information and misinterpret the routes. According to others, the C map resembles a professional hiking map and feels like experienced hikers can only use it; it is not suited for the general public. The Yangmingshan National Park Trail is a significant tourist destination with approximately one million annual tourists. It is essential to lessen the complexity of information and enhance the comprehension of vital data.
CONCLUSION
Hikers with more experience are better equipped to assess routes accurately in a variety of different hiking scenarios than hikers with less expertise. They know the routes they can carry and information on the importance given to particular situations. They can provide specific explanations regarding the reasons behind their decisions. However, because those with more experience desired to make better judgments, they were also saddled with the heavier responsibility of reviewing if there was either lacking or illegible information on the maps. The most beneficial information when making route judgments is slope information and route conditions. In particular, for those with less expertise, such individuals want more intuitive information to comprehend what the path looks like quickly. It makes individuals less likely to utilize it. It increases the likelihood that they will make an error in judgment when the information is complicated and needs back-and-forth comparisons between different pieces of information.
Hikers need to understand the slope well, which is why this information is frequently included in contour and elevation profile maps. On the other hand, professional hikers are the ones who typically look at contour maps. The slope and undulations of the elevation profile both contribute to the con- dition of the road and provide more direct visual information. The user will get a clearer and more precise image of the path. In future designs, we can make an effort to target the following: 1) To cut down on the total number of comparisons, combine the slope map with other information (such as time and distance); 2) Integrating the information on the slope into the primary route of the map will allow users to comprehend the path that corresponds to the slope more readily; 3) Altering the color and shape of the route itself to provide information about slow, steep, and significant height variations, hence making the information more easily understood. People can imme- diately detect the amount of danger posed by various paths and select the
The Influence of Hiking Trail Map Representation on Route Selection 51
way that best suits them, which helps reduce the number of accidents in the mountains.
REFERENCES
Chamarro, A., Rovira, T., Edo, S., & Fernandez-Castro, J. J. L. S. (2019). Risk judgments in climbers: The role of difficulty, meteorological conditions, confidence, and appropriate tools. 41(3), 221–235. Disaster Rescue Team. (December 16, 2020) 110 years, 91–108 years, Mountain
Area Accident Rescue Statistics. Fire Department, Ministry of the Interior, R. O. C. Website: https://www.nytimes.com/2008/06/25/us/25engineer.html. Ke, Zheng-Xiang. (2020). A brief talk on mountaineering safety—establishing a correct mountaineering mentality and tool application. Taiwan Mountain Conference 2020. Kortenkamp, K. V., Moore, C. F., Sheridan, D. P., Ahrens, E. S. J. J. o. o. r., & tourism.
(2017). No hiking beyond this point! Hiking risk prevention recommendations in peer-reviewed literature. 20, 67–76. Monasterio, E., Alamri, Y. A., Mei-Dan, O. J. W., & Medicine, E. (2014). Personality characteristics in a population of mountain climbers. 25(2), 214–219. National Park Group. (September 28, 2020) Current Status and Prospects for the
Promotion of Mountain Forest Opening Policy. Department of Construction, Ministry of the Interior, R. O. C. Website: https://www.nytimes.com/2008/06/25/ us/25engineer.html. Ooms, K., De Maeyer, P., Dupont, L., Van der Veken, N., Van de Weghe, N., Verplaetse, S. J. C., & Science, G. I. (2016). Education in cartography: what is the status of young people’s map-reading skills?, 43(2), 134–153. She, S., Tian, Y., Lu, L., Eimontaite, I., Xie, T., Sun, Y. J. I. j. o. e. r., & health,
p. (2019). An exploration of hiking risk perception: dimensions and antecedent factors. 16(11), 1986.
LISTED IN THE AHFE DIGITAL BOOKSTORE CATALOGUE
Explore the complete digital volume
Human Factors in Communication of Design
Read this individual research paper free through the original publisher, or explore the full digital proceedings book.
ISBN 978-1-958651-66-7
Explore this ISBN in the AHFE Bookstore ↗Listed in the July 2026 bookstore catalogue; search by ISBN to confirm current availability · Digital book purchase optional