Ting Chun Liao, Ching I Chen, Meng-Cong Zheng (2023). Exploring the Design of Campus Directional Sign through Wayfinding Behavior in Virtual Environment. In: Usability and User Experience. AHFE Open Access, vol. 110, pp. 501–509. https://doi.org/10.54941/ahfe1003225
National Taipei University of Technology (NTUT) is in the center of Taipei City, with three significant entrances and more than 20 buildings. Because of the nearby attractions, such as the Huashan 1914 Creative Park and Jianguo Brewery, and the Red House, a city-designated historical monument on the campus. Visitors are often attracted to the campus. However, the crowded and enclosed building layout makes it difficult for first-year students, foreign guests, and tourists who are unfamiliar with the environment to navigate around the campus.In this study, the campus of NTUT was used as the experimental environment, and the modeling software was used to build the scene model. An interactive interface was created in Unity 3D to allow participants to move around the virtual campus from a first-person perspective to simulate wayfinding. A total of 30 participants conducted the online experiment, using the three entrances of the campus as the starting points to divide into three groups of scenarios. Each set of scenarios contained four tasks, and participants were divided into three groups of 10 to operate two scenarios, each with a total of eight tasks. The evaluation method is as follows: 1) Let participants perform wayfinding tasks, and the researcher observes and records their behavior and thinking aloud during the tasks. 2) After the tasks, a five-point Likert scale questionnaire was used to understand participants’ anxiety levels and evaluate the directional signs. 3) Semi-structured interviews were conducted at the end of all tasks to determine the reasons behind the behavior.The results show that the participants did not quickly enter the trail at the beginning of the experiment unless the directional sign gave clear guidance. They mostly searched for directions on the main wider paths, and we found that participants would expect the directional signs to be consistent. If they did not find the previous target information on the next directional sign, they would go back and forth to confirm the correctness of the information, or they would stop and look around, thinking they had reached their destination. On the other hand, once the participant starts looking at one form of directional sign design, they subconsciously look for the same design, such as the same color or shape. It caused participants easy to ignore the other design form of directional sign. In addition, the arrows of the directional signs should be more unambiguous. For example, when participants found out that the arrow is pointing to the back of the building, they are likely to pause and hesitate. A diagonal arrow can also lead to misunderstanding. When participants became disoriented in finding the exit, they used the strategy of walking around the campus wall to find the exit. The results of this study intend to help understand wayfinding behavior on campus and serve as a reference for the subsequent design of directional signs.
Environmental factors are critical to effective wayfinding (Farr et al., 2012). University campuses, with their intricate layouts, lack of clear environmental cues along walking paths, and visually complex surroundings pose challen- ges for wayfinding (Iftikhar et al., 2021). Inadequate access to wayfinding information might lead to disorientation, stress, frustration, and wasted time (Abu-Ghazzeh, 1996). Directional decisions rely mostly on directional signs, which greatly influence wayfinding (Tzeng and Huang, 2009). However, appropriate placement of signs can help alleviate difficulties, confusion, and anxiety associated with wayfinding (Seidel, 1982).
National Taipei University of Technology (NTUT) is in the center of Taipei City and features three main entrances and more than 20 buildings within its
campus. The divided layout of the buildings creates a complex network of paths, making it difficult for first-year students, guests, and tourists to find their way around the campus. Additionally, the nearby attractions, such as the Huashan 1914 Creative Park and Jianguo Brewery, and the Red House, a designated city monument, often attract visitors to the campus. Therefore, it is crucial to improve the wayfinding on campus.
Building a virtual environment presents a feasible approach for wayfinding research since it allows for controlled manipulation of experimental factors that are challenging to regulate in a physical campus setting. Numerous stu- dies have compared the differences in wayfinding between the real world and virtual environment wayfinding, as well as different virtual reality devices. It was shown that people’s strategies for finding their way in the real world and virtual environment are similar (Conroy, 2001). Both desktop and immersive displays have proven equally effective for spatial learning in virtual environ- ments, indicating the viability of both experimental approaches (Zhao et al., 2020). The virtual environment enables the evaluation of wayfinding signage without complex changes and installations.
METHODS
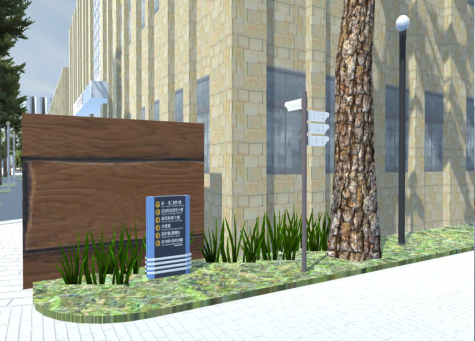
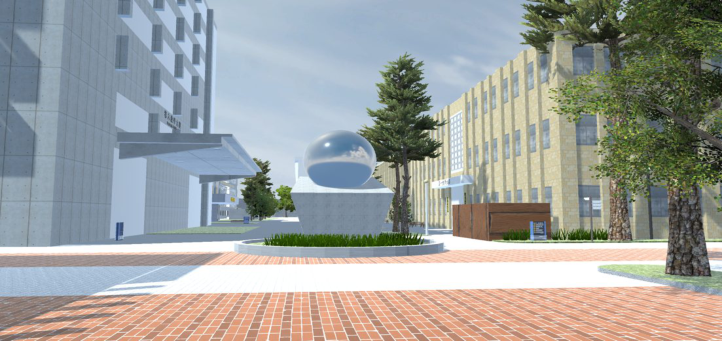
This study uses the campus of NTUT as the experimental environment. The virtual campus model, comprising both permanent and temporary directional signs, was developed using the 3D computer graphics software Blender. The permanent signs consisted of two types: totem and finger-post (see Figure 1). Then, the scene model was imported into Unity 3D to create an interactive interface, allowing participants to move in the virtual campus displayed on the desktop screen from a first-person perspective by the mouse and keyboard (see Figure 2) to simulate wayfinding.
A total of 30 participants, ranging in age from 20 to 49 years old, with no previous experience on the NTUT campus, participated in the experi- ment. The experiment included three phases. Participants filled out basic
Figure 1: Permanent directional signs (left) and temporary directional signs (right) on campus.
Exploring the Design of Campus Directional Sign Through Wayfinding Behavior 503
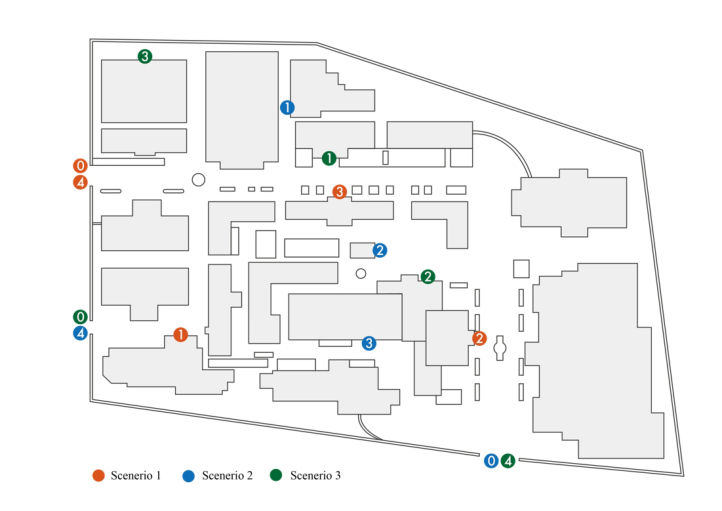
Figure 2: The experimental scene viewed by the participants.Figure 3: Destination of three sets of scenario tasks. Participants follow the numerical order to reach each location. (0 is the starting point of each scenario).
demographic questions in the first phase and reported their previous 3D first-person perspective game experience. They also completed a wayfin- ding ability factor scale to assess their wayfinding ability. In the second phase, participants engaged in practice sessions within the virtual environ- ment. This allowed them to become acquainted with the essential operations of the experiment, including movement and interaction. Subsequently, they were assigned wayfinding tasks, which were organized into three scena- rios. Three scenarios (see Figure 3) took three campus entrances as starting points, and each set contained four tasks. Participants were divided into three
groups, with ten people in each group to operate two scenarios and eight tasks for each participant. After completing each task, participants comple- ted two questions to report their level of anxiety and rate the directional signs they encountered during the task. In the third phase, participants filled out a comprehensive environmental assessment questionnaire. Finally, conduct a semi-structured interview to understand the reasons behind wayfinding decisions and behaviors.
RESULT AND DISCUSSION
Wayfinding Performance and Behavior During Tasks The results showed that participants spent the most time in Q2 (please find the Administration Building), Q5 (please find the Biotechnology Building Biotech), Q11 (please find the Dept. of Electro-Optical Engineering), and Q12 (please find the Zhongxiao E. Rd. Main Entrance) (see Table 1). In Q2, all participants encountered the directional sign in front of the fourth academic building’s corridor, and most of them walked through it, met a forked road, and saw a directional sign on the road to the right. However, the sign did not provide any information about the Administration Building. Consequently, participants would stop and survey the surroundings. Some participants chose to continue, while some chose to turn left. In addition, the arrow of the first directional sign pointed at the back of the Administration Building caused participants to return to the first directional sign to recheck the information during the task.
In Q5, since the Biotechnology Building Biotech was located side-by-side with the Dept. of Chemical Engineering, it is hard to find the identification sign of the building without looking into the gaps between the buildings. Additionally, only one directional sign on the campus provided relevant infor- mation. Although the arrow on the sign is a diagonal arrow pointing to the upper right, participants still had to go back and forth to find it since no directional sign was present at the critical decision point of turning right.
In Q11, three directional signs on the campus have information about Dept. of Electro-Optical Engineering, two of which are temporary and one permanent. Ten participants found the directional sign helpful after going around the campus for a circle. Additionally, although one of the directional signs is permanent, it was made of stickers without arrow information, and six participants were confused and hesitated about it.
In Q12, there are only two directional signs with information about Zhongxiao E. Rd. Main Entrance on the campus. These signs were situa- ted at opposite diagonal corners, requiring participants to travel a distance
Table 1. Average completion time of each task (seconds).
Exploring the Design of Campus Directional Sign Through Wayfinding Behavior 505
before accessing the information. When they became disoriented in locating the main gate, they used the strategy of walking around the campus wall to find it.
Define the directional sign with target information as a valid directional sign. The efficiency of the directional sign viewed by the participants in each task was obtained by calculating the total number of directional signs viewed by the participants in the task and then dividing it by the number of valid dire- ctional signs (see Table 2). The result showed that the average directional sign efficiency was lower in Q4 (please find the Xinsheng S. Rd. Side Entrance), Q6 (please find the Red House), Q9 (please find the Dept. of Chemical Engi- neering), and Q12 (please find the Zhongxiao E. Rd. Main Entrance). The target information for Q6 does not appear on any directional signs, causing six participants to navigate the campus almost in a complete circle before locating the Red House. However, some participants relied on their memory, as they had previously passed by the distinct red-brick building, making it more noticeable than others. The appearance is strongly connected with the name. Both Q4 and Q12 required participants to find the Entrance. It did not take long to complete the task in Q4 compared to Q12. The Entrance in Q4 was the same as the departure point, and there is an obvious landmark at the Entrance as soon as one enters the campus. Some participants mentioned recognizing the Entrance according to the landmark. While performing task Q9, most participants did not see target information on the first directional sign they encountered. They then either chose paths randomly or assumed that buildings of the same department category would be nearby, leading them to walk in the direction of Dept. of Civil Engineering, which is also an engineering category.
The Evaluations Reported by the Participants in the Questionnaire After completing each wayfinding task, participants answered the questions “The directional signs of this wayfinding task are easy to be understood”(see Table 3) and “This wayfinding task makes me feel anxious” (see Table 4) on a five-point Likert scale. Based on the results of the descriptive statistics, par- ticipants assigned lower ratings to the directional signs and reported higher levels of anxiety during Q2, Q5, Q9, and Q11. After comparing Table 1 with Table 2, we found that the completion time of Q2, Q5, and Q11 of these four tasks was also higher, while Q9 has a lower efficiency of directional signs.
In the final environmental assessment questionnaire, participants evalu- ated the directional signs on campus. The results revealed that the signs
Table 2. The average signs efficiency of each task.
were perceived as moderately easy to understand (mean 3.10, standard devi- ation 1.09) and helpful for wayfinding (mean 3.47, standard deviation 0.86). Furthermore, a survey was also conducted on the two permanent types of directional signs on campus. The findings indicated that the totem signs (mean 3.8, standard deviation 0.86) exhibited better clarity than the finger- post signs (mean 2.93, standard deviation 1.31). Additionally, the totem signs (mean 3.7, standard deviation 1.02) were rated as providing more wayfinding assistance than the finger-post signs (mean 2.67, standard deviation 1.24). It is important to note that the difference in scores for wayfinding assistance is partially attributed to the difference in the number of signs between the two types, as there were seven totem signs and three finger-post signs on the campus.
The Impact of Relevant Game Experience on Wayfinding Performance In the pre-experiment survey, participants reported their experience playing 3D first-person games. Out of the total 30 participants, 6 reported having no experience, while the remaining 24 had experience. An independent- sample t-test was used to compare the completion time of each task between the two groups with and without gaming experience. The results revealed a significant difference in Q5 finding the Biotechnology Building Biotech (p = 0.000 <0.001), indicating that the time to complete the task was still affected by the with/without game experience even when the system’s moving speed remained the same. Since Q5 was the initial task for some partici- pants, and for those without gaming experience, their unfamiliarity with the experimental operation was more obvious. On the other hand, based on observations, participants with previous gaming experience demonstra- ted smoother movement and viewing angle adjustments. They could navigate and control their view simultaneously with greater ease compared to those without prior gaming experience.
Exploring the Design of Campus Directional Sign Through Wayfinding Behavior 507
The Impact of Orientation Perception and Path Memory Ability on Wayfinding Performance The wayfinding ability factor scale, utilized in the initial phase of the expe- riment, consists of three aspects. Regarding orientation perception, those with scores higher than the mean plus one standard deviation were classi- fied as having high spatial ability. Those with scores lower than the mean minus one standard deviation were classified as having the low spatial abi- lity. Participants were divided into two groups of high and low ability. The high spatial ability group contained five participants, whereas the low spa- tial ability group contained seven participants. An independent-samples t-test was used to compare the task completion times between these two groups. The result revealed a significant difference in the Q11 finding the Dept. of Electro-Optical Engineering (p = 0.017 <0.05), indicating that those with high orientation perception could reach their destination faster than those with lower spatial ability.
Regarding path memory ability, participant who obtained scores that sco- red higher than the mean plus one standard deviation were classified as having high path memory ability, while those who obtained scores lower than the mean minus one standard deviation were classified as having low path memory ability. They were divided into two groups high and low abi- lity. Five participants are in the high-path memory ability group, and six are in the low-path memory ability group. An independent-samples t-test com- pared the task completion times between high and low-ability groups. The result revealed a significant difference in the Q1 finding of the Design Buil- ding (p = 0.004 <0.01), indicating that those with high path memory ability could reach the destination faster than those with lower path memory ability.
Participants’ Feedback in Semi-Structured Interviews During the interviews, most participants expressed a greater reliance on the totem directional signs than the finger-post directional signs. Partici- pants mentioned that the color of the finger-post signs tended to blend with the background, making them less noticeable. Additionally, the appearance of the finger-post signs closely resembled streetlights, which caused confu- sion. Participants also pointed out that the finger-post signs were sometimes obstructed by buildings or trees, making it difficult to locate them. Further- more, they found the characters and overall size of the finger-post signs to be small, resulting in inconspicuous and easily ignored. However, few par- ticipants pointed out that the height of the line of sight of the finger-post signs was similar to the building’s primary identifier (e.g., the name of the building), so it is easy to confirm by scanning. On the other hand, the totem signs, with an average height of about 120 cm, required participants to repea- tedly look down and up, which they found less convenient. As a result, these participants tended to prioritize viewing the finger-post signs initially. It is worth mentioning that when asked whether the directional signs were easier to understand by using arrows (like the totem signs) or signs pointing directly to roads or buildings (like the finger-post signs). Some participants indicated that they thought the finger-post directional signs were more intuitive and
could point in more directions. In contrast, participants who chose totem signs said that the arrows were better understood and without the need to look up. In addition, totem signs could be viewed comprehensively from one side, while the finger-post sign required a change of direction to view all the information.
In terms of improvement, participants mentioned their concerns about the limited number of directional signs and insufficient information on campus. They often needed to travel for a while to find signs indicating target infor- mation. However, some participants proposed the potential drawbacks of having signs at every decision point, which could lead to a cluttered campus environment. Participants suggested that, after providing guidance through a directional sign, there should be additional signs at the subsequent turns to prevent them from missing important directions. They emphasized the importance of continuous signage information to avoid the need for repe- ated backtracking and confirmation. Additionally, the oblique arrow is easy to lead to misunderstanding. Some participants thought that the oblique arrow indicated that the destination was in the oblique front, while others felt that they needed to walk on a diagonal road. To address this issue, partici- pants recommended replacing the oblique arrow with a 90-degree right-angle arrow or placing an additional directional sign at corners to enhance clarity and understanding. In addition, the directional signs pointing to the back of the building were also confusing, requiring participants to walk around the building to check.
When participants were asked about the difference in wayfinding betw- een the virtual and real world, four of them mentioned that the virtual environment had a more limited field of view, making it easier to overlook and difficult to remember the surroundings. Four participants noted that in real-world settings, the presence of crowds could influence their wayfinding behavior, as they tended to follow the flow of people. Additionally, partici- pants mentioned that obstructions caused by other individuals could obstruct their view of wayfinding signs, posing challenges in finding the necessary information. One participant suggested that the actual environment might be misleading due to factors such as changing natural lighting conditions, portable signs, and stands, while the remaining 21 said it was approximately the same.
CONCLUSION
The results revealed that the task objectives in the unfamiliar campus environ- ment required more time to find the adjacent buildings with their respective doors facing in different directions. To address this, it may require the addi- tion of supplementary icons to indicate the location of the building, as the absence of such information can lead to missed opportunities or backtra- cking. In addition, people tend to become disoriented when unable to find a directional sign with valid information. In this case, participants may ran- domly choose paths around the campus, use buildings of the same type of department as the basis for direction decisions, or rely on the connection between the appearance and the building name to find the target. Regarding
Exploring the Design of Campus Directional Sign Through Wayfinding Behavior 509
finding the campus entrance, participants found it easier to find the Entra- nce with an obvious landmark near it than an entrance without an obvious landmark. Moreover, most participants found the task target relying on the totem signs due to the inconspicuous height, color, and layout of the finger- post signs, which were prone to be overlooked. However, during interviews, participants noted that finger-post signs were more straightforward regarding direction identification.
When designing directional signs, it is crucial to consider their placement, the consistency of information, the use of arrows, and the legibility of colors and text. These factors contribute to preventing confusion and disorienta- tion among pedestrians. Furthermore, understanding how people interact with different types of signs during the wayfinding process is essential in determining the most suitable form of signage.
The virtual environment offers the advantage of overcoming the limitati- ons of physical space and allows for flexible control of various factors during experiments. However, during the investigation, some participants felt dizzy and needed a short break because of moving in the virtual environment. Interviews revealed limitations related to the narrow field of view, absence of pedestrian flow, and limited variation in scenery. Despite these concerns, most participants thought there was no significant difference, suggesting that the virtual environment remains a feasible tool for conducting wayfinding experiments.
REFERENCES
Abu-Ghazzeh, T. M. (1996). Movement and wayfinding in the King Saud University built environment: A look at freshman orientation and environmental information. Journal of Environmental Psychology, 16(4), 303-318. Conroy, R. A. (2001). Spatial navigation in immersive virtual environments. Ph. D.
diss., University of London. Farr, A. C., Kleinschmidt, T., Yarlagadda, P., & Mengersen, K. (2012). Wayfinding: A simple concept, a complex process. Transport Reviews, 32(6), 715–743. Iftikhar, H., Shah, P., & Luximon, Y. (2021). Human wayfinding behaviour and
metrics in complex environments: a systematic literature review. Architectural Science Review, 64(5), 452–463. Seidel, A. (1982, July). Way-finding in public spaces: The dallas/fort worth, usa airport. In 20th International Congress of Applied Psychology (pp.15–31). Tzeng, S. Y., & Huang, J. S. (2009). Spatial forms and signage in wayfinding decision
points for hospital outpatient services. Journal of Asian Architecture and Building Engineering, 8(2), 453–460. Zhao, J., Sensibaugh, T., Bodenheimer, B., McNamara, T. P., Nazareth, A., Newcombe, N.,... & Klippel, A. (2020). Desktop versus immersive virtual environ- ments: effects on spatial learning. Spatial Cognition & Computation, 20(4), 328–363.
LISTED IN THE AHFE DIGITAL BOOKSTORE CATALOGUE
Explore the complete digital volume
Usability and User Experience
Read this individual research paper free through the original publisher, or explore the full digital proceedings book.
ISBN 978-1-958651-86-5
Explore this ISBN in the AHFE Bookstore ↗Listed in the July 2026 bookstore catalogue; search by ISBN to confirm current availability · Digital book purchase optional