Ching Yi Lee, Ching I Chen, Meng-Cong Zheng (2022). User Experience of Taiwan Railway Ticket Vending Machine. In: Usability and User Experience. AHFE Open Access, vol. 39, pp. 126–132. https://doi.org/10.54941/ahfe1001699
Since its inception, the Taiwan Railway Ticket Vending Machine (TRA-TVM) has been used only by a few people because of its complex functions. Meanwhile, the Taiwan Railway ticket offices always have long queues. In light of this phenomenon, the Taiwan Railways Administration has released a new system in 2021. This study aims to determine whether the new system can meet users' needs to achieve an entirely self-service ticketing process.This study evaluated the usability, user psychology, and behavior of the TRA-TVM. Participants with different levels of self-efficacy (SE) were selected before the test. The sample consisted of 36 participants (16 males and 20 females) who didn't use the TRA-TVM before. In addition, the whole test was executed online. Conducted the evaluation as follows: (1) Filled out the questionnaires and finished the function sort of the TRA-TVM before the tasks to understand the participants' thoughts and past experiences. (2) Participants were asked to operate three tasks, one of which was related to the hardware interaction of the system. (3) At the end of each task, participants had a semi-structured interview to clarify how they operated during the task. (4) When finishing all the tasks, participants need to complete the QUIS and SUS questionnaires to indicate their evaluation of what they felt about this system.The results show a high error rate in the initial operation stage for the subjects when selecting the ticketing method and when customizing the station or the time of arrival and departure. The participants' performance showed that users made more errors in purchasing tickets than in operating other system functions and found that there is no absolute relationship between the level of SE and operational performance. Only in the "Ticket Refund(Q6)" function found a significant difference between the participants' SE and the number of errors. Those with high self-efficacy (HSE) had a significantly higher error rate for the refund function than those with low self-efficacy (LSE). In the semi-structured interview, HSE mentioned that they were unnoticed the feedback on the system and therefore were not sure how to operate it. Overall, the most often mentioned problem was "Confused," like the order of the ticketing process and the logic of the operation. For example, some participants felt that the function of "Seats Left(Q2)" shouldn't be included as a ticketing method when purchasing a ticket. Or the current operational logic made it impossible for participants to understand that they couldn't use "Express Ticket Purchase" or "Non-Reserved Trains" to purchase an unreserved ticket with a bicycle. In addition, the users' initial mental model may cause the user to make poor decisions and may even intensify or reduce the users' feelings during the process. Future optimization of the system should be prioritized at two stages, namely the selection of the ticketing method and the customizing station or time of arrival and departure. These findings could be used to improve the user experience in the future, allowing users to have a better experience during the ticketing process.
A Railway Ticket Vending Machine is a means of purchasing tickets, and the majority of passengers use it for “completing the purchase” alone. To achieve the purpose of ticketing, which needs to be a good interaction between the system and the user. In addition to the functionality of the system to meet the users’ needs (Wu, Chen, & Leung, 2008), the operation must feature usability and learnability (Ek¸sio˘glu, 2016), and the simplification of the process or the time performance must not neglect the element of learning to operate (Aceves Gutierrez, Martin Gutierrez, & Del-Rio-Guerra, 2019).
The Taiwan Railway (TRA) is vital infrastructure in Taiwan. Compared to other rail services in Taiwan, the TRA’s rail map spans the whole of Taiwan, with 241 stops (Compiled by Taiwan Railways Administration, 2020), and is used by multiple users, making the system more complex in terms of functions and processes. On top of that, Taiwan Railway -Ticket Vending Machine (TRA-TVM) is often used for travel, business trips, and visits; most users need to purchase tickets quickly without using them frequently. Therefore, TRA- TVM needs to meet the diverse needs of travelers and guide them through the ticketing process quickly.
In 2021, TRA launched a new TVM. Compared to the old one, it inclu- ded many new functions such as “Standing Tickets,” “Ticket Return,” and
User Experience of Taiwan Railway Ticket Vending Machine 127
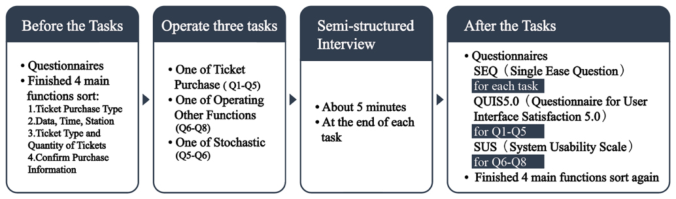
Figure 1: Test process and structure.
“Bicycle-friendly Train,” allowing users to perform different operations on the system interface. To achieve the goal of self-service, it is essential to under- stand whether the current system functions and operations can meet the users’ needs. On the other hand, it is also necessary to consider users’ operations’ psychological and behavioral aspects to understand how different users think and operate when using the system. As self-efficacy (SE) is seen as a precur- sor to predicting intention to use (Compeau & Higgins, 1995), and mental models are a way of self-understanding that users develop as they interact with the real world, it is often applied to the next similar event (Brata & Brata, 2020). Thus not only does SE impact the outcome achieved by the user (Pajares, 2002), but mental models can also interfere with the users’ actions and learning (Saul Greenber, 2012). In view of this, the study uses different users’ SE and mental models to observe users’ performance and percepti- ons of their actions, which can be used as a reference to improve the user experience.
METHODS
The TRA-TVM has eight different main functions, each of which is given an oriented task. The ticketing tasks include “Non-Reserved Trains (Q1),” “Seats Left (Q2),” “Train Number (Q3),” “Time Period (Q4),” and “Bicycle- Friendly Train (Q5),” these tasks will focus on the operation of the interface content. The other three functional tasks, including “Ticket Return (Q6),” “Ticket Collection (Q7),” and “e-Ticket top-up (Q8),” will require more frequent interaction with the machine input/output.
Before the test, 97 volunteers who had completed the SE form were ran- ked by their scores. The first third was selected as the high self-efficacy(HSE) group and the last third as the low self-efficacy(LSE) group. There were 18 participants in each group, for a total of 36 valid participants, 16 males and 20 females, aged 20-59 years. None of the participants had any previous experience with the TRA-TVM. Due to the epidemic’s severity, the test was conducted online using google meet. Participants were asked to share a com- puter screen to perform the tasks given to them by the researcher, all of which were videotaped. The test process consisted of four steps: completing the pre- test questionnaire and sorting of TVM main functions, task-oriented, semi- structured interviews, and ending the post-test questionnaire and re-ranking of TVM main functions (see Figure 1).
Table 1. TVM’s primary function sorting.
Table available in the original PDF paper.
A B C Departure/Arrival Station 1 2 1 Ticket Purchase Type 2 1 3 Ticket Type and Quantity of Tickets 3 3 2 Confirmation of ticketing information 4 4 4 Before (%) 33.3 30.6 13.9 After (%) 38.9 38.9 8.3
RESULT
Changes in Participants’ Mental Models Before and After Test The pre-test ranking results were considered part of the respondents’ initial mental model. It indicates that the pre-test mental model of 30.6% of the participants who chose sorting B is consistent with the ticketing process of the TRA-TVM. After operating the TRA-TVM, 38.9% of participants decided on the A or B sorting method. Although the increase in acceptance of “Ticket Purchase Type” first was higher, there was no way to tell which process was more appropriate, as each method had its supporters (see Table 1). 77.8% and 86.3% of the pre-test and post-test participants, respectively, identified the main functions of the TVM as A, B, and C rankings.
Performance of Participants in Operating System Functions The test results showed that the error rate occurred more often when parti- cipants were purchasing tickets than when operating other system functions. Of these, Q5 had the highest error rate of all system functions. On average, each person made 0.28 errors in each step of the stages; and the SEQ scale completed by the participants revealed that they generally found this task to be more difficult for them than the other tasks. In terms of the error rate at each stage of ticketing, the error rate was higher when selecting “Step1 Ticket purchase type” and “Step2 Time/Station”. The Q2 task had the high- est error rate of the two stages, with an average of 0.44 and 0.5 errors per person per step, respectively. As mentioned above, this may explain the rela- tively low ratings on the QUIS scale for the ticketing task for those who had performed both Q2 and Q5. Alongside this, on the SUS scale, which evalua- tes other functions of the system, the lowest scores were given by those who had performed the Q8 task. This result corresponds to the error rate of the participants, as the Q8 task also has the highest error rate among the other functions of the system (see Table 2).
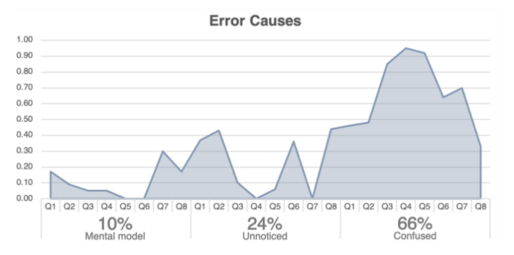
Feedback From Participants in Semi-Structured Interviews In this study, the reasons for the errors mentioned by the participants in the interviews were categorized into three aspects (see Figure 2): 1.) being influenced by the mental model, 2.) unnoticed the operation of the system (“Unnoticed”), and 3.) confused about how to operate (“Confused”). About 10% of the participants were influenced by the “Mental model,” with the
User Experience of Taiwan Railway Ticket Vending Machine 129
Table 2. Average frequency of errors per person per step for each question.
Operation with system interaction Average Other Function Q6 18 - 0.16
0.12 Q7 12 - 0
Q8 12 - 0.19 Step5: Seating preference Step6: Confirm Purchase Information Step7: Payment Step1: Ticket Purchase Type Step2: Time/Station Step3: Train Number Step4: Ticket Type and Quantity of Tickets
*Error rate = number of errors for the question/number of operators/steps to be performed
Figure 2: The percentage of error causes that are three aspects.
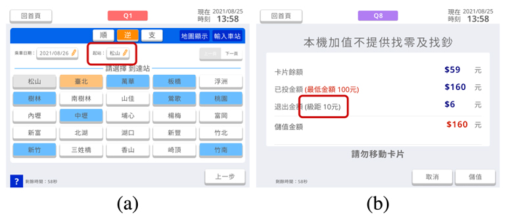
most frequently mentioned being that about 42% did not think the depar- ture station should be preset when operating the Q1 task (see Figure 3-a). The departure station was already pre-determined. On the other hand, “Unnoti- ced” accounted for approximately 24% of the three aspects. Q8 was the task where the most unnoticed occurred, accounting for 44% of all causes of error for this task; for example, 58% of those tested indicated that they did not notice the intervals of the value-added when operating Q8 (see Figure 3-b).
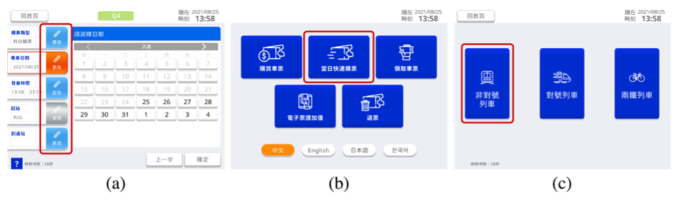
Additionally, “Confused” was the main cause of errors in all three aspects, accounting for approximately 66% of cases. This was most likely to occur in Q4 and Q5, with each accounting for 95% and 92% of the error causes for this task, respectively. For example, in Q4, 92% of participants said they were unsure of the color difference in the navigation bar (see Figure 4-a), so they tapped back and forth to repeat the operation. In Q5, the most frequently cited issue was the order. For example, 50% of the participants thought that they could use “Non-Reserved Trains,” or 39% of the partici- pants thought that they could use “Express Ticket Purchase” to purchase an unreserved ticket with a bicycle (see Figure 4-b and Figure 4-c), which are common reasons for these errors.
Figure 3: (a) The departure station in the Q1 task is already pre-defined ( ). (b) The interval of the thee-Ticket top-up in the Q8 task ( ) is not easily noticeable.Figure 4: (a) The color of the left-hand navigation bar in the Q4 task is not clear. (b) In the Q5 task, it was mistakenly thought that you could use Express Ticket Purchase ( ) . (c) In the Q5 task, it was mistakenly thought that you could select: Non-Reserved Trains ( ).
DISCUSSION
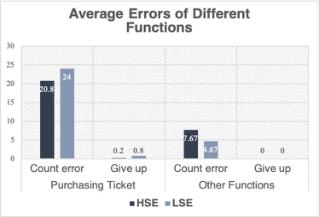
Differences in performance of high and low SE individuals in the operating system functioning Overall, LSE made an average of 3.2 more errors per task in the ticketing task than HSE. Conversely, when operating other functional tasks, HSE made an average of 3 more errors than LSE (see Figure 5-a). The number of errors made by high and low SE varied between tasks (see Figure 5-b), suggesting that participants’ confidence in operating the TVM alone did not necessarily affect actual performance.
It was surprising that there was a discrepancy between the performance of participants and the evaluation after the task. Overall, the average perfor- mance of HSE on the task was better, but the average on the QUIS scale was lower than LSE. Given the pre-test sorting results, 44% of the LSEs’ “Mental model” were consistent with the TRA-TVM ticketing process, compared to 16.7% of HSE. It may be that HSE felt more frustrated than LSE due to the influence of their “Mental model”in the actual operation. A similar situation was found in other functional tasks, like the Q8 task.
Feedback From High and Low SE Individuals in Semi-Structured Interviews Across several tasks, HSE generally cited “Confused” or “Unnoticed” more often than LSE. The interviews also revealed that HSE trusted their judgment
User Experience of Taiwan Railway Ticket Vending Machine 131
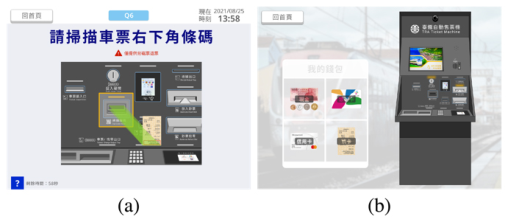
Figure 5: (a) Average number of errors for different functions and number of abandon- ments. (b) Count number of errors for each task.Figure 6: (a) Helpful description of the system hardware operation. (b) The participants had to complete the system hardware task at the interface.
during operation more than LSE, e.g., 83% of LSE reported using machine’ guide light to assist in completing tasks in Q7, compared to 50% of HSE. However, when operating other functional tasks, it was more important for the participants to follow the instructions and complete the task (see Figure 6- a and Figure 6-b). HSE acted on their judgment, but as a result, there were more instances of “Confused” or “Unnoticed,” which even affected their per- formance, e.g., HSE made more errors than LSE in Q6, which was significant (p = 0.049). The condition of ‘not knowing how to do it’ was mentioned as the cause of approximately 32% of all errors by HSE in the interviews, compared to 5% by LSE.
In addition, participants were influenced by their “Mental model” on system operation. For example, in the Q8 task, HSE referred to past habits or experiences approximately 7% of all error causes, up from 4% for LSE. It is also assumed that even though the HSE group made fewer errors and took less time on average to operate, the HSE group still felt more difficult. Because their initial mental model contradicted what the system was doing, and therefore gave a relatively low rating.
CONCLUSION
The error rate of the participants in each task shows that there is still much room for improvement in the TRA-TVM for self-services. For future, prio- rity could optimize “Step1 Ticket purchase type” and “Step2 Time/Station”
stages, as these two stages have a high error rate in multiple tasks, and both are the initial stages of the operation, which have a significant impact on the purchase of the correct ticket. In this study, there were more instances where the participants were “Confused.” When redesigning should reduce the likelihood of users feeling hesitant or confused. For example, as sugge- sted by the participants, remove the “Seats Left” or rearrange the position of the “Express Ticket Purchase” and “Bicycle-Friendly” tickets in the interface hierarchy.
On the other hand, it was found that the users’ “Mental model” not only influenced performance but even increased or decreased the degree of diffi- culty in the process. Besides, SE does not directly affect performance but, as a belief, indirectly influences the outcome.
The question of whether to follow the “Mental model” of the participant can be explored later on by optimizing “Step1 Ticket purchase type” and “Step2 Time/Station”. Such as, it would be better to follow the users’ “Mental model” or allow users to modify their mental models through the learning interface would be smoother. Also, it is worth exploring how the design can strike a balance between high and low SE users and increase their willingness to follow the system’s instructions.
REFERENCES
Aceves Gutierrez, L. C., Martin Gutierrez, J., & Del-Rio-Guerra, M. S. (2019).
Having a smarter city through digital urban interfaces: an evaluation method. Applied Sciences, 9(17), 3498. Brata, K. C., & Brata, A. H. (2020). User experience improvement of japanese language mobile learning application through mental model and A/B testing. International Journal of Electrical and Computer Engineering, 10(3), 2659. Compeau, D. R., & Higgins, C. A. (1995). Computer self-efficacy: Development of
a measure and initial test. MIS quarterly, 189–211. Compiled by Taiwan Railways Administration, M. (2020). Statistial Report of Taiwan Railways Administration. Retrieved from Ek¸sio˘glu, M. (2016). User experience design of a prototype Kiosk: a case for the
Istanbul public transportation system. International Journal of Human-Computer Interaction, 32(10), 802–813. Pajares, F. (2002). Overview of Social Cognitive Theory and of Self-Efficacy.
Retrieved from https://www.uky.edu/~eushe2/Pajares/eff.html Saul Greenber, S. C., Nicolai Marquardt, Bill Buxton. (2012). Uncovering the Initial Mental Model. In Sketching User Experiences: The Workbook (pp. pp. 217–226). Wu, Y.-C., Chen, L.-C., & Leung, C.-Y. (2008). User Interface Design of Touch
Screens for Seat Reservation of Mass Transportation System. Tatung University, Available from Airiti AiritiLibrary database. (2008)
LISTED IN THE AHFE DIGITAL BOOKSTORE CATALOGUE
Explore the complete digital volume
Usability and User Experience
Read this individual research paper free through the original publisher, or explore the full digital proceedings book.
ISBN 978-1-958651-15-5
Explore this ISBN in the AHFE Bookstore ↗Listed in the July 2026 bookstore catalogue; search by ISBN to confirm current availability · Digital book purchase optional