Yi Shan Lee, I Wen Yen, Meng-Cong Zheng (2023). Usability Evaluation of Self-Ordering Kiosks in Fast Food Restaurants. In: Usability and User Experience. AHFE Open Access, vol. 110, pp. 299–308. https://doi.org/10.54941/ahfe1003203
In recent years, the introduction of technology and digital management into the service industry has gradually changed consumers' lifestyles. With the popularization of equipment systems, the development and use of self-ordering kiosks have gained much attention in the restaurant industry. However, the utilization rate of self-ordering kiosks has been meager since their establishment, and they cannot relieve the queues at the counter. This study investigates whether self-ordering kiosks in fast food restaurants can meet customers' needs to achieve a self-ordering process and improve ordering efficiency.This study was conducted on three representative fast-food chains in Taiwan, and their self-ordering kiosks were used as the target of the investigation. Thirty participants with no experience were invited to conduct an ordering task experiment to evaluate the ease of use of the ordering interface. The experiment was divided into five contextual tasks: meal selection, modifying the order, changing the meal comment, self-checkout and selecting receipt type, and redeeming e-coupon. All procedures were conducted on the self-ordering kiosk in the fast-food restaurant. The evaluation methods were as follows: 1) the participants performed the tasks sequentially and recorded the time performance, and conducted think-aloud during the tasks; 2) the participants filled out SUS and QUIS questionnaires to indicate their evaluation and feelings about the self-ordering kiosk; 3) semi-structured interviews were conducted to understand the participants' operation and future expectation during the tasks.The results showed that in the operation of the self-ordering kiosk in all three fast-food restaurants, there were cases of incorrect interface operation by the participants. We found that: 1) 33% of the participants indicated that they were unclear about the operation process, and the kiosk prompts were not clear enough to cause uncertainty among the participants. In particular, when an error occurred and it was necessary to go back to the previous step, the prompts in the system interface were ineffective in helping the participants operate smoothly, resulting in a long ordering time. 2) All three self-ordering kiosks use 21.5-inch upright touch screens and a full-page interface design, making it easy for the participants to ignore the information and hardware devices below the interface when operating at close range. For example, 37% of the participants said they could not find the shopping cart at the bottom of the interface and could not confirm the scanner's location the first time when redeeming the e-coupon. 3) 73% of the participants said in the questionnaire that the function of customizable meals is essential, but the degree of customization in the current self-ordering kiosk is relatively low. Finally, the SUS scores of the three quick-service restaurants' self-service ordering kiosks were 56.25 (F grade), 62 (D grade), and 56 (F grade), respectively, which did not meet the ease of use criteria. The results of this study helped to understand the operational behavior of the participants in using the self-ordering kiosks.
Meuter et al. (2000) defined Self-Service Technologies (SSTs) in which users can complete services independently without the direct involvement of service personnel. In recent years, with the popularity of self-service systems, catering operators have gradually paid attention to the development and applica- tion of self-service systems to meet the rapid and stable service demand. For businesses, self-service systems reduce labor costs and improve efficiency, productivity, and effectiveness (Dabholkar, 1996). For consumers, self-service systems offer convenience and autonomy and save time in queues (Collier & Kimes, 2013; Turner & Borch, 2012; Lee et al., 2010; Dabholkar, Bobbitt & Lee, 2003; Meuter et al., 2000). Self-service kiosk (SSK) is one of the most diverse forms of technology for SST. It has been widely used in ATMs, self-checkout stations in hypermarkets, Airport Self-service check-in kiosks, and so on (Vakulenko et al., 2019). Diversifying kiosks increases operators’ opportunities to sell products and serve customers, bringing consumers more quick and convenient added value. More and more restaurants in Taiwan are using self-service kiosks to improve efficiency by replacing the actual intera- ction with consumers in the past through a technology-based service model. Compared to traditional over-the-counter service methods, consumers prefer
self-service technology because it avoids contact with service personnel and is more convenient (Dabholkar, 1996; Meuter & Ostrom et al., 2003).
In theory, after the restaurant sets up a self-ordering kiosk, it can streamline the service staff who order food at the counter. However, the “foodNEXT” magazine study (2021) found that most consumers, even in the face of self-ordering kiosks, are still highly dependent on the guidance of service per- sonnel, which has not achieved the effect of reducing labor costs. According to a 2019 survey conducted by foodNEXT magazine on fast food restaurants, 76% of consumers still use the over-the-counter ordering method most often, and only 6% of consumers would choose to use a self-ordering kiosk. After digging deeper into why consumers believe self-ordering kiosks are challen- ging to operate and take longer than ordering at the counter. Even though Taiwanese fast food restaurants keep encouraging consumers to use it, the usage rate has never been effectively improved.
This study aims to discuss the usability evaluation of the interface of the self-ordering kiosk of restaurants, including hardware operation efficiency, functional architecture, and information presentation methods. The results will be used for subsequent kiosk interface optimization and to examine whether the design can improve user experience. This study provides pra- ctical suggestions for the interface of the self-ordering kiosk of restaurants, which can help the smooth interface operation and process and improve the willingness and order efficiency.
METHODS
Three representative fast food chains in Taiwan were targeted in this study, with their self-ordering kiosk as the research objectives. We invited thirty par- ticipants aged 20 to 39 to conduct task experiments. None of the participants had used the self-ordering kiosk to avoid the participants’ familiarity with the test samples and affecting the experimental results. Every ten participants are for one fast food restaurant in the experiment to evaluate the ease of use of the ordering interface.
There are five relevant situational tasks (see Table 1): meal selection, modifying the order, changing the meal comment, self-checkout and sele- cting receipt type, and redeeming e-coupon. During the experiment, all thirty participants performed the same task, and each task must be per- formed sequentially, one task being completed and moving on to the next. To conduct a more comprehensive and realistic study of the self-ordering kiosk interface, all procedures were carried out on the self-ordering kiosk in the restaurant. 21.5-inch vertical touch screens are used in all three fast- food restaurants to record the participants’ operation behavior and time performance throughout the whole process.
After completing the task, the participants are asked to fill out the SUS (System Usability Scale) and the QUIS (Questionnaire for User Interface Sati- sfaction) according to the interaction with the kiosk during the experiment to indicate ease of use and satisfaction with the self-ordering kiosk. Then, two multiple-choice questions and semi-structured interviews will be conducted to gain an in-depth understanding of the overall feelings and evaluations of
Usability Evaluation of Self-Ordering Kiosks in Fast Food Restaurants 301
Table 1. Task and operation instructions.
Table available in the original PDF paper.
Task Operation Instructions Task 1 Meal selection Browse the main menu ▶Select designated main meal ▶Select designated sides ▶Add to order Task 2 Modify the order
Browse order ▶Cancel designated sides ▶Add newly designated sides Task 3 Change the meal comment Confirm order ▶Self-checkout and select receipt type ▶Complete payment
Browse order ▶Modify designated drink ▶Comment: less ice Task 4 Self-checkout and select receipt type Task 5 Redeem e-coupon Browse the e-coupon redemption page ▶Enter or scan your phone’s e-coupon number to redeem
the participants in the task operation, which could be used as a reference for future improvement.
RESULT AND DISCUSSION
The results showed that restaurant B had the best performance among the three restaurants in terms of task operation time, number of errors, and SUS. In terms of the total duration of the experiment (see Table 2), restaurant B (M = 175.60, SD = 30.39) is quicker than restaurant A (M = 257.50, SD = 59.30), and restaurant C (M = 214.50, SD = 56.17), with significant differences between the three fast food restaurant (P = 0.005 <.05).
In Task 1, “Meal selection,” there were significant differences between the average operation time of the three fast food restaurants (P = 0.019 <.05). Restaurant B is the best (M = 37.50, SD = 8.95), restaurant C is the second best (M = 54.10, SD = 26.23). Restaurant A is slightly worse (M = 82.50, SD = 51.25). The error rate was higher in restaurants A and C, with 70% and 80% errors (see Table 3), which increases the operation time.
In Task 3,“ Change the meal comment,” restaurant C had the shor- test average time (M = 8.70, SD = 2.41), followed by restaurant B (M = 16.30, SD = 13.50), Restaurant A had the longest average operation time (M = 23.00, SD = 6.22), and there were significant differences between
Table 2. Time performance of three restaurants (Unit: seconds, *p <.05).
Table available in the original PDF paper.
Task 1 M Task 2 M
Task 3 M Task 4 M
Task 5 M
(SD) (SD)
(SD) (SD)
(SD)
Time Performance
Total Duration M (SD)
82.50 (51.25)
42.20 (25.87)
23.00 (6.22)
52.40 (13.66)
57.40 (22.88)
Fast food restaurant A 37.50 (8.95)
43.70 (23.86)
16.30 (13.50)
47.40 (11.82)
30.70 (8.54)
257.50 (59.30) Fast food restaurant B 54.10 (26.23)
Table 3. The error rate of three fast food restaurants.
Table available in the original PDF paper.
Error Rate Task 1 Task 2 Task 3 Task 4 Task 5 Fast food restaurant A 70% 20% 70% 0% 50% Fast food restaurant B 20% 70% 30% 30% 20% Fast food restaurant C 80% 100% 0% 90% 40% F 5.264* 11.919* 7.929* 18.900* .969 Significance .012 .000 .002 .000 .392
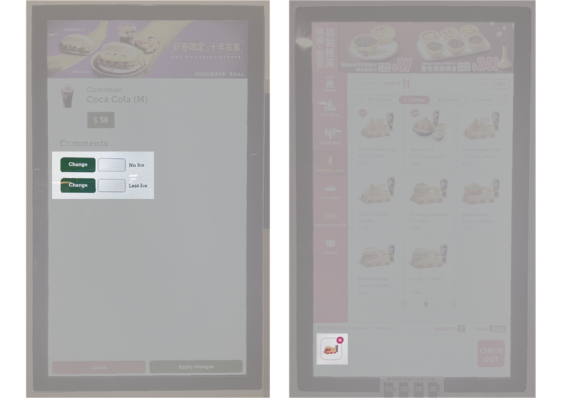
Figure 1: Restaurant A (left) and Restaurant B (right) in the image mark the error-prone interface design.
the three restaurants (P = 0.004 <0.05). Restaurant A has extended the ope- ration time due to the complexity of the information architecture and the high error rate. In terms of the button design of the interface, 70% of the participants in restaurant A had the same operation error in Task 3. When selecting “less Ice,” they will first click on the blank space, and after finding that there is no feedback on the interface, turn to click the “Change” button (see Figure 1). Although the steps of restaurant B are more straightforward, its “Cross” button is at the top right of the order icon. Because of the small scale of the illustration, the participants are prone to mistakenly touch the “Cross” button and cancel the entire order, resulting in errors. Thus, the design of the above display interface buttons does not meet the users’ habits.
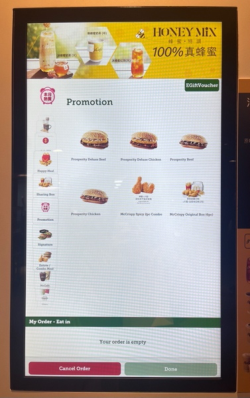
In Task 5, “Redeem an e-coupon,” restaurant B (M = 30.70, SD = 8.54) and restaurant C (M = 35.60, SD = 5.87) outperformed restaurant A (M = 57.40, SD = 22.88), There were significant differences between the three (P = 0.001 <0.05). The error rate of the participants in restaurant A in this task is 50%. It is found that the reason for these participants’ errors is that they are used to looking for the “E-coupon” button in the classification list first. However, the “E-coupon” button of restaurant A is located separa- tely at the top right of the interface (see Figure 2), which is not in line with the
Usability Evaluation of Self-Ordering Kiosks in Fast Food Restaurants 303
Figure 2: Restaurant A “E-coupon” button position.Table 4. The number of errors of three fast food restaurants (Unit: times).
Table available in the original PDF paper.
Number of Errors Task 1 Task 2 Task 3 Task 4 Task 5 Total Number Fast food restaurant A 9 3 7 0 6 25 Fast food restaurant B 2 7 3 3 2 17 Fast food restaurant C 16 19 0 12 4 51
user’s experience. The images and text descriptions used by restaurants B and C on the redemption interface are scanned Q.R. codes. However, e-coupons have two kinds of Q.R. codes and barcodes. The text and image prompt on the layout is incomplete, which causes psychological uncertainty for users.
In addition, the number and causes of the participants’ errors in the five tasks were counted to explore the specific steps in which the operation errors of the participants occurred. Regarding the number of errors, restaurant B is the best, restaurant A is the second, and restaurant C has the highest number of errors (see Table 4). In Task 1, “meal selection,” restaurant C made the most mistakes, followed by restaurant A. The main error in restaurant C is that the participants did not find that the shopping cart automatically contai- ned the basic food when choosing the sides, which occurred eight times. In the follow-up interview, the participants said that the target food to be selected was gray on the interface, and they would mistakenly think that it could not be added or was not currently available. The shopping cart is located at the top of the interface, which is also easily ignored, so they overlook the basic food that is automatically contained in the shopping cart. Four times all the errors that occurred at restaurant A were the participants were looking for the task meal in the wrong classification list. Restaurant A has ten catego- ries, which is the most complex compared to the classification of restaurants B and C. The list interface can be swiped up and down and cannot be viewed
Figure 3: Restaurant B edit order page.
simultaneously. The same meal may also appear in different classification lists, resulting in easy confusion and misclassification in the search for the task meal.
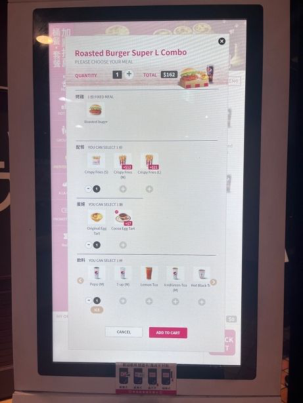
In Task 2, “Modify the order,” the restaurant C participants all clicked on the combo initially added to the order to modify the meal during the expe- riment, which occurred ten times. However, restaurant C’s kiosk design can only cancel the entire combo and re-select the meal. Moreover, the partici- pants at restaurant B wanted to change the sides directly during the original order, which occurred five times. The kiosk only provides purchase upgra- des of food matching but cannot make overall changes to the selected combo (see Figure 3). The experiment found that the participants were accustomed to directly modifying the original order. However, restaurant B’s and C’s self- ordering kiosks did not provide the service of directly modifying the order. They had to cancel the original meal and choose again, which was easy to cause operation errors and prolonged the operation time. In Task 4, “Self- checkout and select receipt type,” restaurant C had the most errors. Seven occurred because the participants held the credit card against the wrong card reader when tapping to checkout, indicating that the hardware device’s location information was undefined.
Overall error cause, the most error in restaurant C is that when the partici- pants add the task meal, they do not click the “Add to order” blinking button but directly click the “Order complete” button. Four times occurred in Task 1, one in Task 2, and four in Task 5, for a total of nine occurrences. It shows that the interface’s layout and operation guidance needs to be improved.
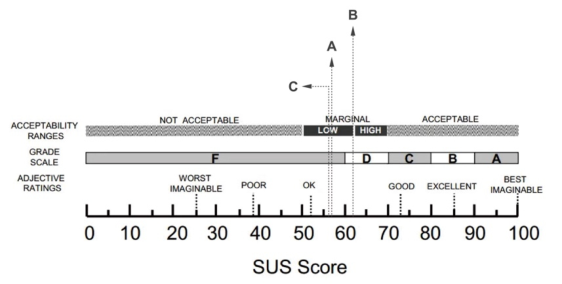
Based on the SUS questionnaire, restaurant B had the average SUS score (M = 62.00, SD = 13.93), restaurant A score (M = 56.25, SD = 25.15), and restaurant C score (M = 56.00, SD = 17.17). Restaurant B (62), restaurant A (56.25), and restaurant C (56) all failed to meet the usability standard
Usability Evaluation of Self-Ordering Kiosks in Fast Food Restaurants 305
Figure 4: Average SUS score and rate of three restaurants.
(68) and were rated D and F (see Figure 4). Thus, there is still room for improvement regarding the interface of the three restaurants.
The QUIS questionnaire adopts the Likert seven-point scale, according to the five components: Overall reaction, Screen, Terminology and system infor- mation, Learning, and System capabilities. The overall average score of the participants was over 4 points, and the positive adjectival vocabulary evalua- tion was adopted. In the Overall reaction, restaurant B had the lowest average score (M = 4.0, SD = 0.73). It mainly tends to have negative word evaluati- ons between “frustrating” and “satisfying” in Q3 and between “boring” and “interesting” in Q5, with an average score of 3.4 and 3.3. In the Screen, the overall evaluation of restaurant B (M = 4.4, SD = 1.27) is slightly worse. In Q11, “Graphic design,” the participants’ feedback was biased towards the negative adjective “unattractive,” with an average score of 3.2. In the System capabilities, the overall evaluation of restaurant A (M = 4.4, SD = 1.12) is slightly worse. In Q21, “Kiosk execution speed,” the respondents’ feedback was biased towards the negative adjective “slow,” with an average score of 3.5. In the experimental operation process and interviews, it can be found that restaurant A’s self-ordering kiosk interface is prone to delayed response and sluggishness.
Finally, there are two additional multiple-choice questions. Question 1: What problems did you encounter during the experiment? The results sho- wed that the most encountered problem was that they could not find the shopping cart at the beginning, with 11 participants ticked (see Table 5). In the follow-up interview, the participants said that the main reason why they could not find the shopping cart at the beginning was because of the non-obvious button. There were 10 participants (five in restaurant C, three in restaurant B, and two in restaurant A) who did not know the operation process steps during the operation.
Question 2: Among the functions of the self-ordering kiosk interface, which functions do you think are essential? The results showed that twenty- four participants thought actual meal pictures were important (see Table 6). The twenty-two participants said that the degree of customization of meals was necessary. However, the current self-ordering kiosk can only achieve a
Table 5. Results of the problems encountered by the participants (Unit: persons).
Table available in the original PDF paper.
Problems Encountered Fast food restaurant
Fast food restaurant
Fast food restaurant
Total Number
A
B
C
5 1 5 11
Can’t find the shopping cart at the beginning
5 3 0 8
Don’t know how to operate 2 3 5 10 Can’t find the task meal 2 3 4 9 Don’t know how to redeem e-coupon
1 1 4 6
Don’t know how to modify the order
0 3 2 5
Don’t know how to change the meal comment
1 1 0 2
Don’t know how to self-checkout
Table 6. Results of functions considered essential by participants (Unit: persons).
Redeem e-coupon 6 5 5 16 Special promotion reminder
3 3 2 8
Receipt type selection 2 6 5 13 Hot meal recommendation 5 4 3 12 Season limited recommendation Meal nutrition 2 3 2 7
low degree of customization, and restaurants B and C only have the choice of beverage ice content. Seventeen participants agreed that the choice of self- checkout methods was essential. The only payment methods allowed by fast food restaurant B’s self-ordering kiosk were prepaid stored-value cards issued by the restaurant and X bank credit cards, which the participants said were inconvenient in interviews. Restaurant A has the most diversified options compared to the payment methods available in the other two self-ordering kiosks. It supports credit card payments from multiple banks and can choose Q.R. code mobile payment or electronic ticket payment. It indicates that the multiple payment methods make it more convenient for users to operate.
Usability Evaluation of Self-Ordering Kiosks in Fast Food Restaurants 307
CONCLUSION
We found that restaurant B performed best in terms of time performance and error rate among the three restaurants. However, according to the types and number of meals of the three restaurants (including the arrangement and combination of main meals and sides, excluding limited-time breakfast and seasonal meals), there were 197 meals in restaurant A, 85 in restaurant B, and 229 in restaurant C. The number of meals at restaurant B is the lowest among the three restaurants, and the number of meals at restaurants A and C is at least twice as high as that of restaurant B. As a result, it is reasonable that the performance of restaurant B is the best among the three.
Based on the above survey, we conclude with the following recommendations:
1. Interface procedure steps to avoid misunderstanding by the participants: Neither the configuration of the function buttons nor the operation pro- cess’s design is in line with the user experience, resulting in errors during operation and users’ frustration. Among the follow-up sorted problems encountered by the participants, 33% said that they did not know the operation process; 37% said that they could not find the order position at first, and the way the order position was presented in the layout nee- ded to be improved. The interface’s ease of use should refer to the user’s brain model so that the user can operate more smoothly and effectively to reduce the error rate. 2. Interface levels and meals should be appropriately categorized in layers: Among the follow-up sorted problems encountered by the participants, 30% said that they could not find the appointed meal by the task. The main meals of restaurant B are completely uncategorized, wasting a long time to find the target meal. The interface of restaurant A has too many categories and complex classifications, and the operation steps are cumbersome and prone to errors. 3. The text description and graphics of the interface functions should be clearly expressed: The “Cancel” and “Back” button text of restaurant A is easily misunderstood. Moreover, the “Change” button and blank space of the beverage ice content are also easily misunderstood, resul- ting in operation errors. In addition, restaurants B and C use only Q.R. codes to redeem e-coupons. However, electronic coupon certificates are divided into two kinds of Q.R. codes and barcodes. When encountering e-coupons in barcodes, the participants quickly get confused. 4. The interface should have appropriate information tips and guidance: In the restaurant C checkout task, 70% of participants left the wrong sensing location when swiping their credit card to pay. In the task of redeeming e-coupons, three fast food restaurants all had the problem that the participants spent time looking for the scanning place. The location prompt of the hardware device was not obvious, which was also one of the reasons for the high error rate. In addition, after scanning the e- coupon, the interface lacks the prompt of “Successful Redemption” and the participants need to confirm whether the scan is successful, which also prolongs the operation time.
5. Orders in the interface should be editable and customizable: In editing orders at restaurants B and C, it is impossible to directly make meal changes based on existing orders, which is inconvenient. 73% of the respondents think that it is essential to meal customization.
It is worth optimizing how to guide consumers to operate the self-ordering kiosk quickly and correctly through the interface design and easily complete ordering, modifying, and even customizing meals. The future interface design should aim at fast and accurate operation and an intuitive and smooth user experience to improve the efficiency of the self-ordering kiosk.
REFERENCES
Collier, J. E., & Kimes, S. E. (2013). Only if it is convenient: understanding how convenience influences self-service technology evaluation. Journal of Service Research, 16(1), 39–51. Dabholkar, P. A. (1996). Consumer evaluations of new technology-based self-service
options: An investigation of alternative models of service quality. International Journal of Research in Marketing, 13, 29–51. Dabholkar, P. A., Bobbitt, L. M., & Lee, E-J. (2003). Understanding consumer motivation and behavior related to self-scanning in retailing. International Journal of Service Industry Management, 14(1), 59–95. foodNEXT (2021). “Digitalization” of fast food changes the traditional ordering
logic and breaks through the limitations of the physical environment! Lee, H. J., Cho, H. J., Xu, W., & Fairhurst, A. (2010). The influence of consumer traits and demographics on intention to use retail self-service checkouts. Marketing Intelligence & Planning, 28(1), 46–58. Meuter, M. L., Ostrom, A. L., Roundtree, R. I., & Bitner, M. J. (2000). Self-service
technologies: understanding customer satisfaction with technology-based service encounters. Journal of Marketing, 64, 50–64. Meuter, M. L., Ostrom, A. L., Roundtree, R. I., & Bitner, M. J. (2003). The Influence of Technology Anxiety on Consumer Use and Experiences with Self-Service Technology. Journal of Business Research, 56, 899–906. Turner, J. J., & Borch, K. (2012). Store and satisfaction: An analysis of customer
perceptions of self-scan checkouts. Journal of Marketing at Retail, 1(2), 6–16. Yulia Vakulenko, Pejvak Oghazi, Daniel Hellström (2019). Innovative framework for self-service kiosks: Integrating customer value knowledge. Journal of Innovation & Knowledge, 4, 262–268. Website: https://www.foodnext.net/news/industry/paper/5357627591
LISTED IN THE AHFE DIGITAL BOOKSTORE CATALOGUE
Explore the complete digital volume
Usability and User Experience
Read this individual research paper free through the original publisher, or explore the full digital proceedings book.
ISBN 978-1-958651-86-5
Explore this ISBN in the AHFE Bookstore ↗Listed in the July 2026 bookstore catalogue; search by ISBN to confirm current availability · Digital book purchase optional