Po Jen Yang, I Wen Yen, Meng-Cong Zheng (2022). User Experience Study on Self-Checkout System of Hypermarkets in Taiwan. In: Usability and User Experience. AHFE Open Access, vol. 39, pp. 51–57. https://doi.org/10.54941/ahfe1001690
In recent years, many hypermarkets have introduced self-checkout technology. The introduction of new technology is meant to provide a better experience for consumers and reduce the workload of store staff. However, the fact that a few extra staff members are still required to assist consumers in the self-checkout process reflects that consumers still have doubts about the service quality.In this study, 30 subjects who had never used self-checkout were invited to conduct task experiments on the machines at the two large hypermarkets in Taiwan. The assessments included (1) Functional Sequence: to understand the difference between the expected operation process and the actual one, (2) Task Operations: including membership login, scanning of different packaged products, electronic receipt registration, and payment checkout, with the operating time recorded throughout the experiment, (3) to understand the difference between the two self-checkout Systems in terms of interface functions and evaluation by using System Usability Scale (SUS), NASA-TLX and semi-structured interview.It was found that incorrect operation of the payment devices occurred in both machines of the two hypermarkets. The prompts from the system interface were not effective in helping the subjects to operate the machines smoothly. We found that (1) The interface of the hypermarket A was laid out with both illustrations and function buttons, resulting in 73% of the subjects failing to distinguish the difference between the two types of information and causing incorrect operation and failure to find the device; (2) The interface of the B market uses the photo prompt information; 60% of the test subjects ignore the photo, and the interface information cannot effectively assist the test subjects to operate; (3) The design of the machine uses a vertical screen (24" for both machines) and a full-page layout interface, which makes it easy for the test subjects to ignore the buttons, prompts, and hardware devices located in the corners of the interface when operating at close range.Moreover, the SUS of the machines in the two hypermarkets were 74.66 (C level) and 51.83 (F level) respectively, and neither of them could meet the operational requirements. This study found that when the test subjects operated the machines for the first time and faced with the queue of people, their mental stress level and error rate increased. The future interface design of the system should strive for precise operation and information understanding within a short period of time.
Self-service technologies (SSTs) are defined as the interface between techno- logy and services that can serve consumers without the direct involvement of employees (Oyedele & Simpson, 2007, Meuter et al., 2000). In recent years, retailers have increasingly introduced self-service technologies into the retail environment to improve the quality of consumer purchases and the traditio- nal manual checkout process (Arnfield, 2014, Yang et al., 2012, Jamal, 2004, Burke, 2002, Merrilees & Miller, 2001). For consumers, self-service offers convenience and autonomy and saves queuing time (Collier & Kimes, 2013, Turner & Borch, 2012, Leeetal, 2010, Dabholkar et al. 2003, Meuter et al. 2000). Previous studies have found that consumers prefer self-service techno- logy over traditional services because it is more convenient and avoids contact with service personnel (Dabholkar 1996, Meuter & Ostrom et al. 2003).
The AEON Group is the first retailer in Asia to introduce self-service tech- nology applications. AEON began its experimental introduction in 2003, fol- lowed by the development and introduction of other companies. According to Digital Times, the AEON Group has installed about 3,000 self-checkout machines in its stores across Japan in 2015. The number of kiosks across Japan has increased by 139% from 2009 to 2013.
In Taiwan, Carrefour Taiwan accelerated the installation of self-checkout machines in 2019 and has already introduced them to 66 Carrefour stores
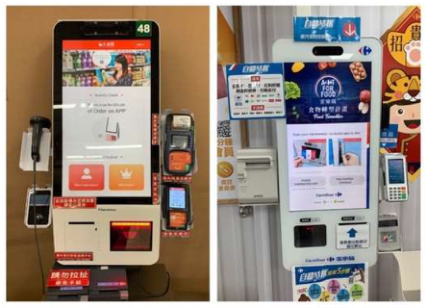
Figure 1: Self-checkout machine in store A (Left), Self-checkout machine in store B (Right).
and 58 convenience stores. RT-MART and A-mart have also introduced new self-checkout facilities.
The increasing number of self-checkout machines in the retail industry has changed the way many consumers used to check out. However, consumers have a wide range of individual differences and familiarity with the system, making it difficult for first-time users to quickly understand and complete the process on their own. According to a study by retail technology company Tensator (2013), 84% of consumers require assistance from store associates when using self-checkout, while 60% actually prefer traditional staff che- ckout, leading to the current trend for the hypermarkets to deploy service staff at self-checkout kiosks to help consumers get familiar with and adapt to the new technology.
This study evaluated the usability of self-checkout machines in the two hypermarkets in Taiwan, including hardware operation and display of software interface information.
METHODS
The kiosks in the two major hypermarkets, A and B (see Figure 1), were used as the study subjects in this study. Both hypermarkets adopt 24-inch ver- tical screens with additional barcode scanners, statement printers, EasyCard sensors, and credit card machines with different functions around the screens.
The difference lies in the fact that Store A uses more illustrations for its interface prompts, while Store B uses photos and text for its interface prompts.
We invited 30 subjects who had never used a self-checkout machine before to conduct the task experiment, including 15 subjects in store A and 15 in store B. Before the tasks, the subjects were asked to use the function cards based on their past checkout experience or imagination for sorting to see the difference between the operational flow expected by the test subjects and the actual one.
User Experience Study on Self-Checkout System of Hypermarkets in Taiwan 53
Table 1. Task performance for the two stores.
Table available in the original PDF paper.
Store A Task 1 Task 2 Task 3 Task 4 Total duration Average time 28.79 s 35.59 s 22.26 s 31.25 s 117.91 s SD 14.47 10.15 9.72 10.32 28.89 Error rate 2% 13% 26% 66%
Store B Task 1 Task 2 Task 3 Task 4 Total duration Average time 27.29 s 69.69 s 39.66 s 28.09 s 164.75 s SD 11.30 37.61 18.53 12.07 44.15 Error rate 33% 46% 66% 60%
Equations and mathematical formulas are available in the original paper PDF.
This experiment required the subjects to complete four tasks, the entire operation time and their movements were recorded with a camera. Tasks included: (1) Member confirmation: Login with your cell phone number. (2) Product scan: Scan 5 products in different packaging (bottled water, bag- ged snacks, stationery, fresh fruits, cleaning products) and confirm the product details on the interface. (3) Receipt setup: From the 6 different receipt options (deposit to member account, direct print paper receipts, donation receipts, etc.), select the option for mobile e-receipts and complete the registration. (4) Payment checkout: Select the Pay by Credit Card button and find the correct credit card machine among the various hardware devices around the machine to complete the payment.
After completing the task, the participants were asked to fill out the SUS (System Usability Scale), the NASA-TLX questionnaire, and finally, a semi- structured interview was conducted. Then, the differences between the two types of self-checkout machines in terms of interface functions and evaluation were identified for future reference in design improvement.
RESULT & DISCUSSION The results indicated that in terms of total operation time, Store B (M = 164.75s, SD = 44.15) was longer than Store A (M = 117.91s, SD = 28.89), with a significant difference (P = 0.02<0.05). In task 2, “pro- duct scans”, the average time in Store B (M = 69.69s, SD = 37.61) was longer than that in Store A (M = 35.59s, SD = 10.15), with a significant dif- ference (P = 0.02<0.05). During the experiment, item registration exceptions happened to 7 people in Store B, resulting in longer operation time. The fre- quent operation errors increased the operation time and psychological stress (see Table 1).
In Task 3, “Receipt Setup”, the average time for Sale B (M = 39.66s, SD = 18.53) was longer than that for Sale A (M = 22.26s, SD = 9.72),
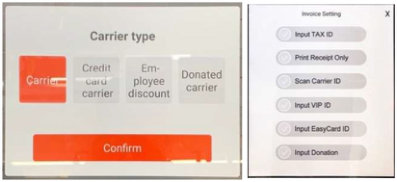
Figure 2: Interface for setting up receipts in Store A (Left), interface for setting up receipts in store B (Right).Figure 3: Illustrations and buttons of the checkout interface of payment in Store A.
with a significant difference (p = 0.04<0.05). The layout of the interface in Store B has 6 gray text buttons. Ten people reported that they could not find the correct option among these buttons due to the ambiguity of the Chinese interface, which made it more difficult to understand. There was no clear distinction in the color of the buttons when clicked (see Figure 2). The layout of the interface in Store A has 4 buttons with simple and easy-to-understand button text, and there is a clear difference in the color of the buttons when clicked.
Regarding the format of the interface, Store A adopted the illustration format and Store B adopted the photo format. The results showed that in both stores, there were cases of incorrect operation and failure to find the correct hardware device. The prompts in the system interface were not effective in helping the subjects operate successfully.
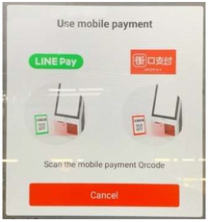
The interface of Store A is laid out with both illustrations and function but- tons (see Figure 3). The interview revealed that 73% of the respondents were unable to distinguish the difference between the two types of information, resulting in incorrect operation and failure to find the hardware device. In task 4, “Payment checkout”, 10 people accessed the wrong hardware device, and 7 of them said they could not find the correct hardware device through the illustration on the interface. All of the subjects clicked on the illustra- tion because they expected the interface to guide them to the correct card machine only to find out that the system did not support the click function (see Figure 4). Three people reported that the interface did not show them the error message when they made a mistake, and the repetitive operation increased the time spent.
User Experience Study on Self-Checkout System of Hypermarkets in Taiwan 55
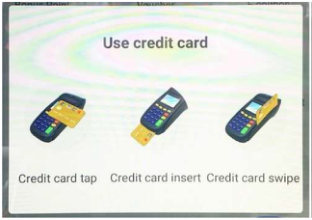
Figure 4: Checkout interface of payment in Store A.Figure 5: Credit card checkout instruction for Store B.
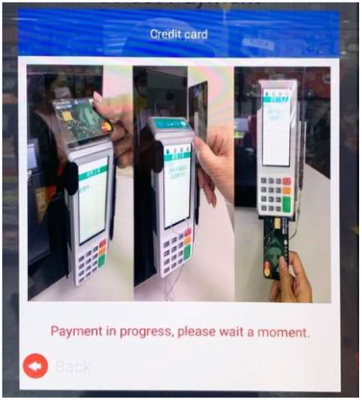
The interface of Store B uses the photo format to prompt information. Interviews revealed that 60% of the respondents did not notice the photo information. The information in photo format was not effective in helping the respondents to get the correct hardware.
In Task 1, “Member Confirmation”, 5 people expressed that they are bew- ildered because the interface contains a lot of text, photos, and advertising images, and the color of the button is gray. The test subjects were disturbed by the photos and text resulting in failure to find the button and incorrect clicks.
In Task 4, “Payment Checkout”, nine people operated the credit card machine incorrectly. All respondents reported that after selecting the credit card payment button, they focused on trying the closest hardware device and ignored the three photos in the interface regarding the location and how to operate the credit card machine (see Figure 5).
As for screen size, both Store A and Store B used 24-inch upright screens. When it comes to operating the kiosk at close range, 26% of respondents
Table 2. The NASA-TLX weighting scores for the two stores.
Table available in the original PDF paper.
Temporal Performance Effort Frustration Total
Mental Demand
Physical Demand Demand
Store A 108.66 25.33 128.33 64.33 44.00 66.33 29.80 SD 88.12 29.78 101.02 84.04 83.54 74.41 17.04 Store B 180.33 17.33 202.66 60.66 79.00 100.66 44.33 SD 99.97 24.84 147.71 53.51 78.40 141.58 23.64
said they did not notice the menu at the bottom of the screen or the surroun- ding hardware. Staff at both stores put a lot of educational prints around the machines. However, most of the respondents chose to ignore them because of the long queues and the fact that reading too much information would increase the operating time and psychological pressure.
The usability of the two stores was examined using the SUS scale. Store A (M = 74.66, SD = 17.08, Rating C), which was better than Store B (M = 51.83, SD = 21.90, Rating F). There was a significant difference (p = 0.004<0.05). The interface of the two stores’ self-checkout machines cannot fully meet the operational requirements and there is still room for improvement.
The NASA-TLX weighting scores (see Table 2) showed no significant dif- ference (p = 0.065>0.05) between the total scores of Store A (M = 29.80, SD = 17.04) and Store B (M = 44.33, SD = 23.64). The Mental Demand subscale showed a significant difference (P = 0.047<0.05) between Store A (M = 108.66, SD = 88.12) and Store B (M = 180.33, SD = 99.97). The results of the interviews indicated that with the multiple hardware devices installed in the self-checkout machines, the interface information was not effective in helping the test subjects understand how to operate the machines. As a result, a higher level of mental effort was required.
The Temporal Demand subscale showed that Store A (M = 128.33, SD = 101.02) and Store B (M = 202.66, SD = 147.71) were the highest among all NASA-TLX subscales. The results of the interviews indicated that the perceived length of time was longer than the actual operation time when the queue was gcrowing.
CONCLUSION
This study helps to understand whether the interface and process prompts of self-checkout services in the two hypermarkets in Taiwan are easy to follow and operate for first-time consumers. The study finds that the illustration- based interface does not effectively help consumers locate the corresponding physical device. It easily confuses users with the functional interface compo- nents and causes operational errors. The photo-based instructional interface contains a large amount of information, which is easily ignored by the test subjects and does not achieve the effect of hints. The lack of eye-catching
User Experience Study on Self-Checkout System of Hypermarkets in Taiwan 57
colors of the function buttons or feedback prompts increases the error rate and operation time, and increases the mental strain on consumers. The ini- tial experience affects consumers’ willingness to choose a kiosk next time. Only 46% of all respondents said they would be willing to try a kiosk again next time. The fact that customers still had to seek assistance from the two associates dispatched to the store in case of an error is the main reason for preferring manual checkout, in line with Tensator’s findings. The findings of this study are useful for understanding the relationship between the content of the interface of the kiosk and the consumer’s operation in the hypermar- ket. It is worthwhile to consider how to effectively guide consumers to operate the software system and hardware devices through the interface presentation, and to complete the checkout process easily. The future design of the interface should aim at short and precise operation and easy access to information to enhance the efficiency of self-checkout.
REFERENCES
Arnfield, R. (2014). Supermarket self-checkout technology approaching tipping point? Kioskmarketplace. Burke, R. R. (2002). Technology and the customer interface: What consumers want
in the physical and virtual store. Journal of the Academy of Marketing Science, 30(4), 411–432. Dabholkar, P. A. & Bagozzi, R. P. (2002). An attitudinal model of technology-based self-service: moderating effects of consumer traits and situational factors. Journal of the Academy of Marketing Science, 30(3), 184–201. Dabholkar, P.A.,(1996), “ Consumer Evaluations of New Technology-Based Self-
Service Options: An Investigation of Alternative Models of Service Quality.”, International Journal of Research in Marketing, 13, 29–51. Jamal, A. (2004). Retail banking and customer behaviour: A study of self-concept, satisfaction and technology usage. International Review of Retail, Distribution and Consumer Research, 14(3), 357–379. Merrilees, B., & Miller, D. (2001). Superstore interactivity: a new self-service
paradigm of retail service. International Journal of Retail and Distribution Management, 29(8), 379–389. Meuter, M. L., Ostrom, A. L., Roundtree, R. & Bitner, M. J. (2000). Self-service technologies: understanding customer satisfaction with technology-based service encounters. Journal of Marketing, 64(3), 50–64 Meuter, M.L. , A. L. Ostrom, M. J. Bitner, and R, Roundtree ,(2003) , “The Influ-
ence of Technology Anxiety on Consumer Use and Experiences with Self-Service Technology,” Journal of Business Research, 56, 899–906. Oyedele, A., & Simpson, P. M. (2007). An empirical investigation of consumer control factors on intention to use selected self-service technologies. International Journal of Service Industry Management, 18(3), 287–306 Tensator (2013). Tensator survey reveals shoppers’ self-service frustration Tensator
Website: https://www.tensator.com/tensator-survey-reveals-shoppers-self-service-frustrati on/ Yang, Y-C., Liu, S-W., & Ding. M-C. (2012). Determinants of self-service technology adoption. African Journal of Business Management, 6(40), 10514–10523.
LISTED IN THE AHFE DIGITAL BOOKSTORE CATALOGUE
Explore the complete digital volume
Usability and User Experience
Read this individual research paper free through the original publisher, or explore the full digital proceedings book.
ISBN 978-1-958651-15-5
Explore this ISBN in the AHFE Bookstore ↗Listed in the July 2026 bookstore catalogue; search by ISBN to confirm current availability · Digital book purchase optional