Krystyna Gielo-Perczak, Riley McNaboe, Hugo Posada-Quintero (2024). Evaluation of Patient Stress During Mammograms through Surface Electromyography Analysis. In: Healthcare and Medical Devices. AHFE Open Access, vol. 130, pp. 93–103. https://doi.org/10.54941/ahfe1004842
Regular mammograms are recommended for women to allow for early detection of breast cancer and in turn, proper treatment and improved prognosis of patients. However, the stress and discomfort associated with the procedure deter many women from routine screening. Most previous work attempting to characterize this pain utilizes subjective, questionnaire-based methods. The variability in methodology and subjectivity of these approaches requires a more objective strategy to fully understand mammogram related stress. Bio signals such as surface electromyography (sEMG) have been increasing in popularity as a means of quantifying various physiological states including stress and pain. This research presents the use of sEMG as a means of measuring the stress and discomfort experienced by biological females during a mammogram. N=25 healthy subjects were recruited to participate in a simulated procedure consisting of two different variations in machine design (compression paddle shape). Wearable sEMG sensors were placed on 14 different muscles and a multi-metric analysis was conducted to observe muscle activation and estimated stress between a relaxed state and the compressions of the procedure. Significantly activated muscles during the painful mammogram include the deltoid, infraspinatus, teres major, and trapezius upper fibers shown by the most responsive metrics derived. The illustration of intense activation of these muscles during the procedure along with the proposed bio signal analysis methodology can aid in advancing ongoing research and clinical efforts to make mammograms more comfortable and less stressful for patients by providing a more comprehensive understanding of the stress experienced.
Breast cancer is the most common type of cancer worldwide. In 2020 alone, 2.26 million people received a new breast cancer diagnosis and 685,000 women died of existing cases (“Breast cancer,” n.d.). The disease is the result of abnormal cell growth in the breasts which when left unchecked can metas- tasize to other parts of the body, potentially becoming fatal. Early detection is one of the most effective ways to limit its impact as the earlier it is detected, the sooner treatment can be started. Mammography is the primary method used to detect the presence of cancerous growth but is a painful process that
discourages preventive screening (Fayanju et al., 2014). While verbal feed- back has provided a good understanding of the discomfort intrinsic to the current procedure, a more objective picture of the process can provide addi- tional insight on the suffering associated with the operation and aid in future improvements to the process, ultimately improving breast cancer screening access and survival rates.
Mammography consists of taking a low-dose X-ray of the patient’s breast as it is tightly compressed. Such compression allows for improved images of the breast, a complete view of the tissue, and limits exposure to radiation (Keefe et al., 1994). To achieve the ideal compression for imaging, the patient is passively positioned by the mammogram technologist in an awkward and unnatural posture. First, the chest is firmly pressed against the imaging table below the breasts. Subsequently, the head is rotated, twisting the neck to a near maximum while an arm is simultaneously extended to a gripping han- dle which results in the torsion of the back and side muscles. Similarly, to maintain balance and stillness, the shoulder muscles are flexed. This in con- junction with the pulling of breast tissue during compression along with the simultaneous holding of one’s breath results in unpleasant pain and stress for the participants, especially with respect to their muscle tissue. It is generally agreed upon through past research that the procedure is a painful experience, a characteristic that commonly discourages women from participating in the preventive screening process (Fayanju et al., 2014). Most previous work has focused on self-reported pain values and subjective measures of stress and/or discomfort in the muscles being strained, both being metrics which can vary widely and have proven inaccurate in many settings (Kemp et al., 2012). A possible means of measuring such states to provide further insight with- out any associated biases is through the collection and analysis of various biophysical signals.
Surface electromyography (sEMG) noninvasively measures changes in voltage potential from the skin that result from the stimulation of muscle by the nervous system (Luca, 1997). Being both non-invasive and informa- tive, sEMG is an ideal candidate for biometric analysis of the mammogram process as it can illustrate the origin of related discomfort and provide more information to help improve the device design as well as the patient-machine interface.
In this study we developed a comprehensive sEMG analysis of various muscles during a mammogram to quantitatively measure the discomfort of women throughout the procedure. The suitability of using sEMG to evaluate modifications to the design of the mammogram device was simultaneously analyzed. Various indices from the collected sEMG data were derived, each of which presented specific characteristics of the waveform but together, present an intuitive summary of the muscular response to the procedure. The metrics were then interpreted within the context of the mammogram. sEMG activity was compared between relaxed and compressed (stressed) states as well as between paddle design types. Finally, we performed statistical analysis on the data to further interpret the collected results. To the best of our knowledge, this is the most complete analysis of mammography using sEMG signals, emphasizing a multimeric, full body assessment.
Evaluation of Patient Stress During Mammograms 95
PREVIOUS WORK Mammography is not a new topic in research. Through the exclusive use of surveys, many studies indicate women are exposed to pain at some sever- ity because of the compression of breasts, pulling of skin, and/or general positioning (Nielsen et al., 1991; Sapir et al., 2003; Sharp et al., 2003). Addi- tionally, other groups have found that the pain and discomfort associated with the procedure significantly impact re-screening rates/attitudes (Elwood et al., 1998; Fayanju et al., 2014). It is important to note that some studies have not found as significant results as pain scores can also be low amongst sampled populations (Gosein et al., 2014; Moshina et al., 2020). This fluc- tuation can be explained by the specific pain scale implemented (Kornguth et al., 1996). While it is undeniable that the procedure is a painful experi- ence for many women, the variation in reported pain and discomfort values across different studies shows that there is no consensus about the ideal methodology utilized to accurately quantify the patient experience.
Past work has explored the use of bio signal-based metrics as an objec- tive measure of pain when subjective measures fall short in many different fields (Cascella et al., 2023; Jebelli et al., 2018; Posada-Quintero et al., 2020). There is limited publicly available research implementing such an analysis to understand the burden of mammography on the patient. One exception includes the work done by Uchiyama et al., 2012. The group collected sEMG from women undergoing mammograms to understand the activity of four muscles during mediolateral oblique mammogram position- ing to observe the reality of the physical burden as well as the subjective pain associated with the procedure. Analysis demonstrated significant increases of integrated EMG (iEMG), a metric indicative of the area under the rectified sEMG signal, from baseline to compression states along with simultaneous increases in reported VAS scores. They demonstrated the ability to use sEMG to accurately measure muscle activation and indicate associated pain during mammograms.
MATERIALS AND METHODS
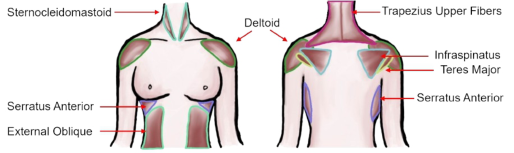
Muscle Selection Many muscles are involved in the positioning required for a mammogram as described earlier. In total, 14 different relevant muscles were selected in the proposed study (Figure 1). They include the left and right sternocleido- mastoid, trapezius upper fibers, serratus anterior, external oblique, deltoid, infraspinatus, and teres major muscles.
Figure 1: The muscles selected for analysis during mammogram simulation. Includes both left and right components of each muscle pair.
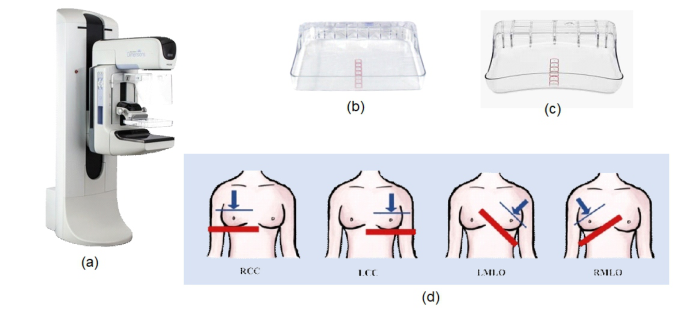
Equipment To simulate the mammogram procedure as accurately as possible, we uti- lized the 3DimensionsTM Genius Mammography System from Hologic Inc. (Marlborough, Massachusetts) as seen in Figure 2a. The X-ray capabilities of the machine were disabled while all other functionalities of the machine were maintained. To compare the subject’s discomfort through muscular acti- vation in response to variations in the design of the machine, two different paddle types were utilized throughout the study. These consisted of a flat paddle (Figure 2b) as well as the SmartCurveTM Breast Stabilization Paddle (Figure 2c) (“SmartCurve® Breast Stabilization System | Hologic,” n.d.).
Wearable Trigno/Avanti EMG sensors from Delsys Inc. along with Del- sys Acquisition software (Natick Massachusetts) were utilized to acquire the sEMG signals from the subjects. Four different sensors were used: Avanti, Avanti Duo, Trigno, and Trigno Mini. Sensors were sampled at 1925.925 Hz.
Figure 2: (a) 3Dimensions™genuis mammography system; (b) flat paddle; (c); smartcurveTM breast stabilization paddle; (d) four different positions of the breast for the simulated mammogram. Blue line/arrow indicates paddle and direction of com- pressive force respectively. Red line indicates imaging table. RCC: right craniocaudal; LCC: left craniocaudal; LMLO: left mediolateral oblique; RMLO: right mediolateral.
Protocol All the procedures were approved by the Institutional Review Board (IRB) for human subject research at the University of Connecticut (Protocol #: H20-0146). Twenty-five healthy female volunteers of ages ranging from 40 to 67 years old (avg. 50.84 +/−8 years) years old were enrolled in this study. Subjects gave consent after reviewing the subject protocol approved by the IRB.
The subjects were equipped with an array of the wireless sEMG sensors on the 14 different muscles described earlier. The skin at all the electrode locations was cleaned with a 70% isopropyl alcohol prior to the placement of any device.
An initial EMG control recording (C1) was taken in a large, brightly lit room during which the subject stood still in a relaxed position facing
Evaluation of Patient Stress During Mammograms 97
forwards. This recording as well as all subsequent sEMG recordings lasted 15 seconds. Upon completing the initial control, the participant was guided into the smaller, room that housed the Hologic Mammography system where another control recording (C2) was taken.
The team then initiated the mammogram portion of the protocol. The staff member assigned to position the breast for the compression previ- ously completed a mammography technologist certification course to ensure proper handling of the patient as well as provide a realistic simulation expe- rience. The same order of compressions used in the healthcare field (seen in Figure 2d and summarized in Table 1) was implemented in the proto- col, taking the following order: 1) right CranioCaudal view (RCC); 2) left CranioCaudal view (LCC); 3) left MedioLateral Oblique view (LMLO); 4) right MedioLateral Oblique view (RMLO). As two different paddle types were being evaluated, four compressions were first completed with the flat paddle followed by another four with the curved SmartCurveTM Hologic Paddle. The EMG recording was collected during the simulated imaging portion of the procedure in which the breast is fully compressed. The sub- ject was required to remain still while holding their breath as traditionally done to maximize image quality. An additional control recording (C3) was taken after completing the first set of four compressions as the paddle was being changed.
Table 1. Summary of study procedure.
Table available in the original PDF paper.
Activity/Compression Paddle Type Event Abbreviations
- Control – Large room C1 - Control – Small room C2 Flat Right CranioCaudal compression F_RCC Flat Left CranioCaudal compression F_LCC Flat Left MedioLateral Oblique compression F_LMLO Flat Right MedioLateral Oblique compression F_RMLO - Control – Small room C3 Curved Right CranioCaudal compression C_RCC Curved Left CranioCaudal compression C_LCC Curved Left MedioLateral Oblique compression C_LMLO Curved Right MedioLateral Oblique compression C_RMLO
EMG SIGNAL PROCESSING AND DATA ANALYSIS The EMG activity at each stage of the protocol (15s) was compared using temporal and frequency-based metrics. Prior to their derivation, 1.5 seconds were removed from both the beginning and end of each EMG recording seg- ment to avoid fringe artifacts and noise. The resulting 13 second segment was then filtered with a bandpass filter (4th order Butterworth with cut-off frequencies 20–500 Hz). Each segment was normalized with respect to the control state.
Table 2. Summary of metrics implemented in the study.
Table available in the original PDF paper.
Metric Summary Temporal Mean RMS (meanRMS) Root of average value of the squared normalized EMG Standard deviation of RMS(stdRMS)
Standard deviation of the RMS feature – how much signal varies from its mean Slope sign change (SSC) The number of times that the slope of EMG waveform changes sign Zero crossing count (ZZC)
The number of times the signal crosses the line y = 0 given a threshold Waveform length (WFL) Measure of the cumulative length of EMG signal – indicative of signal amplitude, frequency and duration Frequency Mean Frequency (meanFreq)
Extracted mean frequency from sEMG power spectrum Median Frequency (medianFreq)
Extracted median frequency from sEMG power spectrum Entropy (ENT) Measure of the uncertainty of the signal power distribution in frequency domain Drop in power (DP) Compares highest/lower mean power – indicative of frequency shifts Spectral Deformation (specDef)
Compares the spectral moments of the power spectrum – indicative of changes in peak of power and its symmetry
Five time-domain metrics and five frequency-domain metrics were selected to analyze the EMG activity during each state of the protocol. They are sum- marized in Table 2. The use of these metrics has been widely implemented in studies which similarly aim to quantify stress, pain or fatigue using EMG (Allison and Fujiwara, 2002; Oliveira et al., 2014; Phinyomark et al., 2013; Pourmohammadi and Maleki, 2020; Wijsman et al., 2010).
Statistical Analysis The differences between control and compressive states were evaluated. This comparison is meant to detect the sensitivity of the measure to changes in EMG activity from a control state to a compressed state (ex. C2 vs. F_RCC). Additional analysis compared paddle types for the same kind of compression. A paired t-test was used to find the statistical relationship between every combination of these relationships for all metrics implemented. The resulting p values were corrected using Bonferroni’s correction n = 112 accounting for number of muscles and interventions being compared for each metric.
RESULTS
For every muscle, the mean and standard deviation was calculated, and sta- tistical difference was noted (p<0.05 w/ correction n = 112) for every metric during all 8 compressions using the respective control as reference (deltoid
Evaluation of Patient Stress During Mammograms 99
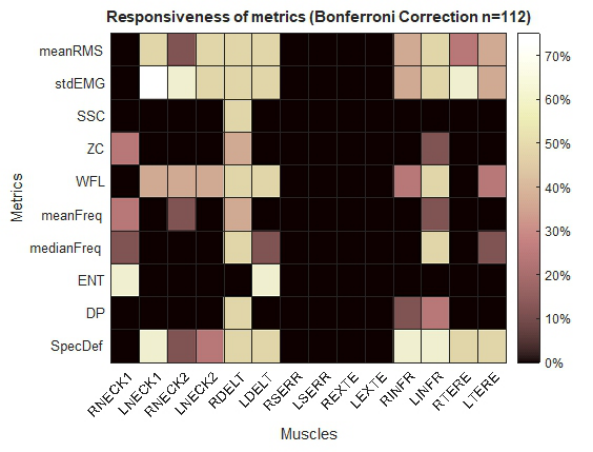
pair calculations shown in Table 3). To identify the muscles and features that showed the most response from control to compression states, the relative responsiveness is displayed in Figure 3. The percentages represent the number of compressions that showed a statistical difference for each muscle out of the total 8 compressions involved in the procedure. Both the left and right deltoid and infraspinatus muscles showed consistent differences between rest and compression for meanRMS, stdEMG, WFL, meanFreq, medianFreq, DP and SpecDef. The left/right trapezius upper fibers and teres major also showed similar differences in meanRMS, stdEMG, WFL, and SpecDef. Both the ser- ratus and external oblique showed no significant effect from the compression across all the metrics. Highly responsive metrics include meanRMS, stdEMG, WFL, meanFreq, medianFreq, and SpecDef. It is worth emphasizing that meanRMS, stdEMG, and WFL are all highly correlated. The same is the case for meanFreq and medianFreq. The subjects reported VAS pain ratings for their previous experiences on average when completing the intake question- naire which range from 1–9 (mean 5.56 +/−2.14). After completion of the study, they again reported a VAS pain rating with respect to the simulated procedure which range from 1–5 (mean 2.16 +/−1.16).
Table 3. Results for left and right deltoid across 4 selected metrics for flat paddle only.
Calculated meanRMS, stdEMG, medianFreq, and SpecDef metrics for all compressions and control 2. Val- ues presented as mean / standard deviation. * Indicates significant difference between state and respective control (C2 for flat paddle) with p-Value less then 0.05 (Bonferroni correction n-112). Values contained within parenthesis are the lower for a given state between paddle types [ex. (C_RCC) < F_RCC for meanRMS Left Deltoid].
It is important to note that the responsiveness percentages in Figure 3 con- sider the muscles reaction to both left and right breast compressions. The distinction between the two’s performance is clarified in Table 3. In this case, the calculated statistics for the left/right deltoid pair are displayed as it was the most reactionary muscle pair for most of the metrics. Across the four unique metrics were included, the left deltoid detected a difference more fre- quently for left breast compressions (flat: 7/8 instances; curved: 6/8 instances) whereas the right deltoid noted a difference mostly for right breast compres- sions (flat: 8/8 instances; curved: 8/8 instances). No statistical difference was found when comparing the metrics from flat-paddle compressions to their corresponding curved-paddle compressions.
DISCUSSION
In this study, we collected sEMG from 14 different muscles believed to be stressed during mammograms. This is one of the only studies to analyze sEMG activity of multiple muscles during the complete procedure.
Unlike previous studies, 10 EMG-based metrics were used to characterize the signal activity during the control and compressive states. Out of the 10 metrics, six frequently detected differences between the control and compres- sive states. MeanRMS, stdEMG, medianFreq, and SpecDef are four of these are six that are largely disjointed and in turn, each uniquely corroborate the observed activation of various muscles while the breast is compressed. These findings are similar to the performance of the same metrics in related studies (Allison and Fujiwara, 2002; Phinyomark et al., 2012; Wijsman et al., 2010). There is no previous work that has utilized these same metrics in muscle analysis for mammogram procedures.
Figure 3: Percent of compressions that showed a statistical difference between control and compression for each muscle across all metrics. Displayed as a percent out of the total number of compressions, n = 8. (R: right; L: left; NECK1: sternocleidomastoid; NECK2; trapezius upper fibers; DELT; deltoid; SERR; serratus anterior; EXTE; external oblique; INFR: infraspinatus; TERE: teres major.).
In this study, the deltoid, infraspinatus, teres major and trapezius upper fibers are four of the muscle pairs that frequently show activation. The loca- tion of the muscles, especially the first three, and their high engagement levels can be attributed to the strained torsion of the upper torso. Notably, the external obliques do not indicate frequent activation in comparison to their nominal state as might be expected in the twisted stance. This relation- ship further demonstrates the uncomfortable nature of the positioning. The lower torso is not allowed to rotate as the chest needs to remain parallel with
Evaluation of Patient Stress During Mammograms 101
the imaging table, but the shoulders are pulled away as the patient’s arms engage with the side of the machine. The restrictive essence of the procedure is highlighted by the combination of activated/inactive muscles during the compressions.
As expected, there was an inherent lateral bias in the muscle activation depending on which breast was being imaged. The breast being images in turn dictates the location of the muscular tension in the upper torso muscles, isolating the strain to one side in this group of muscles. This indicates the measurement methodology can distinguish between the lateral variance in compressions.
The reported score for the pain during the simulated mammogram was less than the score the participants assigned to their previous experiences. As the study did not take any image of the breast, the normal, large compressive force was not required. The standard force ranges from 100-140N (Moshina et al., 2020) whereas the range of forces implemented in the study range between 18.25-71.60N.
Neither paddle consistently provoked a significantly lower or higher EMG response then the other for any of the metrics. This indicates that the pro- posed study methodology in its current form is not sensitive enough to detect major variations in machine design. More work can be done to further refine the use of EMG in detecting paddle design differences.
Limitations While the mammogram system that was utilized is similar to most styles of machines, every brand has its own features which can slightly impact the user interaction and in turn, derived sEMG signals. Although efforts were made to replicate a clinical space, as the study was not conducted in a hospital setting, environmental stressors were not prevalent which could also have affected the true stress response. An effort should be made to modify future protocols wherever possible to limit these constraints.
CONCLUSION
This study collected sEMG signals from 14 different muscles and compared them throughout a simulated mammogram procedure that incorporated two different compression paddle designs. Based on the results, the proposed study methodology verifies the potential of using sEMG analysis as a founda- tion for the identification and quantification of muscular stress as a result of body positioning for mammograms. Specifically, following trends of mean- RMS, stdEMG, medianFreq, and specDef from the deltoid, infraspinatus, teres major and trapezius upper fibers can provide a semi-complete view into the activity of the upper torso and neck during imaging. This insight into the manifestation of such discomfort can aid in developing a more friendly, painless screening. A more complete multimodal analysis incorporating more signals may be necessary to achieve the resolution necessary to note smaller changes to the machine design such as paddle type and allow for additional conclusions related to stress and pain.
By selectively addressing those aspects of the procedure which induce these responses, efficient and effective improvements can be made to the procedure to reduce the pain and stress that is commonly associated with mammography.
ETHICS DECLARATIONS This study was approved by the University of Connecticut Institutional Review Board (IRB #H20-0146).
ACKNOWLEDGMENT
The authors would like to acknowledge Hologic Inc for their generous sup- port in providing the Hologic 3D Genius Mammography system and related equipment. Additionally, the authors would like to acknowledge Delsys Inc for their sensor support. Finally, The DeLuca Foundation grant for their financial support.
REFERENCES
Allison, G. T., Fujiwara, T., 2002. The relationship between EMG median frequency and low frequency band amplitude changes at different levels of muscle capac- ity. Clin. Biomech. Bristol Avon 17, 464–469. https://doi.org/10.1016/s0268- 0033(02)00033-5 Breast cancer [WWW Document], n.d. URL https://www.who.int/news-room/fact-s
heets/detail/breast-cancer (accessed 11.22.23). Cascella, M., Vitale, V. N., D’Antò, M., Cuomo, A., Amato, F., Romano, M., Ponsiglione, A. M., 2023. Exploring Biosignals for Quantitative Pain Assessment in Cancer Patients: A Proof of Concept. Electronics 12, 3716. https://doi.org/10. 3390/electronics12173716 Elwood, M., McNoe, B., Smith, T., Bandaranayake, M., Doyle, T. C., 1998. Once
is enough—why some women do not continue to participate in a breast cancer screening programme. N. Z. Med. J. 111, 180–183. Fayanju, O. M., Kraenzle, S., Drake, B. F., Oka, M., Goodman, M. S., 2014. Perceived barriers to mammography among underserved women in a Breast Health Center Outreach Program. Am. J. Surg. 208, 425–434. https://doi.org/10.1016/j.amjsur g.2014.03.005 Gosein, M. A., Pereira, S. M. P., Narinesingh, D., Ameeral, A., 2014. Breast Can-
cer and Mammography: Knowledge, Attitudes, Practices and Patient Satisfaction Post-mammography at the San Fernando General Hospital, Trinidad. J. Health Care Poor Underserved 25, 142–160. Jebelli, H., Choi, B., Kim, H., Lee, S., 2018. Feasibility Study of a Wristband- Type Wearable Sensor to Understand Construction Workers’ Physical and Mental Status. https://doi.org/10.1061/9780784481264.036 Keefe, F. J., Hauck, E. R., Egert, J., Rimer, B., Kornguth, P., 1994. Mammogra-
phy pain and discomfort: a cognitive-behavioral perspective. Pain 56, 247–260. https://doi.org/10.1016/0304-3959(94)90163-5 Kemp, J., Despres, O., Dufour, A., 2012. Unreliability of the visual analog scale in experimental pain assessment: a sensitivity and evoked potentials study. Pain Physician 15, E693-699.
Evaluation of Patient Stress During Mammograms 103
Kornguth, P. J., Keefe, F. J., Conaway, M. R., 1996. Pain during mammography: characteristics and relationship to demographic and medical variables. Pain 66, 187–194. https://doi.org/10.1016/0304-3959(96)03057-6 Luca, C. J. D., 1997. The Use of Surface Electromyography in Biomechanics. J. Appl.
Biomech. 13, 135–163. https://doi.org/10.1123/jab.13.2.135 Moshina, N., Sagstad, S., Sebuødegård, S., Waade, G. G., Gran, E., Music, J., Hofvind, S., 2020. Breast compression and reported pain during mammographic screening. Radiography 26, 133–139. https://doi.org/10.1016/j.radi.2019.10.003 Nielsen, B. B., Miaskowski, C., Dibble, S. L., Beber, B., Altman, N., McCoy, C. B.,
1991. Pain and Discomfort Associated With Film-Screen Mammography. JNCI J. Natl. Cancer Inst. 83, 1754–1756. https://doi.org/10.1093/jnci/83.23.1754 Oliveira, I. M., Machado, A. R. P., Pereira, A. A., Andrade, A. O., 2014. Estimated features from surface EMG of the lower limb correlate with the subjective sensa- tion of pain. Psychol. Neurosci. 7, 355–361. https://doi.org/10.3922/j.psns.2014. 044 Phinyomark, A., Quaine, F., Charbonnier, S., Serviere, C., Tarpin-Bernard, F.,
The Usefulness of Mean and Median Frequencies in Electromyography Analy- sis, in: Computational Intelligence in Electromyography Analysis - A Perspective on Current Applications and Future Challenges. IntechOpen. https://doi.org/10. 5772/50639 Posada-Quintero, H. F., Kong, Y., Nguyen, K., Tran, C., Beardslee, L., Chen, L., Guo, T., Cong, X., Feng, B., Chon, K. H., 2020. Using electrodermal activity to validate multilevel pain stimulation in healthy volunteers evoked by thermal grills. Am. J. Physiol.-Regul. Integr. Comp. Physiol. 319, R366–R375. https://doi.org/10.1152/ ajpregu.00102.2020 Pourmohammadi, S., Maleki, A., 2020. Stress detection using ECG and EMG signals:
A comprehensive study. Comput. Methods Programs Biomed. 193, 105482. https: //doi.org/10.1016/j.cmpb.2020.105482 Sapir, R., Patlas, M., Strano, S. D., Hadas-Halpern, I., Cherny, N. I., 2003. Does Mammography Hurt? J. Pain Symptom Manage. 25, 53–63. https://doi.org/10.1016/S0885-3924(02)00598-5 Sharp, P. C., Michielutte, R., Freimanis, R., Cunningham, L., Spangler, J., Burnette, V., 2003. Reported Pain Following Mammography Screening. Arch. Intern. Med. 163, 833–836. https://doi.org/10.1001/archinte.163.7.833 SmartCurve® Breast Stabilization System | Hologic [WWW Document], n.d. URL https://www.hologic.com/hologic-products/breast-health- solutions/smartcurve-breast-stabilization-system#230548828-1548098823 (accessed 11.27.23). Uchiyama, M., Lee, Y., Sadakata, M., Sayama, M., Tsai, D.-Y., 2012. Measurement of Muscle Activities for Evaluating Physical Burden and Pain during Mammography Positioning. Tohoku J. Exp. Med. 228, 53–58. https://doi.org/10.1620/tjem.228.53 Wijsman, J., Grundlehner, B., Penders, J., Hermens, H., 2010. Trapezius Muscle
EMG as Predictor of Mental Stress. Presented at the ACM Transactions on Embed- ded Computing Systems (TECS), pp. 155–163. https://doi.org/10.1145/2485984. 2485987
LISTED IN THE AHFE DIGITAL BOOKSTORE CATALOGUE
Explore the complete digital volume
Healthcare and Medical Devices
Read this individual research paper free through the original publisher, or explore the full digital proceedings book.
ISBN 978-1-964867-06-9
Explore this ISBN in the AHFE Bookstore ↗Listed in the July 2026 bookstore catalogue; search by ISBN to confirm current availability · Digital book purchase optional