Duc Minh Anh Nguyen, Nguyen Thien Minh Tuan, Kenneth Y T Lim, Hugo Posada-quintero (2024). The use of bespoke wearables to investigate neurological and physiological responses to microclimate stressors in quasi-formal academic contexts. In: Neuroergonomics and Cognitive Engineering. AHFE Open Access, vol. 126, pp. 163–170. https://doi.org/10.54941/ahfe1004749
Climate change caused by anthropogenic environmental pollution has become one of the most pressing issues of our modern world. For instance, heat waves have been shown to seriously impair students’ health and productivity (Lala & Hagishima, 2023). The general problem of climate change has influenced recent research to focus on redesigning and restructuring the living environment to improve human health and productivity. Yet, according to Palme and Salvati (2021), there have been relatively few studies on the relationships between microclimates and human health and emotions. This is particularly detrimental as the in-depth knowledge obtained can be used to enhance human health and productivity, as well as influence their attitude towards the environment (Doell et al., 2023). This paper reports a study conducted by students as an independent research project under the mentorship of a senior research scientist at the National Institute of Education, Singapore. It represents a multidisciplinary, citizen science and neuroergonomic approach to investigate the relationships between human neuro-physiological health and mental well-being. To investigate both physical health as well as stress, low-cost, bespoken wearables were built, such as a mini weather station and physiological wristband. Electrodermal activity (EDA) was also introduced as a non-invasive method to detect stress and emotional arousal (Rahma et al., 2022) and as a marker of sympathetic network activity (Zangróniz et al., 2017). EDA features such as mean of tonic component and TVSymp (spectral powers in specific frequency bands according to Posada-Quintero et al. (2016a; 2016b) and their normalised versions were focused on as they were found to be highly sensitive to orthostatic, cognitive, and physical stress (Posada-Quintero et al., 2020). PPG was also introduced as a second source of data for analysis of stress and emotions, since it is influenced by the cardiac, vascular and autonomic nervous systems, which are all affected by stress. Machine learning models were trained to investigate relationships between emotional arousal, stress and the surrounding environment. To elaborate, climate change might precipitate changes to microclimates to the extent that for those inhabiting these biomes the changes might be detrimental to physical and mental well-being. Therefore, investigating EDA data may unveil hidden relationships as to how microclimate is related to our perception of well-being at a granular level. In this way, the present study builds on prior work (eg, Lim et al., 2022) that documented changes in microclimate on affective states. It is hoped that analyses of EDA and PPG data will further strengthen the emerging model describing the intersections between local microclimate, physiological stress and emotion. In the present study, we apply this paradigm to the use of EDA in the context of students’ scholastic activity. We seek to understand factors influencing the affective states of learners. Our preliminary findings suggest implications for the design of living and studying conditions with respect to the interaction of microclimate and human health and comfort.
This paper reports research that embraced a multidisciplinary framework, focusing on the convergence of environmental factors, human physio- logical health and mental well-being. With an eye toward sustainabil- ity, affordability, and citizen science, DIY physiological wristbands were developed through a citizen science approach to gather Photoplethys- mography (PPG) and Electrodermal Activity (EDA) data. In total, three categories of data were gathered: environmental data, EDA data, and PPG data.
Electrodermal activity (EDA) has been defined as a measure of neurally mediated effects on sweat gland permeability, observed as changes in the resistance of the skin to a small electrical current, or as differences in the electrical potential between different parts of the skin (Critchley and Nagai, 2013). EDA consists of a tonic and phasic component, represented by skin conductance level (SCL) and skin conductance response (SCR), and is closely associated with the stress response and emotional response of humans.
Photoplethysmography (PPG) has emerged as a promising indicator for stress detection, offering a non-invasive and convenient method for mon- itoring physiological changes associated with stress. PPG utilises the mea- surement of blood volume changes in peripheral blood vessels, typically by illuminating the skin with light and detecting the resultant variations in light absorption caused by pulsatile blood flow.
The PPG signal is an excellent indicator of physiological information, since it is influenced by the cardiac, vascular and autonomic nervous systems, which are all affected by stress (Allen, 2007). A study by Peláez-Coca et al. (2020) also highlights the potential of PPG signals in detecting stress-related alterations in cardiovascular dynamics, such as changes in heart rate variabil- ity and arterial stiffness. These findings underscore the utility of PPG as a tool for assessing stress levels and monitoring stress-related physiological changes. Kim et al. (2018) have also concluded that stress and consequently, variation in HRV variables, can be observed via parasympathetic activity, which is characterized by a decrease in the high-frequency band and an increase in the low-frequency band.
PPG sensors are the most explored due to their advantages in miniaturiza- tion and non-invasiveness. As stated in the work of Rinella et al. (2022), a healthy heart possesses the ability to swiftly change its rhythm non-linearly in response to abrupt physical and psychological demands encountered in an unpredictable and dynamic environment. They also suggested that oscilla- tions of heartbeat reflect the regulation of autonomic balance, blood pressure (BP), gas exchange, gut, heart, and vascular tone.
As argued in preceding paragraphs, changes in climate can affect individ- uals both physiologically and psychologically. Since collecting PPG and EDA data is non-invasive and sustainable, they are a viable choice for reliable and accurate assessment of human stress and emotions.
The Use of Bespoke Wearables to Investigate Neurological and Physiological Responses 165
METHODOLOGY
Collecting Photoplethysmography (PPG) and Electrodermal Activity (EDA) Data In this study, DIY physiological wristbands were designed and built from a citizen science approach. The EDA circuit was designed based on the hard- ware description as detailed in Zangróniz et al. (2017). The input voltage is 3.3V from Arduino Nano which is the microcontroller used for the cir- cuit. The sampling rate of EDA sensor is 10 Hz. For the PPG sensor, a pre-assembled sensor model was used: xd-58c, with extension wire to be fixed on the user’s finger. The sampling rate of PPG sensor is 50 Hz. The device was designed to be worn on the wrist of the user. The device also has a battery which lasts around ten hours and a bluetooth module allowing data to be transferred to computers or mobile devices. The electronic components were housed in a plastic container measuring 6.5 cm by 5 cm by 2.5 cm. Two ends of the plastic box were connected to two strips of velcro, allowing the user to fasten the device on their wrist. A unit costs 37 USD and weighs approximately 45 grams.
Figure 1a and 1b: Assembled EDA wristband.
Collecting Microclimatic Data A small portable device was built in order to measure the following ambient environmental conditions: noise level, infrared radiation through light inten- sity, dust concentration, carbon dioxide concentration, temperature, relative humidity, air pressure and wind speed. Sampling rate of the unit is 1 Hz.
Investigating How the Environment Affects Physiological, Mental Health and Productivity A period of two hours was cut into eight 15-minute windows. Different ran- domized combinations of microclimatic factors were controlled in each of the windows. Throughout the experiment, a DIY wristband was worn on the left wrist, while the participants were presented with challenging mathematical
tasks to maintain a high level of stress. Few windows will have easier tasks to serve as baseline and low stress periods. There are also baseline period- s/breaks before, during and after the experiment. The participants recruited were junior college students with similar levels of mathematical competency.
EDA data underwent preprocessing in Python, with outlier detection per- formed using the z-score method to eliminate outlier data. Initially, the collected EDA data was normalized and subjected to filtering employing a low-pass filter (1.5 Hz, Butterworth, 32nd order) to eliminate undesired arti- facts (Posada-Quintero and Chon, 2020). Subsequently, the EDA data was decomposed into tonic and phasic components utilizing the convex optimiza- tion (cvxEDA) method developed by Greco et al. (2016). The SCL index was derived as the average of 2-minute windows of the Tonic component. According to Wichary et al. (2016), emotional stress typically exhibits char- acteristics of high arousal and negative valence, indicating its potential as a reliable stress indicator.
For frequency-domain analysis, the EDA data was down-sampled to 2 Hz and subsequently subjected to high-pass filtering (0.01 Hz, Butterworth, 8th order) to eliminate any trend. TVSymp was calculated using variable frequency complex demodulation, representing the mean of time-varying spectral amplitudes within the 0.08 - 0.24 Hz band (Posada-Quintero et al., 2019). Collected PPG data was firstly normalized then median-filtered and then demodulated signal was obtained using Hilbert transform. The signal is then filtered using a band-pass filter (0.5Hz to 5Hz, Butterworth, 2nd order) to remove unwanted artifacts. The P peaks were detected using the peakdet library. The P–P interval time series was transformed to an evenly time-sampled signal by cubic spline interpolation of 4Hz.
Following Posada-Quintero et al., a blackman window (length of 256 points) was applied to each segment, and the fast Fourier transform was calculated for each windowed segment (Posada-Quintero and Bolkhovsky, 2019). From there, the features of low frequencies of HRV (HRV_LF, 0.045 to 0.15 Hz), high frequencies of HRV (HRV_HF, 0.15 to 0.4 Hz), and the features are normalized to the total power of HRV (HRV_LFnu, HRV_HFnu).
Low frequency features of HRV (HRV_LF and HRV_LFnu) are indices of sympathetic control, high frequency features of HRV (HRV_HF and HRV_HFun) are indices of parasympathetic control.
HRV features (as 1Hz signals) are then synced with environmental data and EDA features (as 2Hz signals). Spearman correlation, appropriate for non-normally distributed data, is used to assess monotonic associations between environmental factors and EDA features.
Random forest regression models are then trained on PPG, EDA features and environmental data with the former as input and the latter as output with a train-test split ratio of 7:3 to find the non-linear connections between the environmental factors and EDA and PPG features. This is chosen because model ensembling proves to add to the accuracy of predictions. The results of the random forest regression models were interpreted using Shapley val- ues and Shapley summary plots to find more complex relationships between input and output.
The Use of Bespoke Wearables to Investigate Neurological and Physiological Responses 167
RESULTS
Over 300,000 environmental data points and 200,000 EDA data points 1,000,000 PPG data points were collected from 5 participants (4 males and 1 female).
Preliminary Statistical Analysis From the Spearman Correlation Coefficient test, most correlated environ- mental factors for EDA features and emotions are temperature, air pressure and carbon dioxide concentration. Table 1 shows these factors’ correlation with EDA features.
Table 1. Absolute values of spearman correlation coefficient on some environmental data, EDA and PPG features data.
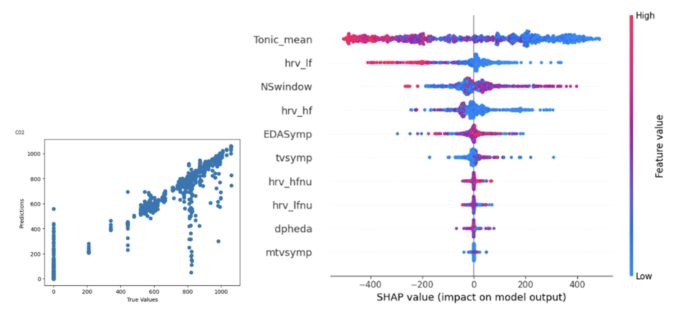
Results of Random Forest Regressor on Carbon Dioxide Concentration From Figure 2, in terms of PPG features, Shapley Summary Plot suggests that lower carbon dioxide concentration is related to high values of hrv_lf, indi- cating higher stress. For the variable ‘hrv_hf’, lower value of carbon dioxide concentration is related to low values of hrv_hf. For the variables ‘hrv_hfnu’ and ‘hrv_lfnu’, the relationship between Carbon dioxide concentration and them are not clearly observed. In terms of EDA features, lower carbon dioxide concentration is related to high values of tonic_mean (SCL) and vice versa. For the variable ‘TVSymp’, lower carbon dioxide concentration is related to low values of TVSymp.
Figure 2: R2 score of 0.985 and shapley summary plot using PPG and EDA features as input to predict carbon dioxide concentration.
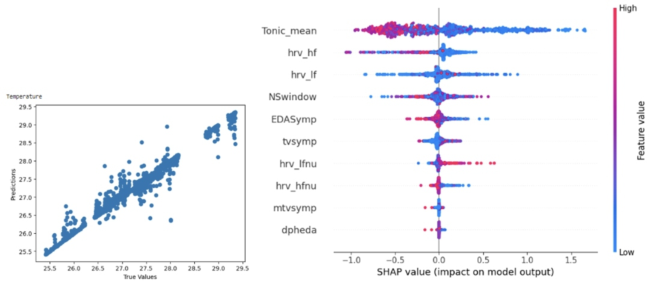
Results of Random Forest Regressor on Temperature From Figure 3, in terms of PPG features, Shapley Summary Plot suggests that higher temperature is related to low values of hrv_lf, indicating lower stress. For the variable ‘hrv_hf’, higher temperature is also related to low values of hrv_hf. For the variable ‘hrv_lfnu’, lower temperature is related to low values of hrv_hfnu. Finally, for the variable ‘hrv_hfnu’, lower temperature is related to high values of hrv_hfnu. In terms of EDA features, higher temperature is related to low values of tonic_mean (SCL) and vice versa. For the variable ‘TVSymp’, lower temperature is related to low values of TVSymp.
Figure 3: R2 score of 0.988 and shapley summary plot using PPG and EDA features as input to predict temperature.
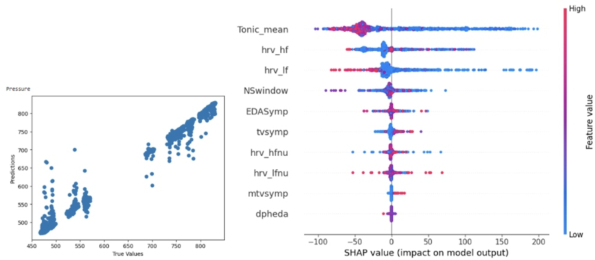
Results of Random Forest Regressor on Air Pressure From Figure 4, in terms of PPG features, Shapley Summary Plot suggests that higher pressure is related to low values of hrv_lf, indicating lower stress. For the variable ‘hrv_hf’, higher pressure is related to low values of hrv_hf. For the variables ‘hrv_hfnu’ and ‘hrv_lfnu’, both lower and higher pressures are related to high values of hrv_hfnu and hrv_lfnu. In terms of EDA features, higher pressure is related to low values of tonic_mean (SCL) and vice versa. For the variable ‘TVSymp’, lower temperature is related to low values of TVSymp.
Figure 4: R2 score of 0.992 and shapley summary plot using PPG and EDA features as input to predict pressure.
The Use of Bespoke Wearables to Investigate Neurological and Physiological Responses 169
DEVELOPING HUMAN SYSTEMS INTEGRATION TOOLS TO SUPPORT SYSTEMS DESIGN HSI experts contribute by ensuring that human capabilities and limitations are considered. It has become clear that treating the system as separate from the users results in poor performance and potential failure in the operational setting. Continued growth in technology has not delivered desired results. Systems engineers and others are beginning to understand the role humans play in technology systems. The core challenge is to balance successful hard- ware and software solutions with human friendly implementations. To define the requirements of humans as a fundamental system component, it is essen- tial to understand the inherent capacity of user populations and their typical operational environment (Booher, 2003). A description of a population’s capacity incorporates more than the basic anthropometrics or the cognitive capability of the average member of the user population (Chapanis, 1996).
CONCLUSION
With adequate understanding of how microclimate can affect students’ stress and in quasi-formal academic contexts, it can be hoped that better solutions can be developed to maximise the comfort of studying for students. This can be in the form of redesigning studying infrastructure, or even teaching peda- gogy. This study hopes to set an example for future research to expand and explore using a more robust, comprehensive approach (e.g.: including more environmental factors, or a multi-modal approach using ECG and EEG).
REFERENCES
Allen J. Photoplethysmography and its application in clinical physiological measurement. Physiol. Meas. 2007;28: R1–39. doi: 10.1088/0967-3334/28/3/R01. Critchley, H., Nagai, Y. (2013). Electrodermal Activity (EDA). In: Gellman, M. D.,
Turner, J. R. (eds) Encyclopedia of Behavioral Medicine. Springer, New York, NY. https://doi.org/10.1007/978-1-4419-1005-9_13 Doell, K. C., Berman, M. G., Bratman, G. N. et al. Leveraging neuroscience for climate change research. Nat. Clim. Chang. (2023). https://doi.org/10.1038/s41558- 023-01857-4 Greco A, Valenza G, Lanata A, Scilingo EP, Citi L. cvxEDA: A Convex Optimization
Approach to Electrodermal Activity Processing. IEEE Trans Biomed Eng. 2016 Apr;63(4): 797–804. doi: 10.1109/TBME.2015.2474131. Epub 2015 Aug 28. PMID: 26336110. Kim HG, Cheon EJ, Bai DS, Lee YH, Koo BH. Stress and Heart Rate Variability: A Meta-Analysis and Review of the Literature. Psychiatry Investig. 2018 Mar;15(3): 235–245. doi: 10.30773/pi.2017.08.17. Epub 2018 Feb 28. PMID: 29486547; PMCID: PMC5900369. Lala B, Hagishima A. Impact of Escalating Heat Waves on Students’ Well-Being and
Overall Health: A Survey of Primary School Teachers. Climate. 2023; 11(6):126. https://doi.org/10.3390/cli11060126 Lim K. Y. T., Nguyen Duc M. A., Nguyen Thien M. T., Yuvaraj R., & Fogarty J. S.
Investigating the Effects of Microclimate on Physiological Stress and Brain Func- tion with Data Science and Wearables. Sustainability. 2022; 14(17):10769. https: //doi.org/10.3390/su141710769
Palme, M.; Salvati, A. (2021). Urban Microclimate Modelling for Comfort and Energy Studies, 1st ed.; Springer, Cham: Switzerland, 2021. Peláez-Coca, M. D.; Hernando, A.; Lozano, M. T.; Bolea, J.; Izquierdo, D.;
Sánchez, C. Heart Rate Variability to Automatically Identify Hyperbaric States Considering Respiratory Component. Sensors 2024, 24, 447. https://doi.org/10. 3390/s24020447 Posada-Quintero, H. F.; Bolkhovsky, J. B. Machine Learning models for the Identification of Cognitive Tasks using Autonomic Reactions from Heart Rate Variability and Electrodermal Activity. Behav. Sci. 2019, 9, 45. https://doi.org/10.3390/bs 9040045 Booher, H. R., Minninger, J. (2003) “Human systems integration in army systems acquisition”, in: Handbook of human systems integration, Booher, Harold (Ed.). pp. 663–698. Posada-Quintero, H. F., & Chon, K. H. (2020). Innovations in Electrodermal Activity
Data Collection and Signal Processing: A Systematic Review. Sensors, 20(2), 479. MDPI AG. Retrieved from https://dx.doi.org/10.3390/s20020479. Posada-Quintero, H. F., Florian, J. P., Orjuela-Cañón, Á. D., & Chon, K. H. (2016).
Highly sensitive index of sympathetic activity based on time-frequency spectral analysis of electrodermal activity. American journal of physiology. Regulatory, integrative and comparative physiology, 311(3), R582–R591. https://doi.org/10. 1152/ajpregu.00180.2016 Posada-Quintero, H. F., Florian, J. P., Orjuela-Cañón, A. D., Aljama-Corrales, T., Charleston-Villalobos, S., & Chon, K. H. (2016). Power Spectral Density Anal- ysis of Electrodermal Activity for Sympathetic Function Assessment. Annals of biomedical engineering, 44(10), 3124–3135. https://doi.org/10.1007/s10439- 016-1606-6 Rahma ON, Putra AP, Rahmatillah A, Putri YSKA, Fajriaty ND, Ain K, Chai R.
Electrodermal Activity for Measuring Cognitive and Emotional Stress Level. J Med Signals Sens. 2022 May 12;12(2): 155–162. doi: 10.4103/jmss. JMSS_78_20. PMID: 35755979; PMCID: PMC9215837. Rinella S, Massimino S, Fallica PG, Giacobbe A, Donato N, Coco M, Neri G, Parenti R, Perciavalle V, Conoci S. Emotion Recognition: Photoplethysmography and Electrocardiography in Comparison. Biosensors (Basel). 2022 Sep 30;12(10):811. doi: 10.3390/bios12100811. PMID: 36290948; PMCID: PMC9599834. de Sherbinin, A., Bowser, A., Chuang, T.-R., Cooper, C., Danielsen, F., Edmunds, R.,
Elias, P., Faustman, E., Hultquist, C., Mondardini, R., Popescu, I., Shonowo, A., & Sivakumar, K. (2021). The critical importance of Citizen Science Data. Frontiers in Climate, 3. https://doi.org/10.3389/fclim.2021.650760 Wichary, S., Mata, R., and Rieskamp, J. (2016) Probabilistic Inferences Under Emotional Stress: How Arousal Affects Decision Processes. J. Behav. Dec. Making, 29: 525–538. doi: 10.1002/bdm.1896. Zangróniz R, Martínez-Rodrigo A, Pastor JM, López MT, Fernández-Caballero A.
Electrodermal Activity Sensor for Classification of Calm/Distress Condition. Sensors (Basel). 2017 Oct 12;17(10):2324. doi: 10.3390/s17102324. PMID: 29023403; PMCID: PMC5677183.
LISTED IN THE AHFE DIGITAL BOOKSTORE CATALOGUE
Explore the complete digital volume
Neuroergonomics and Cognitive Engineering
Read this individual research paper free through the original publisher, or explore the full digital proceedings book.
ISBN 978-1-964867-02-1
Explore this ISBN in the AHFE Bookstore ↗Listed in the July 2026 bookstore catalogue; search by ISBN to confirm current availability · Digital book purchase optional