Jiale Wang, Wei Huang, Xiu Li (2024). Mania Archetype: Chart Generation for Rhythm Action Games with Human Factors. In: Human Factors in Virtual Environments and Game Design. AHFE Open Access, vol. 137, pp. 175–185. https://doi.org/10.54941/ahfe1005000
In recent years, it has been proven feasible to generate rhythm game charts through machine learning models. This has reduced the cost of chart generation and served as an auxiliary tool for novice chart creators. Machine learning generation allows players to experience new songs and charts earlier. However, the article does not provide sufficient discussion on how to generate challenging and high-quality human-like charts for the versatile 4k Mania mode, which uses 4 scrolling 'note highways' to display the notes to be played. The focus of this article is on improving the generation of 4k charts in OSU! Mania through research on machine learning chart generation, with the aim of creating more interesting and accurate charts. Additionally, we propose a more comprehensive and humane standard for evaluating the quality of generated charts. This was informed by interviews with experienced players and chart creators.
Procedural Content Generation via Machine Learning (PCGML) has been applied to create various game contents and has become increasingly preva- lent in commercial pipelines. Machine creation has made significant contri- butions in areas such as images, text, effects, and levels. This article focuses on exploring rhythm game level generation, specifically chart generation, for one of the most typical game modes, Mania mode.
This article focuses on exploring rhythm game level generation, specifically chart generation, for one of the most typical game modes, Mania mode. This article focuses on exploring rhythm game level generation, specifically chart generation, for one of the most typical game modes, Mania mode. We have chosen 4k mode as our preliminary subject. Mania mode is a transformation of the early rhythm game arcade Dance Dance Revolution and its PC sim- ulator, Step Mania. The classic model, Dance Dance Convolution (DDC), is based on this platform.
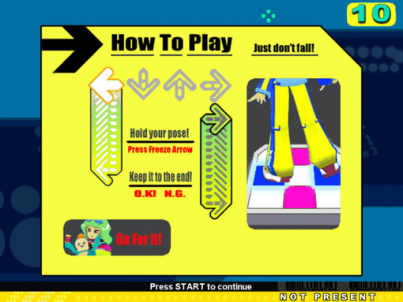
Figure 1: The game user interface (GUI) of step Mania showing players how to play a hold.
We curated a dataset of 120 highly rated charts and trained a Long Short- Term Memory Recurrent Neural Network (LSTM RNN) to translate music into Mania charts. Compared to prior work, our architecture, named ‘Mani- aArchetype’, can make temporal predictions of Mania note patterns while ensuring accurate onset detection.
In this article, we present the following contributions:
A deep learning architecture which performs better in predicting Mania 4k note patterns than previous models.
A dataset containing 110 high-difficulty charts of Mania 4k. These charts have been selected from human works with Ranked Criteria, and the songs are presentative of recent music styles.
A comprehensive evaluation standard for machine-generated charts. This standard is based on surveys and interviews with experienced players and chart authors, and reflects the demands of rhythm game players.
The article begins by defining the problem domain and its application value. The core solution idea for this problem domain is proposed based on previous research. The related data, methods, and model architecture that extend from this idea are then clarified. Finally, we will quantify the prelim- inary improvement effect of this method in the problem domain using both mathematical data and player experience questionnaire data. This study is aimed at improving player experience. At the end of the article, we provide additional information on the method’s further improvement direction and the research findings.
PROBLEM DEFINITION Music Style and Chart Style
The initial issue we faced was the existence of numerous creative rhythm games in the market. These games feature distinct story backgrounds, music preferences, and innovative interaction modes, track numbers, and note types. We opted for the original and fundamental 4k drop style, also known
Mania Archetype: Chart Generation for Rhythm Action Games With Human Factors 177
as Mania mode, with the aim of generating chart ideas for different rhythm games with varying paradigms.
Furthermore, similar to Taiko Nation’s research, we have also selected OSU! as our research platform. In contrast to the previous DDC model, the most popular rhythm games on mobile platforms currently, such as Cytus, Phigros, Love Live!, and BanG Dream!, all feature Japanese electronic music styles. Rhythm games have been well commercialized in Japanese mobile games featuring virtual idols. In 2021, the Love Live! game development department published a paper on the generation of rhythm game charts, specifically highlighting the demand for Procedural Content Generation of Rhythm Games (PCGoRG).
The paper distinguishes between OSU Ranked charts and OSU Loved charts, with the aim of developing a model that can generate the latter. The Ranked criteria is OSU!’s stricter regulation on the creation style of official charts, as it involves rankings, competitions, and ‘Dan’. Therefore, Ranked charts must be standardized and fair to ensure objectivity. This also leads to Ranked charts that better reflect the unique chart style of OSU!, which is more difficult to generalize to other platforms and game modes than Loved charts (charts that are not officially certified but loved by players).
Game Difficulty and Players The charts we chose in OSU! have a medium to high difficulty level, equiv- alent to the ‘Hard’ mode in mobile rhythm games. This choice was made to facilitate further research. The reason for this is that the ‘Expert’ difficulty on mobile platforms tends to express the creative ideas of chart authors, while the patterns in the ‘Normal’ mode are not vivid enough. Additionally, ‘Hard’ is the most frequently played difficulty mode for most non-expert players.
Furthermore, variations in game difficulty are primarily attributed to the game devices used. Offline dance machines have a lower density, whereas mobile games that only require finger movements offer greater flexibility. As a result, our selection of the ‘Hard’ difficulty level is roughly equivalent to the ‘Insane’ difficulty level (4∼6 stars) in OSU!, and the ‘Excellent’ rating in Dance Dance Revolution.
Focus on Note Selection Finally, we have made a significant breakthrough in the note selection prob- lem during data processing for the generative model. Previous research on machine-generated rhythm game charts generally divided generation and evaluation into two steps: onset detection and note selection. Onset detec- tion determines whether to place a note at a specific point in time based on the given information, while note selection determines the type of note to place. For instance, the research on Love Live! charts generation focuses on the onset detection problem, while our study on note selection builds on previous findings.
However, our approach to note selection differs slightly from that of DDC and Taiko Nation, as we address multiple sub-problems, including the place- ment of different types of notes. In DDC, there are four defined types of notes:
no notes, single note, press down, and lift up. However, in Taiko Nation (which only has one track in taiko mode), notes are classified according to different drum points.
Our research focuses on two sub-problems: the multi-press problem and the type problem. This is because on electronic platforms, it is common for rhythm game charts to hit multiple tracks simultaneously (referred to as ‘multi-press’ in OSU!). For example, in ‘stack’ charts, a popular note arrange- ment pattern among players, all notes are multi-pressed. This chart challenges players and provides them with a sense of accomplishment by testing their observation and switching abilities between vacant tracks. The impact of this difference on our research methods will be discussed in the following text.
DATAFICATION Trunking Time Length
In order to convert music and chart information into data, the song and chart must first be segmented at a specific timescale length. This will present their data information by time points. In Music-Related PCG, a timescale of 23ms is typically used (which corresponds to the duration of two 1/64th notes in a song with a BPM of 163), and our research follows this convention. However, it has been observed that this will impact the number of beats ultimately included in the sliding window, and consequently affect the amount of data we input for model learning. If the BPM deviates significantly from 163, this will result in a larger error.
Therefore, we have calculated the appropriate timescales for different BPM ranges with a 20 BPM interval and summarised them in the table below.
Table 1. Corresponding BPM estimation for timescale.
In this article, to ensure more accurate calculations, we have limited the dataset and songs used for experiments to a BPM range of 150–170. This is a simplified preliminary method. If it is necessary to cover all BPM situations, we recommend adjusting the timescale as shown in the table to ensure the model receives a reasonable amount of information.
Audio Feature Extraction At each timestamp, the music file needs to be converted into an array data for- mat to be input into the model. This article follows the method of prior works similar to ours, which is a common datafication method in deep learning
Mania Archetype: Chart Generation for Rhythm Action Games With Human Factors 179
projects for audio classification tasks. Firstly, a short-time Fourier trans- form (STFT) is performed on the audio signal. Then, the Mel-scale filterbank is used to compress the spectrum dimension to 90 frequency bands. This method extracts the key features of STFT into evenly spaced segments and performs logarithmic scaling on them to reflect loudness. The ESSENTIA audio processing library normalizes each frequency band to zero mean and unit variance, allowing us to obtain pitch, timbre, and loudness informa- tion of the music. Additionally, the model obtains rhythm information by combining audio in groups of 16 segments.
Note Expression At each timestamp, the note placement situation is expressed through an 8- bit vector. Each 4k track has four states: no note, click, long note press, and long note release. The 8 bits are used to represent the state of four tracks, with each track using 2 bits from left to right. These two bits will have four situations: (0, 0) represents no note, (0, 1) represents a click, (1, 0) represents pressing the long note when there is no note on this track, and represents releasing the long note when this track is sliding.
To express the long note, we have tried various schemes. We decided to use (1, 0) to represent pressing the long note and continue to use (1, 0) to represent the continuous long note. The release state is expressed by the end of (1, 0). This method aligns with OSU!’s scoring system for the long note. However, it may result in an overemphasis on the continuous long note state due to the large number of (1, 0) expressions in the data. In reality, players are more attuned to the rhythm points when they press and release the long note. Additionally, the coordination of notes on this track and other tracks during pressing and releasing significantly impacts the player’s perception.
SYSTEM The note selection prediction model combines the DDC and Taiko Nation models to consider music features, track conditions, and note types simulta- neously, resulting in a chart style closer to that of human creators. The dataset will train a C-LSTM model, as illustrated in the figure. By inputting.mp3 files and corresponding binary onset detection information.npy files, this model can predict the track selection situation at the onset point and the situation of note selection for each track. It then outputs a.osz file that can be directly played in OSU!.
Figure 2: The workflow of our model generating a chart from .mp3 to .osz.
Figure available in the original PDF paper.
Dataset In conclusion, our research requires a dataset that includes electronic anime music and charts with typical and abundant note patterns. The BPM should be between 150 to 170, and the difficulty should be between 3 to 6 stars. We obtained the necessary song packages from the player community, including official competition chart pools, enduring high-quality charts, and standard charts specifically used by players for pattern practice. These contents are well-known among experienced players and are highly popular in the player community. Some of the charts have unique designs, such as anti-note charts (charts created solely based on the gaps between long notes) and SV charts (charts that challenge players to master the rhythm of music through speed changes). Although these charts are presented in OSU! as levels with cre- ativity and playability, our goal is to train a chart generation model with capabilities for different game platforms. To ensure the generalization ability of this model, we have removed the unique contents specific to OSU!. We obtained a total of 120 charts that meet our needs, and the data was split into 1:1:10 for testing, evaluation, and training.
The songs and chart files are converted into array data. Then, the song data and chart data are grouped together based on the same timestamp. Only the segments with note placements are considered, as the task is to select the track and note type after the onset detection has been determined. Furthermore, approximately 85% of the timestamp segments in the chart lack accompany- ing notes. This processing step can prevent overfitting due to class imbalance and enhance the ability to predict note selection.
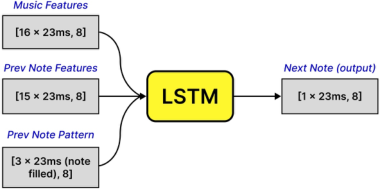
Data Input A sliding window with a step of 15 is used to provide music information, pre- vious note information, and the type of note that has been placed before for the model to predict the note type. This design combines DDC and Taiko Nation. Specifically, a sliding window is used to provide music data and note information within the previous 15 timestamps, which is consistent with Taiko Nation. Additionally, we provide information on the track and type of the previous three confirmed notes. This supplements the ‘Next Step’ infor- mation in DDC and is crucial as authors primarily consider these factors when deciding on note placement.
This data was chosen based on interviews with two authors who have over five years of chart creation experience. Music information can convey various aspects such as timbre, frequency changes, the number of soundtracks, and loudness. For instance, in the ‘Insane’ difficulty, authors frequently determine the placement of tracks based on the number and loudness of soundtracks or decide to insert a click or a long note based on the timbre. Adjacent note information can serve as a reference to comprehend the distance from the previous note placement to this chunk. For instance, if a note appears in close proximity, it is advisable to stagger the track to avoid note repetition. The placement of the previous three notes can provide sequence information about the note type, allowing for better expression of the pattern. For exam- ple, if the previous three notes are widely spaced but still show the ‘steam’ pattern, this note is more likely to complete the pattern.
Mania Archetype: Chart Generation for Rhythm Action Games With Human Factors 181
Model A C-LSTM model is used for the prediction task of note selection. This approach treats the prediction task as similar to sequence prediction of language.
The model first analyses the music information input through a ConvNet model that predicts the type of instrument through audio analysis. The model first analyses the music information input through a ConvNet model that pre- dicts the type of instrument through audio analysis. This is achieved through two different scales of convolution, followed by a maximum pooling. The table displays the ConvNet’s detailed architecture, input size, and parameter values for each layer. The number of channels will double after each convolu- tion layer. This layered structure is ideal for expressing music audio, as music often exhibits a layered structure over time, allowing for effective emphasis of timbre with distinct features at different scales.
The ConvNet is then connected to the LSTM as input to reflect the impact of music features on the final prediction. The LSTM model has a 4-layer architecture, with each layer taking in different types of influencing factor data. All nodes are reshaped into 8 vectors of length 8. These 3 groups of vector sequences are then input into the last layer of the LSTM architecture to make a comprehensive prediction of the sequence. Finally, a vector of length 8 is outputted as the predicted note selection by adding a fully connected layer.
Figure 3: The input data of our LSTM model incorporates human factors in rhythm game.
ReLU is used as the activation function for all layers except the last fully connected layer. Previous research has shown that ReLU is superior to other activation functions for such tasks. However, in the last fully connected layer, the sigmoid function is used instead of softmax. Our tracks have a paral- lel relationship with each other, and multiple tracks may be selected when choosing notes. Therefore, separate predictions must be made for each track’s situation.
Training Methods. To minimize the binary cross entropy, we use the Adam optimizer since there may be multiple reasonable ways to visit the note under the same situation. The training process involves 5 epochs with a learning rate of 0.00001 and a batch size of 64. After that, the learning rate is lowered to 0.000005, and the training continues for 2 more epochs until the loss of the test set no longer decreases.
Output The pipeline extracts the necessary information for note placement by inputting the.mp3 file and the prediction.npy file for each timestamp. If pre- vious data is absent, zeros are used for padding. After each note selection prediction is generated, the resulting information is updated for the next pre- diction. This is an improvement compared to Taiko Nation. In addition, the pipeline will replace each 0 in the.npy file with a string of eight zeros, and replace 1 with the corresponding prediction result.
The model’s prediction is made separately for each track, and the final result is determined based on the probability of each track being empty, clicked, or slid during generation. As softmax is not being used, there is a small probability that all four tracks may be empty. In such cases, the selection process will be repeated until a non-empty result is obtained.
Once the dataized prediction is complete, the pipeline will generate the final osu chart file using the.npy file that replaces the note selection. The coding rules are consistent with converting the.osu chart to an.npy file. A judgment is added to prevent adding a click when a track is sliding.
EVALUATION During the evaluation phase, the baseline is the generation results of the DDC model. The evaluation dimensions are note placement, note selection (i.e. pattern), and overall playability. Experienced players fill out scales for each dimension. Statistical data from the script output is used for comparison in the note placement and note selection dimensions. We will analyse both objective generation data and player subjective experience.
To test player experience, registered players are asked to complete a pre- test questionnaire to provide insight into their gaming experience. From this group, we select 8 players with medium to high difficulty gaming levels in OSU! and at least 3 months of experience in mobile rhythm games. Addi- tionally, the.sm charts generated by DDC will be converted into.osu charts to ensure compatibility across different game platforms. This will allow players to compare and experience the game on a unified platform.
Mania Archetype: Chart Generation for Rhythm Action Games With Human Factors 183
To evaluate the data, we have selected 10 charts from the high-popularity group YOASOBI’s songs in the OSU community over recent years. These charts have been manually created. This is because YOASOBI’s song style represents the popular trend of anime electronic music in recent years, and their songs have created multiple chart-topping works. High-popularity works can be chosen from them to ensure the representativeness of the evaluation set.
Onset Detection Evaluation The evaluation scale requires players to score the fit, predictability, and mem- orability of the rhythm for both the control and experimental groups. The resulting player evaluation scores show that our model outperforms the DDC model in these three aspects, as demonstrated in the chart.
Additionally, the machine data script compares the note situation of each timestamp with the charts in the evaluation set to determine its similarity. The comparison is based on the original data of the 8-bit vector. The similarity (Same) of the charts generated by our model has slightly decreased.
Table 3. DDC and ManiaArche type compared on onset detection metrics.
Table available in the original PDF paper.
Models Same Fit Predictability Memorability DDC 22.73% 2.38/5 2.38/5 2/5 MA 21.67% 3.13/5 3.38/5 2.75/5
Note Selection Evaluation The scale requires players to score the fit, predictability, and memorability of the note type for both the control and experimental groups, and obtain player evaluation scores. Our model generates charts that show improved scores in these three aspects compared to the DDC model, as shown in the chart.
The machine data script compares the note situation of a group of times- tamps with a step size of 64 with the charts in the evaluation set and returns its similarity. The comparison is based on the note type abstracted from the 8-bit note vector. We will compare the number of tracks with placed notes (Pattern) and the presence of long notes (LN). Our model has successfully increased the similarity of the generated charts.
Table 4. DDC and ManiaArche type compared on note selection metrics.
Table available in the original PDF paper.
Models Pattern LN Fit Predictability Memorability DDC 51.01% 42.56% 2.38/5 2.25/5 1.88/5 MA 64.34% 58.12% 3.13/5 2.88/5 2.88/5
Overall Playability Evaluation As an evaluation for a kind of game, we selected three dimensions to measure playability: immersion, sense of achievement, and irritability. Additionally,
due to the unique nature of rhythm games, we included a fourth dimension: the intensity of motivation to improve scores. The Mania Archetype group has performed better.
Table 5. DDC and ManiaArche type compared on overall playability metrics.
This paper verifies that incorporating human factors into the process of gen- erating rhythm game charts with deep learning can improve the model’s prediction ability for longer segments and more vague types. The charts gen- erated will have more similar features to human works and are more likely to be accepted by players. However, there is still some ways for improve- ment in our work. For instance, providing the model with flipped charts for training can help it learn the symmetry features of the Mania mode better. Additionally, we did not handle the mutually exclusive logical relationship between note and LN predictions in the same track well, and only consid- ered them as separate prediction items. We hope that future researchers can further optimize these issues.
REFERENCES
Baldwin, A., Dahlskog, S., Font, J. M., & Holmberg, J. (2017, August). Mixedinitiative procedural generation of dungeons using game design patterns. In 2017 IEEE conference on computational intelligence and games (CIG) (pp. 25–32). IEEE. Chen, C. H., & Lo, C. S. (2016, November). The development of a music rhythm
game with a higher level of playability. In 2016 International Conference on Advanced Materials for Science and Engineering (ICAMSE) (pp. 132–135). IEEE. Donahue, C., Lipton, Z. C., & McAuley, J. (2017, July). Dance dance convolution.
In International conference on machine learning (pp. 1039–1048). PMLR. Halina, E., & Guzdial, M. (2021, August). TaikoNation: Patterning-focused chart generation for rhythm action games. In Proceedings of the 16th International Conference on the Foundations of Digital Games (pp. 1–10). Halina, E., & Guzdial, M. (2021, October). A demonstration of kiaitime: A mixed-
initiative pcgml rhythm game editor. In Proceedings of the AAAI Conference on Artificial Intelligence and Interactive Digital Entertainment (Vol. 17, No. 1, pp. 240–242). Han, Y., Kim, J., & Lee, K. (2016). Deep convolutional neural networks for predominant instrument recognition in polyphonic music. IEEE/ACM Transactions on Audio, Speech, and Language Processing, 25(1), 208–221. Huh, J., Martinsson, E., Kim, A., & Ha, J. W. (2020). Modeling Musical Onset
Probabilities via Neural Distribution Learning. arXiv preprint arXiv:2002.03559.
Mania Archetype: Chart Generation for Rhythm Action Games With Human Factors 185
Jenson, J., De Castell, S., Muehrer, R., & Droumeva, M. (2016). So you think you can play: An exploratory study of music video games. Journal of Music, Technology & Education, 9(3), 273–288. Kim, Y., & Choi, S. (2021, August). Vision-based beatmap extraction in rhythm game
toward platform-aware note generation. In 2021 IEEE Conference on Games (CoG) (pp. 1–5). IEEE. Liang, Y., Li, W., & Ikeda, K. (2019). Procedural content generation of rhythm games using deep learning methods. In Entertainment Computing and Serious Games: First IFIP TC 14 Joint International Conference, ICEC-JCSG 2019, Are- quipa, Peru, November 11–15, 2019, Proceedings 1 (pp. 134–145). Springer International Publishing. Lin, Z., Xiao, K., & Riedl, M. (2019, October). Generationmania: Learning to
semantically choreograph. In Proceedings of the AAAI Conference on Artificial Intelligence and Interactive Digital Entertainment (Vol. 15, No. 1, pp. 52–58). Steinberg, S. (2011). Music games rock: Rhythm gaming’s greatest hits of all time.
Dix Hills: Power Play Publishing. Takada, A., Yamazaki, D., Yoshida, Y., Ganbat, N., Shimotomai, T., Hamada, N.,...
& Sakurai, D. (2023, June). GenéLive! generating rhythm actions in love live!. In Proceedings of the AAAI Conference on Artificial Intelligence (Vol. 37, No. 4, pp. 5266–5275).
LISTED IN THE AHFE DIGITAL BOOKSTORE CATALOGUE
Explore the complete digital volume
Human Factors in Virtual Environments and Game Design
Read this individual research paper free through the original publisher, or explore the full digital proceedings book.
ISBN 978-1-964867-13-7
Explore this ISBN in the AHFE Bookstore ↗Listed in the July 2026 bookstore catalogue; search by ISBN to confirm current availability · Digital book purchase optional