Chijing Wang, Ryota Nitto, Takuo Kuroki, Yuki Ban, Miki Nakai, Jun'ichi Shimizu, Tomoyoshi Ashikaga, Shin'ichi Warisawa (2024). Constructing a Transformer-based Model to Infer Daytime Productivity from Biometric Information During Sleep. In: Human Systems Engineering and Design (IHSED2024): Future Trends and Applications. AHFE Open Access, vol. 158, pp. 175–186. https://doi.org/10.54941/ahfe1005541
Good sleep reduces tiredness and improves daytime work. Sleep quality is primarily determined by sleep satisfaction, sleep stage, and sleep duration. However, the impact of sleep quality on daytime performance, such as sleepiness and productivity, remains unclear. Clarifying the relationship between sleep, daytime productivity, and sleepiness can help quantify the vigor restored by sleep and identify appropriate work hours, ultimately reducing workplace errors and accidents.Existing methods for estimating sleep quality have limitations. EEG-based methods struggle with estimating daytime performance metrics, while methods using wearable sensor devices lack accuracy in estimating sleep parameters. Based on the correlation between biometric indices and sleep quality, this study aims to estimate the next day's productivity directly from non-EEG biometric data, which can be easily measured and analyzed. This approach avoids the loss of information inherent in estimating sleep quality from biometric data and extracts information more closely related to next-day productivity. To achieve our goal, we built a deep learning model based on Multi-Head Attention.Electrocardiogram (ECG), respiration (RIP), and electrodermal activity (EDA) were selected as sleep-related biometrics based on a survey report on sleep quality. Analyzing large amounts of raw data as-is would result in poor computational efficiency, so we extracted feature values from each type of biometric information. Given the uncertainty about which features would contribute to the estimation, we extracted 23 types of features and refined them based on their contribution ratio.To evaluate reaction time, working memory, and sleepiness restored by sleep, we selected the PVT-B, 2-back task, and Stanford Sleepiness Scale (SSS) to assess daytime performance and subjective sleepiness. To capture the time-series characteristics of sleep biometric data, we used a Transformer-based model with only an encoder to infer daytime productivity. We also output Shapley values to indicate the contribution of each feature to the prediction result, thus improving the model's interpretability.Samples were prepared by mapping the biometric time-series data obtained from the experiment each night to the productivity index data and sleepiness on the following day. Data were collected over 51 days (15 subjects), excluding days with equipment malfunctions. Twenty-three biometric features were extracted from the experimental data in 4-minute time windows. The model was trained to estimate reaction time, the accuracy rate of the 2-back task, and sleepiness. Sleepiness inference was based on a three-category classification: better, same, and worse.The trained model performed well in predicting reaction time, 2-back task accuracy, and sleepiness, with an R2 coefficient greater than 0.5 and an F1 score of approximately 0.8. Shapley values revealed which features contributed significantly to each objective variable. The Transformer model effectively captures daytime productivity from biometric information during sleep and refines the number of features based on Shapley values.This study demonstrates that using non-EEG biometric data and a Transformer-based model can accurately estimate next-day productivity and sleepiness, offering a novel approach to understanding the impact of sleep quality on daytime performance.
Sleep is part of the circadian rhythm and restores major body systems like the respiratory, musculoskeletal, central nervous, and circulatory systems (Mendonça et al., 2019). Good quality sleep reduces tiredness and improves daytime work (Craven et al., 2022).
Existing methods for estimating sleep quality have limitations. Two limitations are associated with EEG-based methods, while one pertains to methods utilizing smart wearable devices. Sleep onset latency, sleep stage, and sleep duration are common indicators of sleep quality (Crivello et al., 2019), primarily relying on EEG data. This approach neglects other physiological systems, such as the sympathetic nervous system and the respiratory system, which affect sleep quality. A broader evaluative framework is needed.
EEG-based methods also struggle with estimating daytime performance metrics. While they correlate sleep stages and duration with subjective sleepiness (Craven et al., 2022), they fail to correlate reaction time and working memory (Ishaque et al., 2022; Zavecz et al., 2020). This indirect approach results in low accuracy for estimating daytime vigor.
Wearable sensor devices, while capable of monitoring biometric information during sleep, lack accuracy in estimating sleep parameters. Mendonça et al. (2019) found that current wearable technologies exhibit limited accuracy in differentiating between non-REM and REM sleep stages, indicating the need for refinement in technology and analysis methods.
These limitations lead to the research question: Can biometric information during sleep estimate daytime performance and sleepiness? Clarifying this relationship can help quantify the vigor restored by sleep, recognize appropriate work hours, and reduce workplace mistakes and accidents.
Prior research highlights the impact of non-EEG biometric indicators on sleep. Ma et al. (2020) used ECG features to diagnose sleep apnea. Hsu et al. (2020) developed respiratory muscle interventions for obstructive sleep apnea. Gashi et al. (2022) used EDA to classify sleep stages, showing the potential of non-EEG biometrics in understanding sleep-related disorders.
Deep learning models have shown high accuracy in estimating sleep quality. Dai et al. (2023) proposed MultiChannelSleepNet, using multi-head attention from the Transformer model (Vaswani et al., 2017), achieving 90.4% accuracy. Previous research using LSTM achieved only 86.3% (Eldele et al., 2021), demonstrating the Transformer’s superiority.
This study constructs a Transformer-based model to estimate the next day’s productivity directly from non-EEG biometric data, aiming to identify crucial biometric features during sleep that impact daytime productivity.
Our study has novelty and contribution in three ways. First, we directly infer daytime productivity from biometric data (ECG, RIP, and EDA) during sleep, avoiding information loss from estimating sleep parameters. Second, our model achieved an average F1 score of 78.7% for sleepiness and an R2 coefficient of 0.68 for predicting working memory and alertness, outperforming previous studies. Third, we identified key biological features contributing to daytime productivity, aligning with previous findings and revealing new correlations, enhancing our model’s reliability and innovativeness.
Transformer-Based Model to Infer Daytime Productivity From Biometric Information The architecture of the Transformer model, as detailed by Vaswani et al. (2017), introduces a self-attention mechanism that allows for parallel processing of entire sequences. This is achieved through an encoder-decoder structure, where each layer consists of multi-head self-attention and position- wise fully connected feed-forward networks. The incorporation of positional encodings enables the model to account for token order within sequences. Multi-head attention mechanisms enhance the model’s ability to capture complex dependencies and relationships by focusing on different parts of the input sequence simultaneously. This architecture improves computational efficiency and performance in tasks involving long-range dependencies and complex sequence structures.
The Transformer model’s capability to analyze complex sequence data, such as time-series sleep data collected over extended periods, makes
Constructing a Transformer-Based Model to Infer Daytime Productivity 177
it well-suited for capturing temporal dependencies and patterns within sleep stages across different time points. The self-attention mechanism and parallel processing allow the Transformer model to effectively identify and understand the relationships between sleep stages over time, handle complex, non-linear patterns in sleep data, and improve computational efficiency when analyzing large sleep datasets.
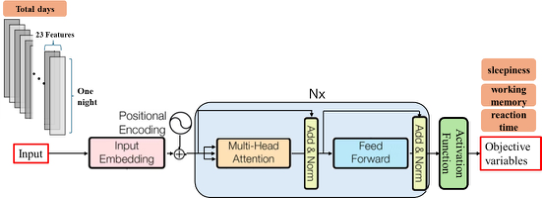
As discussed in the introduction, the Transformer model’s potential in analyzing complex sequence data has led many researchers to modify the model to suit their specific tasks. Wu and Lian (2022) proposed a Transformer Attention prototype network model with multi-channel feature map inputs for ECG classification, achieving respectable results compared to 12 other different models. Building upon these findings, we re-constructed a Transformer-based model for an estimating task in which biometric data during sleep is input as time series data and the next day’s productivity index is used as the objective variable (Figure 1). We emulated the input structure of Wu and Lian’s model, mapping a total of 23 features from full-night sleep data as inputs. Since our goal is to infer daytime productivity, which is evaluated in terms of levels and scores, we used only the encoder block of the original Transformer model to learn from the sleep data and produce outputs aligned with the evaluation of daytime productivity through different activation functions (linear for estimating productivity scores and softmax for estimating productivity levels).
Moreover, we used SHAP (Shapley Additive exPlanations) to output Shapley values from the trained Transformer model, which indicate the contribution of the feature to the prediction result and can improve the interpretability of the model, as demonstrated by Benedek et al. (2022).
Figure 1: Structure of transformer-based model with time-series as input and daytime productivity index as objective variables.
Selected Indicators and Measurement System To achieve high estimation accuracy with the constructed Transformer-based model, it is essential to select biometric indicators that directly contribute to sleep activity during the night as inputs and productivity indicators that are commonly related to sleep quality as outputs. Additionally, we need to develop a measurement system to ensure accurate data collection for these indicators through sensors and productivity tasks. This system should guarantee the reliability and validity of the input data, thereby enhancing the
overall performance of the model in predicting daytime productivity based on sleep quality.
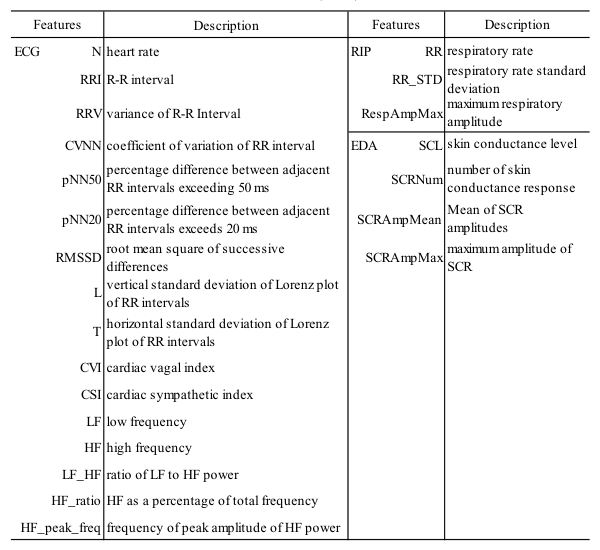
Regarding biometric indicators during sleep, the introduction section highlighted that electrocardiogram (ECG), respiration (RIP), and electrodermal activity (EDA) are directly related to sleep activity and quality. However, ECG, RIP, and EDA data are typically collected at a sampling rate exceeding 100Hz, making it impractical for any deep learning model, including Transformer-based models, to analyze raw biometric data over an entire night. Consequently, we decided to extract features from each type of biometric data using a time window and time step of 4 minutes (Table 1). This choice is based on the need for a time window exceeding 2 minutes to extract several ECG features, as indicated by George et al. (2008). This approach reduces the length of the input data to approximately 160, making it manageable for analysis by the model.
Table 1. Extracted features from ECG, RIP, and EDA.
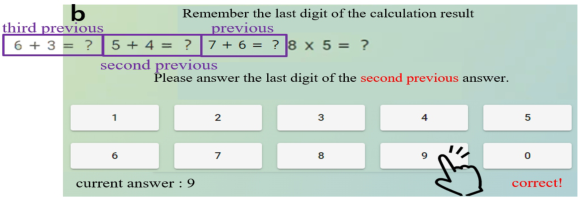
For indicators of daytime productivity, research by Mathias Basner et al. (2011), Susanne et al. (2010), and Herscovitch et al. (1981) has demonstrated the reliability of the PVT-B, 3-back task, and Stanford Sleepiness Scale (SSS) for evaluating daytime cognitive ability and subjective sleepiness. The PVT-B measures a person’s reaction time to assess alertness during the day. The 3-back task involves a continuous quiz that evaluates short-term memory by requiring participants to recall answers calculated 2 questions before. The SSS is a reliable subjective questionnaire in which individuals report
Constructing a Transformer-Based Model to Infer Daytime Productivity 179
their daytime sleepiness. We utilize these three indicators to comprehensively evaluate daytime productivity.
Next, we will introduce the measurement of biometric indicators during sleep and the measurement of daytime productivity during the day separately.
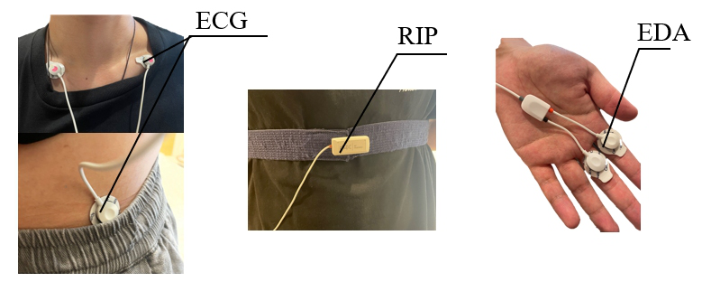
To accurately collect sleep data without influencing sleep quality, we decided to use non-invasive electrode sensors called Biosignalplux (Figure 2), which are comfortable to sleep with.
For the daytime productivity measurement, we developed a web application that enables experiment participants to easily perform the PVT-B (Figure 3a), 3-back (Figure 3b), and Stanford Sleepiness Scale tasks (collectively referred to as “All-task”).
In the PVT-B, we collect reaction times for 50 valid trials, excluding flying starts, and calculate the average reaction time. For the 3-back test, we randomly generate 50 calculation questions involving addition, subtraction, multiplication, and division up to the ten-digit level, presenting them at 3-second intervals. Participants begin answering the second previous question after the third question is shown, and the accuracy of their responses is calculated. For the SSS questionnaire, we collect data on participants’ levels of sleepiness based on their answers.
To mitigate the influence of unfamiliarity with the web application, we required the experiment participants to practice using the application in advance.
Figure 2: Biometric sensors used in experiment, including ECG, RIP and EDA sensors.Figure 3: Web applications used to implement PVT-B (3a) and 3-back (3b).
Experiment Design The purpose of the experiment was to obtain biometric data during sleep and corresponding daytime productivity data.
This study was approved by the Ethical Review Board of the University of Tokyo (No. 23-76) and was conducted in accordance with the Declaration of Helsinki and Japanese ethical guidelines. Participants were thoroughly informed about the purpose of the study, the procedure, and the possible consequences of their participation. They were made aware that their participation was voluntary and that they had the right to refuse or discontinue participation at any time. Written informed consent was obtained from all participants prior to their involvement in the study.
15 experimental participants were recruited for the study, and each underwent a five-night sleep experiment. To exclude the influence of other physiological factors, only male participants were selected, excluding weekday smokers, excessive drinkers, and those with severe sleep disturbances or other disorders affecting sleep. This selection also accounted for the possible influence of the menstrual cycle on sleep.
On the experimental days, participants were asked to refrain from consuming alcohol and caffeine-containing beverages. If they felt ill, they were instructed to inform us and stop the experiment.
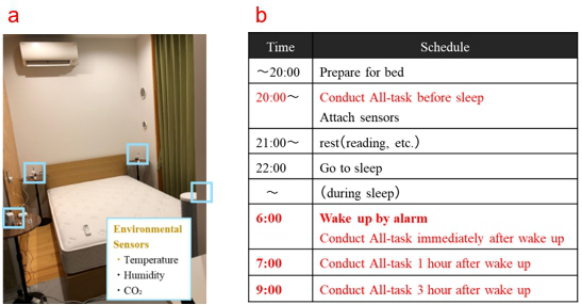
The experiment room is shown in Figure 4a. Environmental sensors were used to control the room conditions, adjusting humidity and temperature to what the subjects considered optimal. The base room temperature was set at 24
C and was adjusted after interviewing each subject to ensure they had no complaints during the test.
Figure 4: a: Experiment room with a bed near 4 environmental sensors that detect temperature, humidity and CO2 concentration. b: Experiment schedule (the red highlights time when All-task is conducted).
The experiment schedule is shown as Figure 4b. The experiment will start at 18:00, and the participants will be ready for bed by 20:00. All-task will be conducted from 20:00 to obtain the reference value of productivity recovery by sleep, and then the sensor will be attached to the participants.
Constructing a Transformer-Based Model to Infer Daytime Productivity 181
After that, the patient rests (reading, etc.) and goes to sleep after turning off the lights at 22:00. The next day, the participants wake up at 6:00. and immediately performs All-task, followed by another All-task at 7:00 and 9:00. The time of All-task on the following day was set with reference to the change in cognitive function caused by sleep inertia based on a study from Hilditch & McHill (2019). The study suggests that a person’s cognitive performance is poorest immediately after awakening and reaches its peak three hours after awakening. Throughout this experiment, data will be obtained so that daytime productivity at 6:00 is the worst of the day, daytime productivity at 9:00 peaks, and daytime productivity at 7:00 is in between.
Sleep Dataset and 4-Fold Cross Validation A 75-day experiment was conducted with 15 subjects. We excluded days with issues such as equipment malfunctions or experiment interruptions, resulting in 51 valid days of data.
Each sample was prepared by mapping the time-series sleep data obtained from the experiment each night to the All-task scores on the following day. The time-series data contain 23 features (Table 1) extracted from ECG, RIP, and EDA, which were normalized in the range from 0 to 1. Additionally, we used the All-task scores at 20:00 as a baseline before the subjects went to sleep, so that the next day’s scores at 6:00, 7:00, and 9:00 could represent the recovery of cognitive abilities and sleepiness due to sleep.
To evaluate the model’s performance, we used 4-fold cross-validation. All sample data were split into four groups, with one group set as the test data and the remaining three groups as training data. The average accuracy of the four cross-validation rounds was calculated to determine the performance of the machine learning model. The model is trained using the Adam algorithm to minimize the crossentropy loss function. The learning rate is set to 0.001.
RESULT AND DISCUSSION
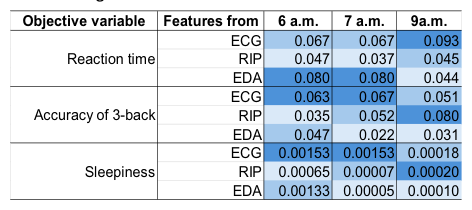
Accuracy of Constructed Model The model was trained to predict the reaction time of PVT-B, the accuracy rate of the 3-back test, and the sleepiness level at 6, 7, and 9 a.m. in the morning. As outlined in the model construction section, the prediction of reaction time and accuracy rate was performed using a regression model, while the prediction of sleepiness level compared to the 20:00 baseline was conducted using a three-category classification: better, same, and worse.
The trained model performed well in predicting reaction time, the accuracy rate of the 3-back task, and the sleepiness level, achieving an R2 coefficient greater than 0.5 and an F1 score of approximately 0.8 (Table 2). In previous studies, Langholm et al. (2023) only achieved a regression model’s coefficient of 0.21 in estimating sleepiness, Ishaque et al. (2022) were unable to estimate alertness (reaction time), and Zavecz et al. (2020) reported a lack of
association between subjective sleep quality and working memory. Therefore, despite our relatively small dataset (only 51 days), the Transformer model we constructed demonstrates high prediction accuracy for both classification and linear regression problems compared to previous studies. This indicates that the constructed model in this study for inferring daytime productivity is reliable.
The reason that we could achieve this high performance on estimating next daytime productivity from sleep data, is that our proposed method directly estimates daytime productivity from biometric data during sleep. This approach avoids the loss of information that occurs when estimating sleep parameters (such as duration, stage, and efficiency) from biometric data, allowing us to extract information more closely related to next-day productivity.
Table 2. Average accuracy of 4-fold validation when predicting each objective variable.
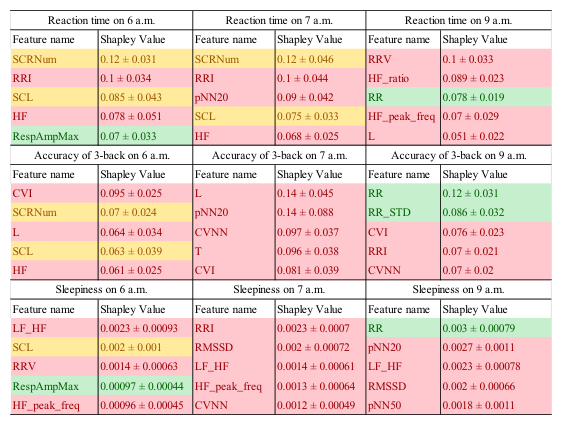
Interpretability of Constructed Model Using Shapley Value We calculated the Shapley values for each feature to interpret their contributions to the model’s predictions. For each cross-validation fold, we generated Shapley values for each feature, repeating this process 10 times. The mean and standard deviation of these values are shown in Table 3. The top 5 mean Shapley values for each objective variable are summarized in Table 4, with red, yellow, and green cells indicating features from ECG, EDA, and RIP, respectively.
Shapley values are comparable among features for the same objective variable but not across different variables due to different baselines and scales (Sundararajan et al., 2019). A larger Shapley value indicates a greater loss in prediction accuracy when the feature is excluded (Lee et al., 2022), representing its relative importance.
In Table 3, we observe two notable patterns worth discussing. First, the important features for the 6 a.m. and 7 a.m. objective variables differ from those for 9 a.m. This discrepancy can be attributed to the different types of sleep stages that affect cognitive abilities immediately after awakening (6 and 7 a.m.) versus those long after awakening (9 a.m.) (Gennaro et al., 1995). Second, the important features in estimating reaction time differ from those in estimating accuracy of 3-back and sleepiness. This difference is likely because the recovery of alertness relies on different bodily systems compared to those that govern working memory and sleepiness. While this hypothesis is plausible, we have not found any previous research to support this idea, indicating a need for further investigation.
In Table 4, we also observe following notable patterns worth discussing.
Constructing a Transformer-Based Model to Infer Daytime Productivity 183
First, the coefficient of variation (ratio of standard deviation to mean) for Shapley values ranges from 25% to 50%, likely due to small data points and individual differences.
Second, we would like to discuss the observations from the perspectives of reaction time, accuracy of the 3-back task, and sleepiness.
For reaction time, important features at 6 and 7 a.m. (SCRNum, RRI, SCL, HF) indicate sympathetic activation and stress levels are crucial for alertness. At 9 a.m., features like RRV, HF_ratio, RR, and HF_peak_frequency suggest respiratory rate and sympathetic activation affect alertness throughout the day.
For 3-back accuracy, important features at 6 a.m. (CVI, SCRNum, L, SCL) reflect parasympathetic activity and stress levels. By 7 a.m., parasympathetic activity remains key, and by 9 a.m., respiratory rate also becomes important.
For sleepiness, 6 a.m. features (LF_HF, RRV, HF_peak_freq, SCL, RespAmpMax) indicate sympathetic activation, stress levels, and respiratory amplitude matter. At 7 a.m., sympathetic activation (RRI, RMSSD, LF_HF, HF_peak_freq) is crucial, and by 9 a.m., both sympathetic activation and respiratory rate influence sleepiness.
Table 3. Average Shapley values of features from ECG, RIP, and EDA for each objective variable are shown, with deeper color cells indicating the highest values.
These observations highlight how physiological systems differently impact cognitive performance and alertness at various morning times. Sympathetic and parasympathetic activities, stress levels, and respiratory rates play distinct roles in reaction time, working memory accuracy, and perceived sleepiness.
Our findings highlight the need for further research to link biometric features to daytime productivity. Future studies should expand data collection to reduce individual differences, conduct longitudinal studies for deeper insights, and elucidate the mechanistic pathways connecting physiological systems to cognitive performance and alertness. This will help develop more accurate models for predicting and enhancing daytime productivity based on sleep-related biometrics.
Table 4. Top 5 Shapley values (Mean ± SD) of features towards each objective variable. Red, yellow, green cells refer to the features of ECG, EDA, and RIP.
CONCLUSION
In this study, we developed a Transformer-based model to predict daytime productivity, including alertness, working memory, and sleepiness, from sleep biometric data. The model showed high accuracy, with R2 coefficients for reaction time and accuracy rates, and an F1 score of 0.8 for sleepiness classification.
Key insights from Shapley values highlight the importance of sympathetic and parasympathetic activity, stress levels, and respiratory rate at different morning times. These findings align with and expand on existing sleep research.
Despite the small sample size and individual differences in sleep quality, our model showed promise. Future work will involve larger, more diverse participant pools and the incorporation of personal information to enhance the model’s robustness and versatility.
REFERENCES
Ashish Vaswani, Noam Shazeer, Niki Parmar, Jakob Uszkoreit, Llion Jones, Aidan N. Gomez, Lukasz Kaiser, Illia Polosukhin. (2017) Attention Is All You Need. arXiv:1706.03762. Benedek R., Lauren W., Péter B., Hao-Tsung Y., Olivér K., Sebastian N., Rik S.
(2022). The Shapley Value in Machine Learning, arXiv, 2202.05594. Craven, J., McCartney, D., Desbrow, B. et al. (2022) Effects of Acute Sleep Loss on Physical Performance: A Systematic and Meta-Analytical Review. Sports Med 52, 2669–2690. Crivello, A., Barsocchi, P., Girolami, M., & Palumbo, F. (2019). The meaning of sleep
quality: A survey of available technologies. IEEE access, 7, 167374–167390.
Constructing a Transformer-Based Model to Infer Daytime Productivity 185
E. Eldele et al., “An Attention-Based Deep Learning Approach for Sleep Stage Classification with Single-Channel EEG,”in IEEE Transactions on Neural Systems and Rehabilitation Engineering, vol. 29, pp. 809–818, 2021. F. Mendonça, S. S. Mostafa, F. Morgado-Dias, A. G. Ravelo-García and T. Penzel,
“A Review of Approaches for Sleep Quality Analysis,” in IEEE Access, vol. 7, pp. 24527–24546, 2019. Gashi, S., Alecci, L., Di Lascio, E., Debus, M. E., Gasparini, F., & Santini, S. (2022).
The role of model personalization for sleep stage and sleep quality recognition using wearables. IEEE Pervasive Computing, 21(2), 69–77. George A. Macones MD, Gary D. V. Hankins MD, Catherine Y. Spong MD, John Hauth MD, Thomas Moore MD. (2008). The 2008 National Institute of Child Health and Human Development Workshop Report on Electronic Fetal Monitoring: Update on Definitions, Interpretation, and Research Guidelines. Journal of Obstetric, Gynecologic & Neonatal Nursing, 2008, Volume 37, Issue 5, 510–515. Herscovitch, Joel, and Roger Broughton. “Sensitivity of the Stanford sleepiness scale
to the effects of cumulative partial sleep deprivation and recovery oversleeping.” Sleep 4.1 (1981): 83–92. Hilditch, C. J., & McHill, A. W. (2019). Sleep inertia: Current insights. Nature and science of sleep, 11, 155–165. Hsu, B., Emperumal, C. P., Grbach, V. X., Padilla, M., & Enciso, R. (2020). Effects
of respiratory muscle therapy on obstructive sleep apnea: A systematic review and meta-analysis. Journal of Clinical Sleep Medicine, 16(5), 785–801. Jaewook Lee, David E. Lumley, Un Young Lim. (2022). Improving total organic carbon estimation for unconventional shale reservoirs using Shapley value regression and deep machine learning methods. AAPG Bulletin 2022; 106 (11): 2297–2314. L. De Gennaro, M. Casagrande, C. Violani, M. Di Giovanni, J. Herman, M. Bertini,
(1995). The complementary relationship between waking and REM sleep in the oculomotor system: an increase of rightward saccades during waking causes a decrease of rightward eye movements during REM sleep, Electroencephalography and Clinical Neurophysiology, Volume 95, Issue 4, 252–256. Langholm, Carsten, Andrew Jin Soo Byun, Janet M Mullington and John B Torous.
(2023) “Monitoring sleep using smartphone data in a population of college students.” NPJ Mental Health Research 2. Ma, Y., Sun, S., Zhang, M. et al. (2020) Electrocardiogram-based sleep analysis for sleep apnea screening and diagnosis. Sleep Breath 24, 231–240. Mathias Basner, Daniel Mollicone, David F. Dinges, Validity and sensitivity of a brief
psychomotor vigilance test (PVT-B) to total and partial sleep deprivation, Acta Astronautica, Volume 69, Issues 11–12, 2011, Pages 949–959, ISSN 0094–5765. Sundararajan, Mukund, and Amir Najmi. (2019). “The many Shapley values for model explanation.” arXiv preprint arXiv:1908.08474 (2019). Susanne M. Jaeggi, Martin Buschkuehl, Walter J. Perrig & Beat Meier (2010) The concurrent validity of the N-back task as a working memory measure, Memory, 18:4, 394–412. Y. Dai et al., “MultiChannelSleepNet: A Transformer-Based Model for Automatic
Sleep Stage Classification With PSG,” in IEEE Journal of Biomedical and Health Informatics, vol. 27, no. 9, pp. 4204–4215, Sept. 2023. Y. Wu and C. Lian (2022), “A Novel Dilated Causal Convolutional and Transformer Attention Prototype Network with Cut Feature Map for ECG Classification,” 2022 China Automation Congress (CAC), Xiamen, China, 2022, pp. 981–986.
Zakia Ishaque, Owais Kamdar, Maryam Moghul, Yacob Yousef. (2022) Analysis of the Correlation of Sleep Patterns and Reaction Time. Journal of Science and Medicine, doi: 10.37714/JOSAM. VI0.100. Zavecz, Z., Nagy, T., Galkó, A. et al. The relationship between subjective sleep
quality and cognitive performance in healthy young adults: Evidence from three empirical studies. Sci Rep 10, 4855 (2020).
LISTED IN THE AHFE DIGITAL BOOKSTORE CATALOGUE
Explore the complete digital volume
Human Systems Engineering and Design (IHSED2024): Future Trends and Applications
Read this individual research paper free through the original publisher, or explore the full digital proceedings book.
ISBN 978-1-964867-34-2
Explore this ISBN in the AHFE Bookstore ↗Listed in the July 2026 bookstore catalogue; search by ISBN to confirm current availability · Digital book purchase optional