Sara Mostowfi, Kangwon Seo, Jung Hyup Kim, Danielle Oprean, Fang Wang, Yi Wang (2024). Investigating effectiveness of distraction rate: augmented reality-based eye-tracking feature to predict student formative and summative performance. In: Human Factors in Design, Engineering, and Computing. AHFE Open Access, vol. 159, pp. 1027–1037. https://doi.org/10.54941/ahfe1005669
Augmented reality (AR) is gaining attraction as a valuable aid in training and educational settings. However, the cognitive overload due to the new learning environment may hamper effective learning during the AR sessions. For this reason, monitoring students learning status with an effective metric is required. Distraction rate (DR) is a feature extracted from a student’s eye-tracking coordinates data developed to measure the distracted proportion of a student in an AR learning session (Deay, 2023). In this study, we investigate DR with students’ formative and summative assessment outcomes to validate its effectiveness as a predictor for student performance.Methods: To do this, students learned a topic of biomechanics through several AR modules. The results of quizzes taken after each AR module and their class exam outcomes taken at the end of semesters provide formative and summative evaluation performances, respectively. The data were collected in two years in the same setup. To compute DR, the standard eye-tracking coordinates, called baseline, and those of an observed student are compared. In order to reduce false alarms, two sources of noise are accounted for. First, temporal noise caused by quick deviations from the baseline that only lasts for a short period of time is removed by computing the moving average of eye-tracking curves. Second, spatial noise caused by slight deviations in a student’s sight from the virtual instructor is reduced by applying a threshold to determine whether the deviation is large enough. Finally, the proportion of moving average signals exceeding the threshold is computed.Using mixed effects logistic regression models, this study shows how DR and students' performance are related while considering the year and student variations. To extract DR from eye-tracking data, two parameters should be determined, the window size and threshold. In this study, we carried out a comparison study with several parameter values with respect to the model’s prediction performance to find the best parameter tuning.Key Findings:For the formative performance, the results indicate that DR is a significant predictor for the probability of correct answers. For the summative performance, DR does not show a significant relationship with students’ exam scores, yet the negative regression coefficient of DR can be still found, indicating that the high DR value results in low performance in the exam. It can be interpreted that, due to the time interval between AR learning and exams, even if some students may have not paid much attention during the AR learning sessions, they could catch up on the material later by themselves. Overall, it is found that the exam performance is less sensitive, compared to the quiz performance, to students’ attention paid to AR learning sessions. Accordingly, the relationship between DR and summative performance is likely to be weaker than the case of formative assessment.
Augmented reality (AR) is being actively explored for its potential to enhance education and training. Studies have shown significant benefits, such as improved knowledge retention (Radu, 2012), increased motivation (Gutiérrez and Fernández, 2014), and higher learning gains (Akçayır and Akçayır, 2017). Assessments of AR in education reveal its growing popularity and benefits, including support for kinesthetic learning through interactive 3D visualizations, which enhance memorization and understanding (Alzahrani, 2020). AR environments also support self- learning (Martin-Gutierrez et al., 2012) and have been widely applied in various educational settings (Bacca et al., 2014).
Despite these benefits, challenges persist. Wu et al. (2013) noted that AR could lead to cognitive overload, complicating the learning process. Additionally, there are concerns about students’ ability to effectively operate AR devices, which impacts usability and ultimately the effectiveness of learning. This may require relatively longer training periods of AR compared to traditional methods. A major challenge in delivering effective AR learning experiences is ensuring learners focus on appropriate elements within the 3D space. Studies indicate that students may experience cognitive burden and distraction in AR settings (Akçayır and Akçayır, 2017). In physical teaching environments, teachers can help students who seem lost or distracted, but this interaction is missing in online learning, which deepens the gap between in-person and online education. Using real-time monitoring and feedback to track and adjust student focus could reduce early disengagement and improve education outcomes.
Meanwhile, with the increasing prevalence of eye-tracking technology in AR devices, analysing eye-movement data has become a promising approach to gauge attention and predict academic performance in AR settings (Alemdag and Cagiltay, 2018). In this paper, developing an eye-tracking metric aims to measure a distraction level, that is, to what extent a student fails to focus on a corresponding AR learning session. If one cannot pay enough attention than expected, we may assume that the cognitive state of the student is somehow abnormal and make some appropriate feedback or even stop the learning process. In educational contexts, distraction is typically divided into mind-wandering and external distractions (Unsworth et al., 2014; Varao-Sousa et al., 2019). Mind-wandering involves shifts in attention due to internal thoughts, while external distractions are real-world interruptions that disrupt the learning process. Both types are known to adversely affect information retention (Szpunar et al., 2013).
The eye-tracking coordinates measurements collected during AR sessions play an important role on measuring one’s cognitive status. Specifically, we explore the effectiveness of distraction rate (DR), a feature extracted from eye-tracking data, to measure the distracted proportion of time in an AR session. Deay (2023) reported DR was an effective metric to measure the distracted proportion of a student in an AR learning environment for engineering education. However, the effectiveness of DR was only evaluated for students’ formative performance by investigating significance of DR to quiz scores that were taken immediately after learning each module. Through this study, we investigate whether DR reliably assesses student’s summative performance as it does for formative performance. Validating the connection between eye-tracking distraction rate metrics and academic outcomes has been achieved through statistical analysis using a mixed effects logistic regression model.
METHODS
For this study, we developed a total of fifteen 3D scenes using the Unity Game Engine, with seven modules in lecture 1 and eight modules in lecture 2. The time duration of each module is about 5 to 6 minutes. Lecture 1 introduces
Investigating Effectiveness of Distraction Rate 1029
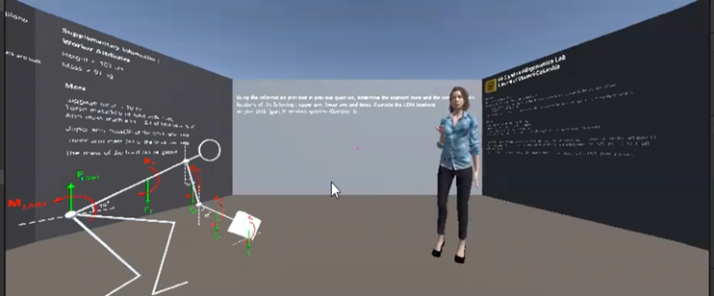
biomechanics and demonstrates how to draw force and moment on different body segments, including basic biomechanics knowledge, static equilibrium, multiple link examples, and center of mass. Lecture 2, more challenging than Lecture 1, reviews the concepts covered in Lecture 1 and introduces free body diagrams on hand, upper arm, lower arm, and trunk segments. Each scene includes a large semicircular blackboard with five interconnected panels, providing an immersive experience for users. The panels display various elements such as figures, a virtual instructor, human avatars, formula calculations, problem statements, and tables of figures (see Figure 1).
Figure 1: A scene in the AR environment showing the panel arrangement.
Experiments for AR Learning and Assessments Experiments were conducted over a two-year period using AR technology in the ergonomics lab at the Department of Industrial and Systems Engineering at the University of Missouri-Columbia. A total of 52 students, 31 from the first year and 21 from the second year, participated in the experiments. In the experiment set up participants were equipped with HoloLens for accessing AR learning content, engaged in the experimental sessions lasting approximately 35 to 40 minutes for each lecture.
The AR setup featured seven distinct learning spots for each module allowing participants to interact with the content as they moved across the room. During the educational session, students were instructed to walk to designated numbers on the floor while maneuvering a table. To engage each learning module, students had to move the table to a marked “X” on the floor, which matched the corresponding module number displayed on the wall. Additionally, participants could revisit any scene by going back to the respective number and relocating the table to reactivate the module.
After each module participants were required to respond to a quiz question regarding the material they have learned in each module. The score after each module is based on 0–1 which shows if answer is correct (1), or incorrect (0). In addition, the exam on biomechanics was provided about one month later after the experiment. A student’s exam score was calculated based on the questions which were related to the materials they have learned in the AR
1030 Mostowfiet al.
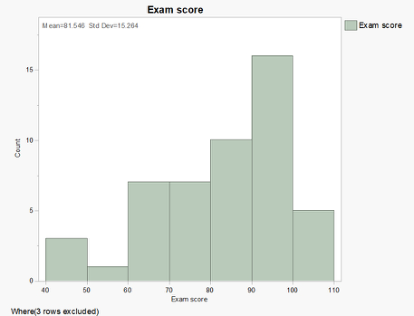
experiment. There were 3 students, out of 52, who didn’t take the exam and thus they were removed from the exam data. The histogram of remaining students’ scores is shown in Figure 2.
Eye-Tracking Data Each participant’s eye-tracking data for 14 modules across 2 lectures was imported and processed individually. The data cleaning process involved removing unnecessary columns, renaming important ones, restructuring the time column to start from zero in seconds, and computing the average x- and y-coordinates for each second. For seconds without data, “NA”was used as a placeholder. The processed data was organized by lecture, with each student’s data split into two files, each containing the data for 7 modules corresponding to a lecture.
Figure 2: Histogram of students’ exam scores over two years.
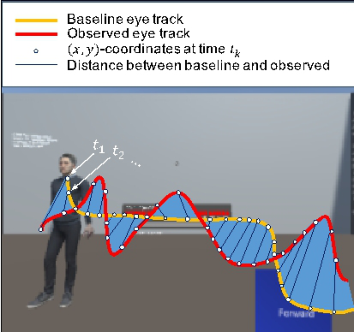
As with Deay (2023), this study used the baseline data from ideal eye-tracking coordinates obtained by recording standard AR learning sessions. This dataset served as a reference to evaluate how closely each student’s gaze patterns matched the expected patterns when following the virtual instructor. It was hypothesized that a closer match to the baseline would indicate a higher likelihood of getting better performance in formative and summative learning assessments. To quantify the match between students’ observed eye-tracking data and the baseline, metrics such as the average difference and DR were developed (Deay, 2023). These metrics initially aimed to numerically assess the accuracy of students’ gaze patterns relative to the baseline and predict their performance on quizzes. Figure 3 illustrates a conceptualized example of how the difference between the baseline and actual eye-tracking coordinates is computed.
Distraction Rate (DR) Euclidean distance would be the simplest metric to measure the difference between the (x, y)-coordinates of the baseline and the observed one. The main idea of DR is to reduce a significant number of false signals that are
Investigating Effectiveness of Distraction Rate 1031
incorrectly indicating a student’s distraction included in Euclidean distance. This can be achieved by eliminating two sources of noise involved in raw eye-tracking data. First, spatial noise factors can occur when students deviate slightly from the virtual instruction or object of interest while still maintaining their focus on the lecture. Second, temporal noise are deviations from the baseline which only last for a short period of time. Accounting for these two noise factors, DR is computed as follows.
Figure 3: Illustration of the difference between the baseline and observed eye-tracking coordinates at time points tk, k = 1, 2, . . . , n.
STEP 1 (Smoothing by moving average) Temporal noise is deviations from the baseline which only last for a short period of time. Prolonged deviations from the baseline should be a much stronger indicator of student distraction than short-term deviations. To reduce sensitivity caused by such a quick deviation, Euclidean distances between the baseline and actual student eye-tracking coordinates are smoothed by moving average. In order to compute the moving average, Euclidean distance at the current time point t is replaced with the average of several distances at time points around t. The total number of data points included in the average is referred to as the moving average window or W. As a result, impacts of signals showing drastic but quick changes are reduced.
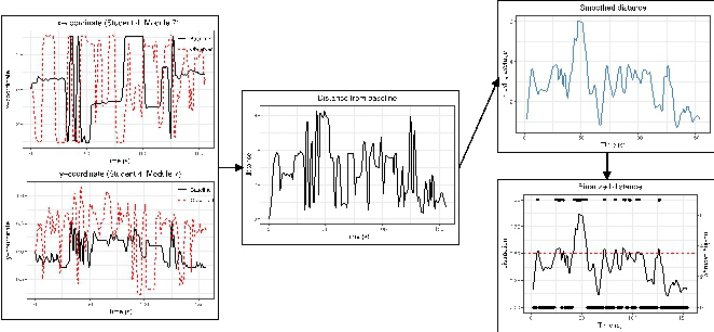
STEP 2 (Thresholding and binarization) Binarization refers to an image processing technique used to convert a color image into a binary image where pixel values in the image are changed to 0, representing background, and 1, for the object of interest (Chaki et al., 2014). DR uses a similar technique to reduce sensitivity caused by spatial noise. The smoothed distances less than a minimum distance threshold δ are killed, i.e., zeroed, and only those exceeding the threshold are kept. In addition, students’ cognitive statuses at time points when distances are less than δ are all treated as “paying attention” and recorded as 0, while those at time points when distances surpass δ are all treated as “distracted” and recorded as 1. In other words, students’ cognitive statuses are classified as either attention or distraction. Figure 4 depicts the
1032 Mostowfiet al.
process of computing the distance of observed eye-tracking instance from the baseline, smoothing by moving average, and binarization.
Figure 4: Computing process of DR.
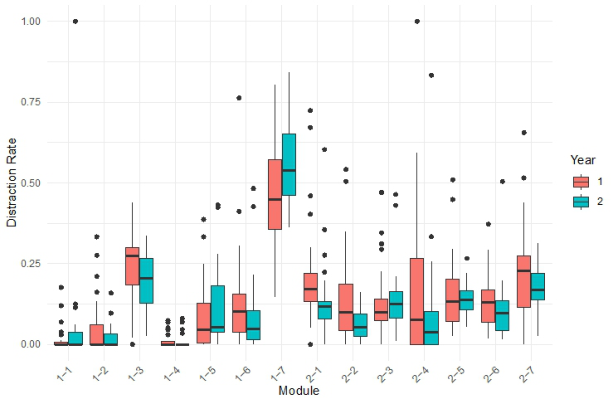
STEP 3 (Computing proportion) Lastly, the average of the binarized array is computed, producing the proportion of the “distracted” statuses during the corresponding module. The computed DR under W = 6 and δ = 2 for each module across two years’ experiments is shown in Figure 5.
Figure 5: Box plots of DRs for each module.
Investigating Effectiveness of Distraction Rate 1033
STATISTICAL ANALYSIS AND RESULTS For the formative performance, the mixed-effects logistic regression model is used with the students’ quiz outcomes in the 2nd year, which can be written as follows.
= βquiz
logit
pquiz ij
0 + βquiz
1 DRij + modulej + studenti (1)
where pquiz
ij is the probability that the i-th student correctly answers the given quiz problem of the j-th module, j = 1, . . . , 14, logit(pquiz ij ) = log (pquiz ij /(1 −pquiz
ij )) is the log odds of the correctness of an answer, DRij is the computed value of DR of the i-th student for the j-th module, modulej is the effect of j-th module (fixed factor), studenti is the effect of i-th student
βquiz
(random factor), and βquiz =
is the regression coefficients.
0 , βquiz
1 T
Using the function glmmPQL provided by MASS package of R, the parameter estimates of DR was obtained as bβquiz
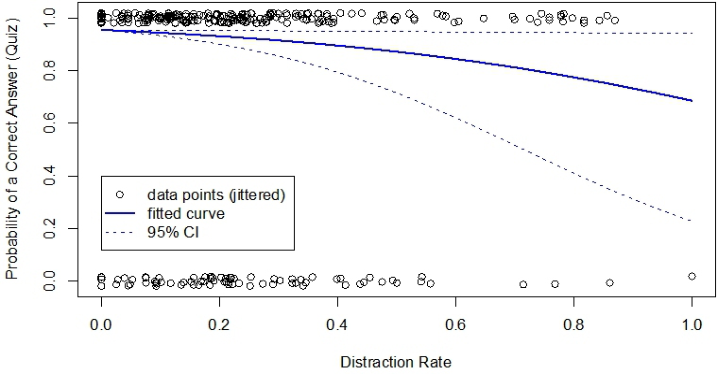
1 = −2.28 with the p-value 0.0266 < 0.05. The relationship between DR and the quiz outcome is depicted in Figure 6.
Figure 6: Fitted curve along with 95% confidence interval for the quiz outcomes.
For the summative performance, students’ exam scores are used as a response variable. As the range of exam includes all 14 modules of AR sessions, the average DR is computed for each participant to be used as a predictor for exam scores. The following model is used for the exam.
= βexam
logit
pexam
0 + βexam
1 avgDRi + yeark + studenti (2)
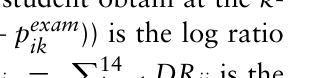
ik where pexam ik × 100 is the exam score that the iti-th student obtain at the k- th year, k = 1, 2, logit(pexam
ik ) = log (pexam
ik /(1 −pexam
Equation reproduced from the original PDF.
1034 Mostowfiet al.
βexam
average of DRs for the iti-th student over 14 modules, yeark is the effect of k-th year (fixed factor), studenti is the effect of iti-th student (random factor), and βexam =
0 , βexam
1 T is the regression coefficients. The parameter estimates of the average DR was obtained as bβexam
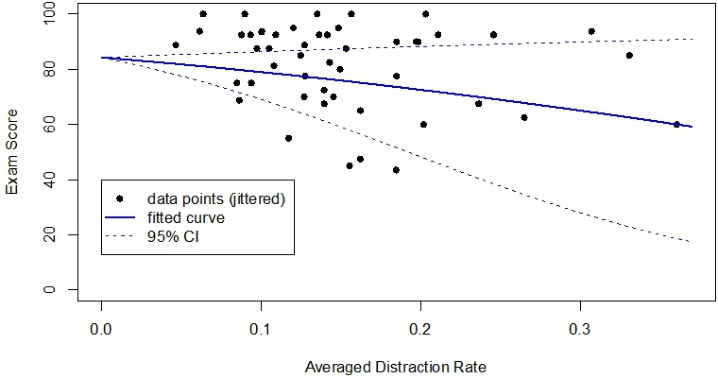
1 = −3.52, however it was found to be not a significant predictor with the p-value 0.1852. The relationship between the average DR and the exam score is depicted in Figure 7.
Figure 7: Fitted curve along with 95% confidence interval for the exam score.
Multiple interpretations are possible regarding the insignificancy of the averaged DR. First, the sample size used for the statistical hypothesis test with the exam score data is substantially smaller compared to the sample size of the quiz score data. This is because one student has only one exam score instead of 14 module quizzes scores, that could result in the relatively high p-value. Second, intuitively the exam score is less direct indicator to measure students’ attention degree during the AR learning sessions because the exam was tested about a month later from AR learning sessions. Some students who did not pay much attention on the AR session could review material later to catch up and achieve better performance than expected.
SELECTION OF OPTIMAL PARAMETERS FOR DR As described earlier, two parameters are involved in DR computation. First W is the total number of time points included in the moving average window, influencing how much the data is smoothed. A larger W results in greater smoothing, which can help reduce the impact of short-term fluctuations but might obscure brief yet significant distractions. Second, the threshold parameter δ determines whether a deviation is significant enough to be considered as a distraction. A large δ leads to a less sensitivity of a deviation from the baseline. In this study, values of (W, δ) = (5, 1.5) for the quiz data and (W, δ) = (6, 2) for the exam data were used. These specific
Investigating Effectiveness of Distraction Rate 1035
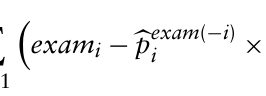
sets of parameter values were determined by grid search over several pairs of parameter values to minimize the predicted residual error sum of squares (PRESS). For example, for the exam data, given (W, δ), PRESS is computed as follows.
2
49 X PRESS =
(3)
i × 100
Equation reproduced from the original PDF.
i is the predicted exam score of i-th student where the model of Equation (2) fits data without i-th student’s instance. Table 1 shows the search results. With W = 6 and δ = 2.0, PRESS is minimized as 12, 921, which corresponds to p
12, 921/49 = 16.24 of prediction error of an exam score in average. It can be also shown that, with those parameter values, the p-value of the parameter estimate is also minimized.
Table 1. Comparison of models with different parameter values.
We explored various facets of the relationship between DR and student performance of quizzes and an exam. The negative coefficient associated with DR in the regression model suggests an inverse relationship with performance, indicating that higher DRs are likely to result in decreased academic outcomes. However, this relationship is nuanced, as evidenced by instances where initial high DRs were followed by improved performance than expected, illustrating a possible catch-up effect. According to our data, some students have got high scores in the exam but their average DR
1036 Mostowfiet al.
was high, indicating they may have studied in the time interval between AR sessions and the exam. Furthermore, the influence of DR on exam performance may be less pronounced compared to more direct assessments like quizzes, highlighting the complexity of assessing cognitive engagement during AR learning sessions using their exam scores.
Considering methodological perspectives, the time interval between the AR experiment and exams emerged as a factor potentially influencing the observed relationship. A longer interval might introduce additional confounding variables, impacting the significance of DR on exam outcomes.
Aggregating DR data over modules and lectures offers a comprehensive perspective on students’ engagement patterns, enabling the identification of trends that may not be discernible when analysing individual sessions. However, significant outcomes may not be apparent with smaller samples of our analyses.
Moreover, leveraging techniques like PRESS for parameter tuning ensures optimal predictive performance of regression models, surpassing traditional methods in evaluating model efficacy on unseen data.
CONCLUSION
For the formative performance, the results indicate that DR is a significant predictor for the probability of correct answers. For the summative performance, DR does not show a significant relationship with students’ exam scores, yet the negative regression coefficient of DR can be still found, indicating that the high DR value results in low performance in the exam. It can be interpreted that, due to the time interval between AR learning and exams, even if some students may have not paid much attention during the AR learning sessions, they could catch up on the material later by themselves. Overall, it is found that the exam performance is less sensitive, compared to the quiz performance, to students’ attention paid to AR learning sessions. Accordingly, the relationship between DR and summative performance is likely to be weaker than the case of formative assessment.
ACKNOWLEDGMENT
The authors would like to acknowledge the support by the National Science Foundation (IIS-2202108) for this work.
REFERENCES
Akçayır, M. and Akçayır, G. (2017) “Advantages and challenges associated with augmented reality for education: A systematic review of the literature.” Educational Research Review, 20, pp. 1–11. Alemdag, E. and Cagiltay, K. (2018) “A systematic review of eye tracking research on multimedia learning.” Computers & Education, 125, pp. 413–428. Alzahrani, N. M. (2020) “Augmented reality: A systematic review of its benefits and
challenges in e-learning contexts.” Applied Sciences, 10(16), p. 5660. Bacca, J., Baldiris, S., Fabregat, R., Graf, S. and Kinshuk (2014) “Augmented reality trends in education: a systematic review of research and applications.” Educational Technology and Society, 17(4), pp. 133–149.
Investigating Effectiveness of Distraction Rate 1037
Chaki, N., Shaikh, S. H., Saeed, K. (2014) A comprehensive survey on image binarization techniques. In: Exploring Image Binarization Techniques. Studies in Computational Intelligence, vol 560. Springer, New Delhi. Deay, M. (2023). Predicting Student Performance in an Augmented Reality Learning Environment Using Eye-Tracking Data (MS thesis, University of Missouri-Columbia). Gutiérrez, J. M. and Fernández, M. D. M. (2014) “Applying augmented reality in
engineering education to improve academic performance & student motivation.” The International Journal of Engineering Education, 30(3), pp. 625–635. Martin-Gutierrez, J., Guinters, E. and Perez-Lopez, D. (2012) “Improving strategy of self-learning in engineering: laboratories with augmented reality.” Procedia-Social and Behavioral Sciences, 51, pp. 832–839. Radu, I. (2012). “Why should my students use AR? A comparative review of
the educational impacts of augmented-reality”, In 2012 IEEE International Symposium on Mixed and Augmented Reality (ISMAR). pp. 313–314. Szpunar, K. K., Moulton, S. T. and Schacter, D. L. (2013) “Mind wandering and education: From the classroom to online learning.” Frontiers in Psychology, 4, 495. Unsworth, N. and McMillan, B. D. (2014) “Similarities and differences between
mind-wandering and external distraction: A latent variable analysis of lapses of attention and their relation to cognitive abilities.” Acta psychologica, 150, pp. 14–25. Varao-Sousa, T. L., Mills, C. and Kingstone, A. (2019) “Where you are, not what you see: The impact of learning environment on mind wandering and material retention.” In Proceedings of the 9th International Conference on Learning Analytics & Knowledge, pp. 421–425. Wu, H. K., Lee, S. W. Y., Chang, H. Y. and Liang, J. C. (2013) “Current status,
opportunities and challenges of augmented reality in education.” Computers & Education, 62, pp. 41–49.
LISTED IN THE AHFE DIGITAL BOOKSTORE CATALOGUE
Explore the complete digital volume
Human Factors in Design, Engineering, and Computing
Read this individual research paper free through the original publisher, or explore the full digital proceedings book.
ISBN 978-1-964867-35-9
Explore this ISBN in the AHFE Bookstore ↗Listed in the July 2026 bookstore catalogue; search by ISBN to confirm current availability · Digital book purchase optional